Journal of Chemical and Pharmaceutical Research, 2013, 5(11):159-163
Research Article
CODEN(USA) : JCPRC5
ISSN : 0975-7384
The physiological characteristics research of human gait based on wavelet
multi-scale entropy analysis
Yixin Wu
School of Exercise Human Science, Shenyang Sport University, Shenyang, China
_____________________________________________________________________________________________
ABSTRACT
The walk-run sport is a movement that is very easy to implement and can help protect health and mental wellbeing. This article focuses on the gait biometrics characteristics in the process of walking, by studying the biometrics characteristics of the gait to provide data basis for the movement guidance and clinical therapy. Human gait is a biometric characteristics, with difficult to disguise, little affected by environment and other unique advantages. Along with the development of physiological signal analysis techniques, this paper studies the gait of eight different study objects in the walk-run movement course, and uses wavelet multi-scale entropy analysis method. Research shows that the mean values in the axial direction of 8 study objects’ peak values are larger and all concentrated between 3.0-3.6, with little individual differences; Conducts feature points information analysis of the two states of three study objects, the peak position overall moves in the low-frequency section in the non-normal state, the total entropy value increases in the Y axial direction and decreases in the Z axial direction. Through this theoretical explanation and the data statistical results, this research method can well solve the needs of motion analysis and medical data.
Key words: Wavelet entropy, human physiology, physiological signals, gait characteristics
_____________________________________________________________________________________________
INTRODUCTION
The analysis and processing of physiological signal is a research field of great significance in modern biomedical engineering. The gait characteristic represents a lot of information the rest and exercise state of human body, which belongs to specific category in physiological signals. Gait is a biometric characteristic, without the effect of the distance, non-invasive, difficult to disguise, little affected by environment and other unique features, which has received insider’s attention in recent years. Gait is the attitude collectivity of people in the walking process. The body's physiological function will impact human gait on different degrees, that is the human health condition and physiological characteristics can be represented by gait [1,2]. The most important mechanical feature of gait is the acceleration. Through the analysis of acceleration the characteristics of gait can be drawn in order to realize quantitative analysis of human motion through these features.
The advanced algorithms commonly used by data mining and processing of gait signal includes time domain analysis, frequency domain analysis, time-frequency analysis and nonlinear analysis, etc., mathematical tools we need to use has Fourier transform, wavelet transform, Chaos and genotyping analysis, nonlinear prediction and data mining techniques [3,4]. This article analyzes the gait acceleration of human body based on a wavelet multi-scale entropy method; this method has a better applicability and accuracy in gait analysis [5,6].
______________________________________________________________________________
previous work this paper uses wavelet multi-scale entropy analysis method to study gait, in order to provide a theoretical basis and data reference for the quantitative analysis of walk-run motion and clinical analysis of medical.
The principles and methods of wavelet multi-scale entropy analysis
Wavelet analysis is extensively applied in signal processing, image generation, bio-engineering, and artificial intelligence. This analysis method is a method different from time-frequency analysis, but a time-frequency localization analysis method that window size is fixed, its shape can change, and the time window and frequency window can both change. The low-frequency part has a higher frequency resolution and a lower time resolution, the high frequency part has a higher time resolution and a lower frequency resolution, which is known as "Math microscope." Wavelet entropy is developed by Osvaldo. A etc. on the basis of the wavelet decomposition and reconstruction theory. Compared to the conventional entropy analysis based on the Fourier transform power spectrum; as its amplitude and energy is independent of signal, wavelet entropy contains new information [7].
Multi-scale entropy analysis method is a method to describe the irregularity degree of the time series at different time scales based on sample entropy. Multi-scale entropy includes the scale factor, embedding dimension and threshold three parameters.
Suppose a discrete time series have Lpoints in total, conduct coarse-breakpoint transform on the sequence in order
to obtain new time sequence s, the coarse-breakpoint transform is in the formula (1) as follows:
jr
r j i
j x i
y
1 ) 1 (
) ( 1
(1)
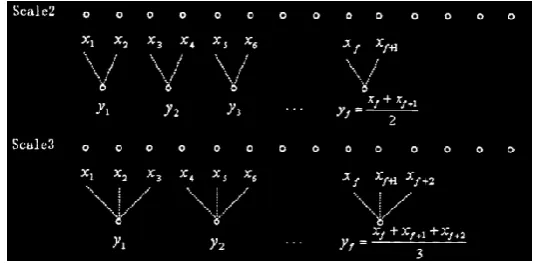
[image:2.595.171.441.408.540.2]In Formula (1) means the scaling factor, the length of each coarse - breakpoint time sequence isL/ , when the scale is 1, the coarse - breakpoint time sequence is the original time sequence, and the schematic diagram of scale transformation is shown in Figure 1:
Figure 1: Schematic diagram of scaling variation
The length of the time sequence obtained according to scale change of is
L
N
, form a group ofm -dimensional vector
1
1 Y N m
Y
in consecutive serial, the expression of the ith dimension is shown in formula (2)
1 ,
, 2 , 1 , 1 ,
, 1
,
y i y i y i m i N m
i
Y (2)
Provide
Y i Y j
d ,
equals scale factor , then the representing method of the absolute maximum distance between the vector
iY
and the corresponding element of vector
jY
is in the formula (3),
k j y k i y j
Y i Y
For a given threshold valuer, for each value ofi N m 1, the ratio of the number ofd
Y
i ,Y
j
lessthanr and the total distance number N m associated with this number is denoted byC
rm r i
,
, its calculation form is the formula (4):
d
Y
i Y
j
r
MN r
Ci m
( ) ( )
,
,
1
(4)
In Formula (4) C
rm r i
,
represents the time scale , takeY
i as the center, when the embedding dimension ism and the threshold value isr , the probability of the distance
Y i Y j
d ,
between the rest vector
j Y and
i Y less thanr represents the association degree of all
)
(i j
j
Y
and
iY
. Averaging all the points, the solution method is in the formula (5) below:
1 1 , 1 , 1 m N i m m r C m N iC (5)
In Formula (5) C
rm r i
,
represents the average degree of autocorrelation of the time seriesy
i .If increase the dimension tom 1, can be obtained, theC
rm i
,
under the dimensionsm 1, the average valueC
rm i
1 ,
is obtained; in theory, the sample entropy of this time sequence under scale of is defined in the formula (6):
C r
r C r m m m N , 1 , ln lim , SampEn (6)
In Formula (6) the value of SampEn is related tom,r, and generally takem 2,r 0.10.2SD , SD represents the standard deviation of the raw data.
When the number valueN of the original data is finite, based on the above steps the sequence length N can be drawn, the estimated value of the sample entropy in scale of is shown in the formula (7):
r C r C r m m m , 1 , ln , , SampEn (7)
Multi-scale entropy is defined as the collection of sample entropy in a number of scales, so multi-scale entropy is in the formula (8) below:
r C r C r m m m , 1 , ln , , Sampen MSE (8)
______________________________________________________________________________
Data empirical analysis
The data statistics of peak feature point
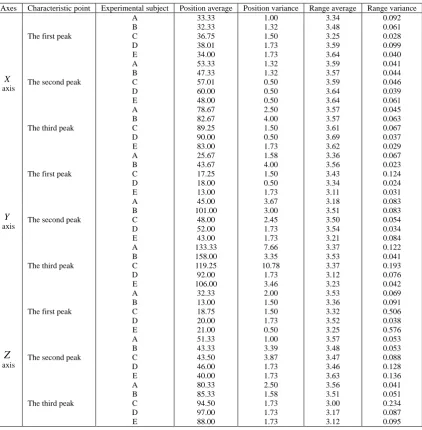
[image:4.595.97.520.168.599.2]Multi-scale entropy graph has a peak value under some specific scale. Extract the amplitude and location information of these peaks to evaluate its reproducibility, take it as the extracted feature value in order to reflect the specificity of the accelerated information entropy in the body walking process. Table 1 shows acceleration signal information of the five study objects in the three axis of three-dimensional coordinate system.
Table 1: The data statistics of peak feature point
Axes Characteristic point Experimental subject Position average Position variance Range average Range variance
X
axis
The first peak
A 33.33 1.00 3.34 0.092
B 32.33 1.32 3.48 0.061
C 36.75 1.50 3.25 0.028
D 38.01 1.73 3.59 0.099
E 34.00 1.73 3.64 0.040
The second peak
A 53.33 1.32 3.59 0.041
B 47.33 1.32 3.57 0.044
C 57.01 0.50 3.59 0.046
D 60.00 0.50 3.64 0.039
E 48.00 0.50 3.64 0.061
The third peak
A 78.67 2.50 3.57 0.045
B 82.67 4.00 3.57 0.063
C 89.25 1.50 3.61 0.067
D 90.00 0.50 3.69 0.037
E 83.00 1.73 3.62 0.029
Y
axis
The first peak
A 25.67 1.58 3.36 0.067
B 43.67 4.00 3.56 0.023
C 17.25 1.50 3.43 0.124
D 18.00 0.50 3.34 0.024
E 13.00 1.73 3.11 0.031
The second peak
A 45.00 3.67 3.18 0.083
B 101.00 3.00 3.51 0.083
C 48.00 2.45 3.50 0.054
D 52.00 1.73 3.54 0.034
E 43.00 1.73 3.21 0.084
The third peak
A 133.33 7.66 3.37 0.122
B 158.00 3.35 3.53 0.041
C 119.25 10.78 3.37 0.193
D 92.00 1.73 3.12 0.076
E 106.00 3.46 3.23 0.042
Z
axis
The first peak
A 32.33 2.00 3.53 0.069
B 13.00 1.50 3.36 0.091
C 18.75 1.50 3.32 0.506
D 20.00 1.73 3.52 0.038
E 21.00 0.50 3.25 0.576
The second peak
A 51.33 1.00 3.57 0.053
B 43.33 3.39 3.48 0.053
C 43.50 3.87 3.47 0.088
D 46.00 1.73 3.46 0.128
E 40.00 1.73 3.63 0.136
The third peak
A 80.33 2.50 3.56 0.041
B 85.33 1.58 3.51 0.051
C 94.50 1.73 3.00 0.234
D 97.00 1.73 3.17 0.087
E 88.00 1.73 3.12 0.095
As shown in Table 1, the average magnitude of all axes is relatively close, substantially concentrated in between 3.0-3.6. There are small differences between individuals, there are many overlapping range of all amplitude values. If the amplitude alone cannot be resolved to get a clear analysis, but meanwhile the location mean and variance of another indicator’s peak point can more dispersedly and clearly project the distribution condition.
The data comparison of normal and abnormal gait characteristic point
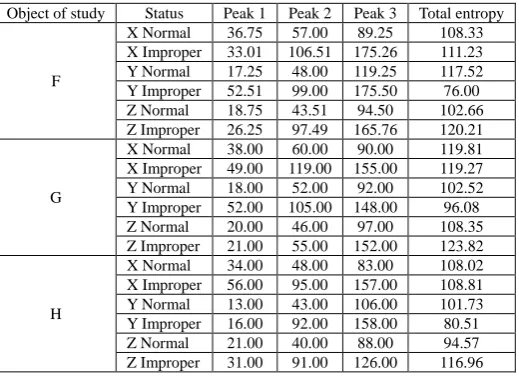
Table 2: The data statistics list of two gait feature points
Object of study Status Peak 1 Peak 2 Peak 3 Total entropy
F
X Normal 36.75 57.00 89.25 108.33
X Improper 33.01 106.51 175.26 111.23
Y Normal 17.25 48.00 119.25 117.52
Y Improper 52.51 99.00 175.50 76.00
Z Normal 18.75 43.51 94.50 102.66
Z Improper 26.25 97.49 165.76 120.21
G
X Normal 38.00 60.00 90.00 119.81
X Improper 49.00 119.00 155.00 119.27
Y Normal 18.00 52.00 92.00 102.52
Y Improper 52.00 105.00 148.00 96.08
Z Normal 20.00 46.00 97.00 108.35
Z Improper 21.00 55.00 152.00 123.82
H
X Normal 34.00 48.00 83.00 108.02
X Improper 56.00 95.00 157.00 108.81
Y Normal 13.00 43.00 106.00 101.73
Y Improper 16.00 92.00 158.00 80.51
Z Normal 21.00 40.00 88.00 94.57
Z Improper 31.00 91.00 126.00 116.96
As shown in Table 2, the peak position of non-normal state moves to the low frequency overall, in the range of 150-170 scales there appears a new peak, thus the frequency distribution of acceleration in non-normal state becomes low, so it contains more low frequency information; By comparing the total entropy of the three experiment objects, the total entropy of the Z-axis direction is increased than the normal state, indicating that the collected acceleration data has orderly decreased, most likely caused by left-right asymmetry of the test case, resulting disordered waveform, so that the entropy increases. In the Y-axis direction, the total entropy significantly reduced than the normal state, the regulation of action balancing is different from normal. In order to maintain balance oscillation amplitude and frequency need to be controlled, man-made swing around makes it orderly, so the total entropy decreases.
CONCLUSION
In this paper, it studies the gait of eight different study objects in the walk-run course, uses the wavelet multi-scale entropy analysis method, this paper first describes the mathematical model and calculation principles of the wavelet entropy, and then discusses the several characteristics of the traditional entropy analysis method, and finally through data statistics studies the peak points’ characteristic of eight study objects; the mean values in the axial direction of 8 study objects’ peak values are larger and all concentrated between 3.0-3.6 , with small individual difference, by the statistics in table 1, better results can be drawn, followed by feature points information analysis in the two states of three study objects; the peak position overall moves in the low-frequency section in the non-normal state, the total entropy value increases in theY axial direction and decreases in the Z axial direction, the changes of total entropy
value can infer the cause of abnormal state. In this paper, the gait research based on wavelet multi-scale entropy analysis can obtain the body's physical state conditions by studying human gait information, which can make a scientific guide for the study of sport, can also provide data base for the medical industry.
REFERENCES
[1]Bing Zhang, 2013, International Journal of Applied Mathematics and Statistics, 44(14), 422-430.
[2]Bing Zhang,Yan Feng, 2013, International Journal of Applied Mathematics and Statistics, 40(10), 136-143. [3]Haibin Wang, Shuye Yang, 2013, International Journal of Applied Mathematics and Statistics, 39(9), 243-250. [4]Hongwei Yang, 2013, Int. J. Appl. Math. Stat., 39(9), 188-195.