© 2016, IRJET | Impact Factor value: 4.45 | ISO 9001:2008 Certified Journal | Page 1759
MRI Brain Tumor Segmentation and Classification based on
Multi-level PSVM Classifier
Apurva Y N
Mrs. Nanda.S
Master in Technology
Assistant Professor
Biomedical Signal Processing and Instrumentation Department of Instrumentation
Sri Jayachamarajendra College of Engineering Sri Jayachamarajendra College of Engineering
Mysore, Karnataka, India
Mysore, Karnataka, India
[email protected]
nanda [email protected]
---***---Abstract -
Medical image processing is widely used in thediagnosis of diseases such as brain tumor, cancer, diabetes etc. Brain tumors are abnormal and uncontrolled proliferations of cells where, its detection plays a major role. Image segmentation is a vital role in medical image processing, where clustering technique is widely used in medical application particularly for brain tumor detection in Magnetic Resonance Imaging (MRI), which produces better results with high resolution of the image. This work focuses on the detection and classification of the types of tumors namely, gliomas, meningiomas, pituitary adenomas and nerve sheath from MRI brain image. The training and test data set of MRI brain tumor image is preprocessed and an adaptive K-means clustering is used for segmentation. After the segmentation process, the Gray Level Co-occurrence Matrix and Gabor wavelet are utilized for feature extraction. The Principle Component Analysis (PCA) method is used for the feature selection to improve the classifier accuracy. An effective Multi-level Proximal Support Vector Machines (PSVM) classifier is used to automatically detect the types of tumors from MRI brain image. The present method is faster and computationally more efficient than the existing method SVM and is evaluated in terms of
accuracy. Thus, this approach is a more robust scheme under noisy or bad intensity normalization conditions which produces better results using high resolution images.
Key Words: MRI, Image segmentation, Feature
extraction, Principle Component Analysis, Multi-level Support Vector Machines
1. INTRODUCTION
The Magnetic Resonance Imaging (MRI) is a widely used medical imaging technique [1] which provides detailed information of the internal tissue constitutions of the image. The fuzzy c-means [2] for detection of range and shape of tumor in brain MR Images. The patient's stage is determined by this process, whether it can be cured with medicine or not. The hybrid technique [3] for the classification of MRI images consists of three stages, namely, feature extraction, dimensionality reduction, and classification.
© 2016, IRJET | Impact Factor value: 4.45 | ISO 9001:2008 Certified Journal | Page 1760
experience or expert knowledge of human, it utilizes moretime for tiring practice which significantly reduces the computational efficiency. On the other side, the automatic segmentation highly utilizes the histogram based which is fully based on the intensity of pixels. The detection of brain tumor & classification of tumor stages are performed by using testing & training the database [5]. Image enhancement is basically improving the digital image quality. Histogram equalization [6] is the technique by which the dynamic range of the histogram of an image is increased. The process for partitioning an N-dimensional population into k sets on the basis of a sample is called K-means [7]. The K-K-means procedure is easily programmed and is computationally economical, so that it is feasible to process very large samples.
From the above literature survey, it is clear that there is a scope for the improvement of accuracy of the classification rate. In the present work, adaptive K-means clustering is used for segmentation and for feature extraction Gray Level Co-occurrence Matrix (GLCM) and Gabor wavelet are used to detect the types of tumors namely, gliomas, meningiomas, pituitary adenomas and nerve sheath in the MRI brain images. Thus, Multi-level Proximal Support Vector Machine (PSVM) classifier is used in order to obtain high accuracy rate.
2. AN AUTOMATED IMAGE SEGMENTATION
AND CLASSIFICATION
In the present work, adaptive K-means clustering is used for segmentation. After the segmentation process, the Gray Level Co-occurrence Matrix and Gabor wavelet are utilized for feature extraction which avoids the formation of misclustered regions. The Principle Component Analysis (PCA) method is used for the feature selection to improve the classifier accuracy. An effective Multi-level Proximal
Support Vector Machine (PSVM) classifier is used to automatically detect the types of tumors namely, gliomas, meningiomas, pituitary adenomas and nerve sheath from MRI brain image. Fig-1 shows the block diagram of the architecture.
Fig- 1. Block diagram of the architecture
2.1 Image preprocessing
Preprocessing mainly involves those operations that are normally necessarily prior to the main goal analysis and extraction of the desired information and normally geometric corrections of the original actual image. These improvements include correcting the data for irregularities and unwanted atmospheric noise, removal of non-brain element image and converting the data so they correctly reflected in the original image. As soon as MR image has been acquired, a preprocessing is performed to remove noise and clean-up the image background.
2.1.1 Median filter
© 2016, IRJET | Impact Factor value: 4.45 | ISO 9001:2008 Certified Journal | Page 1761
corresponding input pixels. However with medianfiltering, the value of an output pixel is determined by the median of the neighborhood pixels, rather than the mean. The median is much less sensitive than the mean to extreme values.
Median filtering is used to replace the value of the center pixel with the median of the intensity values in the neighborhood of that pixel. Median filters are particularly effective in the presence of blur and low quality image so that the noise is eliminated and clear MRI images are obtained.
The effect of the image noise reduction may estimated by the subjective visual effect or the objective estimation method. The peak signal to noise ratio (PSNR) and the signal to noise ratio (SNR) are the performance estimation standards. Suppose an original image is f(i, j) and its size is M×N, the processed image is ( ), and it is M×N, where, i=1,2,….,M and j=1,2,….,N, then, we have:
MSE = ∑ ∑ ( ( ) ( ))2 (1)
PSNR = 101g(
)(dB) (2)
SUM = ∑ ∑ ( ∑ ∑ ( )
( ) ( )) (3)
SNR = 101g(SUM)(dB) (4)
Where, k – 1. Here, k denotes the number of a pixel binary bit. If k =8, then 255. Thus, the noise is eliminated and the image quality is improved with high accuracy and less error rate.
2.2 An Automated MRI Brain Image Segmentation
Segmentation is an image processing operation which aims to partition an image into homogeneous regions composed of pixels with the same characteristics according to predefined criteria. In brain MRI analysis, image segmentation is commonly used for measuring and visualizing the brain’s anatomical structures, for analyzing brain changes, for delineating pathological regions, and for surgical planning and image-guided interventions.
Clustering techniques executes as a main role in image segmentation field. The results of the segmentation are used to aid border detection and object recognition. K-means clustering generates a specific number of disjoint, flat (non-hierarchical) clusters. The general reason for selecting K-means algorithm is popularity, flexibility, applicability, handling high dimensionality. It is simplest and work on large database.
2.3 Feature Extraction
Feature extraction refers to various quantitative measurements of medical images typically used for decision making. Extraction of the optimal features of brain tumor from MRI image is obtained by GLCM (Gray Level Co-occurrence Matrix) and Gabor wavelet. Here, the features extracted from GLCM are 4×4 and from Gabor wavelet is 256×129. Thus, the features are extracted and compared with other metric and efficient results are obtained.
2.3.1 GLCM
© 2016, IRJET | Impact Factor value: 4.45 | ISO 9001:2008 Certified Journal | Page 1762
relationship”. GLCM of an image is computed using adisplacement vector d, defined by its radius δ and orientation θ. Fig-2 shows the geometry for measurement of gray level co-occurrence matrix for 4 distances d and 4 angles θ.
Fig- 2. Geometry for measurement of gray level co-occurrence matrix
In order to obtain a statistically reliable estimate of the joint probability distribution, the matrix must contain a reasonably large average occupancy level. Simple relationships exist among certain pairs of the estimated probability distributions P(d, θ). Let Pt(d ,θ) denote the transpose of the matrix P(d, θ). Then,P(d, 0°) = Pt(d, 180°), P(d, 45°) = Pt(d, 225°), P(d, 90°) = Pt(d, 270°) and P(d, 135°) = Pt(d, 315°).
The co-occurrence matrix for all angles 0, 45, 90 and 135 are calculated. For a given distance d we usually have four angular gray level co-occurrence matrices. A number of scalar texture measures T(d, θ) that may be extracted from the matrices. To avoid dependency of direction, an average (isotropic) matrix out of four matrices, θ = 0°, 45°, 90°, 135° are calculated. Haralick et al. 1973 [5] have suggested to use the angular mean, MT(d), and range, RT(d), of each of the proposed textural measures, T, as a set of features used as input to a classifier:
MT(d) =
θ∑ ( θ θ) (5)
RT(d) = θ [T(d, θ)] - θ ( θ) (6)
Where, the summation is over the angular measurements and θ represents the number of such measurements. Similarly, an angular independent texture variance may be defined as:
(d) =
θ∑ ( θ θ) MT(d)]
2 (7)
The features extracted gives the property of the texture, and are stored in knowledge base and further compared with the features of unknown sample image for classification. Thus, texture features are used to distinguish between the types of brain tumors. The texture features are contrast, homogeneity, entropy and variance.
Within the large number of texture features available, some of the features are strongly correlated with each other. Thus, maximum probability, mean, range and variance features are obtained using this technique.
2.3.2 Gabor wavelet
In image processing, a Gabor filter, named after Dennis Gabor, is a linear filter used for edge detection. Gabor features are based on Gabor filter responses for a given input image [10]. A set of Gabor filters with different frequencies and orientations may be helpful for extracting useful features from an image.In the discrete domain, two-dimensional Gabor filters are given by:
(8)
© 2016, IRJET | Impact Factor value: 4.45 | ISO 9001:2008 Certified Journal | Page 1763
Where, B and C are normalizing factors to be determined. fdefines the frequency being looked for in the texture. By varying ɵ, we can look for texture oriented in a particular direction. By varying σ, we change the support of the basis or the size of the image region being analyzed. The responses over the image are calculated for a set of filters, tuned to various frequencies. The real values obtained are considered and the imaginary values are discarded. Thus, the combined features of GLCM [11] and Gabor wavelet are calculated to differentiate the various types of MRI brain tumors.
2.4 Feature Selection
A feature selection procedure is applied in order to select a subset or a linear combination of the features available using a set of training image regions to establish the set of features. The feature selection method discussed on three steps when selecting image which are: screening, ranking and selecting. The feature selection screens, ranks, and selects the predictors that are useful. The feature selection is done using Principle Component Analysis (PCA) [12].
Principal Component Analysis (PCA) is a statistical procedure that uses an orthogonal transformation to convert a set of observations of possibly correlated variables into a set of values of linearly uncorrelated variables called principal components. Thus, we can identify the image from database which is similar to the features of test image. The extracted feature set is applied to PCA to reduce the feature set which is extracted from images. Here, the features extracted after using PCA is 56×56. The reduced features are submitted to a proximal support vector machine for training and testing. Therefore, thismethod will decrease the computation time and complexity.
2.5 An Automated MRI Brain Image Classification
for Tumor Detection
The classification process is divided into two parts i.e. the training and the testing part. Firstly, in the training part known data are given to the classifier for training. Secondly, in the testing part, unknown data are given to the classifier and the classification is performed after training part. The accuracy rate and error rate of the classification depends on the efficiency of the training.
Selected features of training images are stored. Later, the testing image is given as an input and the features are extracted. The features which are extracted from the test image are compared with the features of training images. The Multi-level PSVM classifier [13] is thus used to classify the testing image to the stored features of trained images into different types of brain tumors, namely; gliomas, meningiomas, pituitary adenomas and nerve sheath.
3. EXPERIMENTAL RESULTS AND DISCUSSIONS
The primary need for the implementation of this work is to help radiologist to diagnose the types of MRI brain tumors with ease. The database comprises of 24 MRI brain tumor images of 4 different types of tumors namely, gliomas, meningiomas, pituitary adenomas and nerve sheath, where, each types consists of 5 images as training database. The testing database consists of 4 images.
The following are the experimental results obtained by the CAD system.
© 2016, IRJET | Impact Factor value: 4.45 | ISO 9001:2008 Certified Journal | Page 1764
Fig- 3. Query and preprocessed imageIn case of tumor detection phase, segmentation using K-means clustering produces an effective result than the manual segmentation. The segmentation results for k = 1, 2 and 3 respectively are shown in Fig-4.
Fig- 4. Segmented images
GLCM and Gabor wavelet are utilized for feature extraction with no loss in resolution. Here, the features extracted from GLCM are 4×4 and from Gabor wavelet is 256×129. The features selected after using PCA is 56×56.
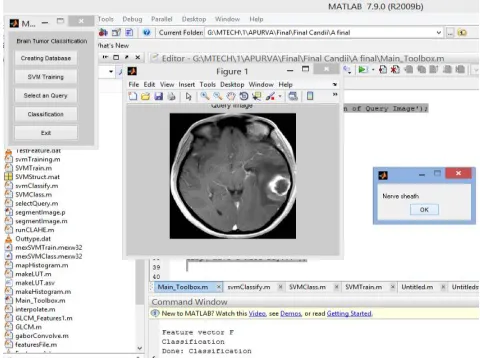
The Multi-level PSVM is used to classify the test image into types of brain tumors, namely, gliomas, meningiomas, pituitary adenomas and nerve sheath based on features. Screenshorts of the detection of different types of tumors are shown in Fig- 5, 6, 7 and 8.
© 2016, IRJET | Impact Factor value: 4.45 | ISO 9001:2008 Certified Journal | Page 1765
Fig- 6. Classification result of meningioma [image:7.612.36.276.339.518.2]Fig- 7. Classification result of pituitary adenoma
Fig- 8. Classification result of nerve sheath
The efficiency or accuracy of the classifiers is evaluated based on the following performance parameters.
True Positive (Sensitivity), TP = No. of true positive / (No. of false negative + No. of true positive)
False Negative, FN = No. of false negative / (No. of true positive + No. of false negative)
True Negative (Specificity), TN = No. of true negative / (No. of true positive + No. true negative)
False Positive, FP = No. of false positive / (No. true negative + No. of false positive)
ACCURACY = (No. of true positive + No. of true negative) / No. of total responses
A Receiver Operating Characteristic (ROC), or ROC curve, is a graphical plot that illustrates the performance of a binary classifier system as its discrimination threshold is varied. The curve is created by plotting the true positive rate (TPR) against the false positive rate (FPR) at various threshold settings is shown in Fig- 9.
Fig- 9. ROC comparison
The ROC rate of SVM and PSVM are calculated using true positive rate and false positive rate. Table -1 shows the performance of the SVM and PSVM classifiers.
[image:7.612.333.568.367.505.2]© 2016, IRJET | Impact Factor value: 4.45 | ISO 9001:2008 Certified Journal | Page 1766
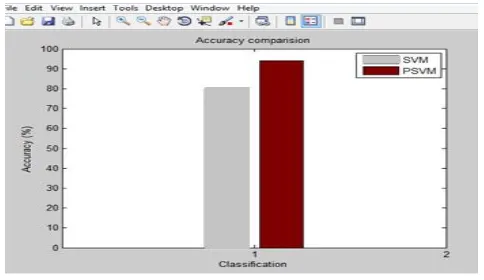
The Fig- 10 shows the accuracy comparison result of SVM [image:8.612.59.279.102.249.2]and PSVM, the percentage value of accuracy for SVM system is 80 and for PSVM it is 95.
Fig- 10. Accuracy comparison
Thus, the PSVM works better than SVM with the high accuracy of 95%. The values are tabulated in Table -2.
Table -2: Comparison of accuracies
From the above results, it is clear that PSVM is better compared to SVM in terms of accuracy for the detection and classification of brain tumors in MRI images.
4. CONCLUSION AND FUTURE SCOPE
This work presents an effective method to detect and classify brain tumors in MRI images. To differentiate various types of tumors, the combined features are calculated using GLCM and Gabor wavelet. Because of large feature set, PCA is used for feature selection which helps in dimensionality reduction. The selected features are given to both SVM and PSVM classifiers and the performances are compared. The experimental result shows that PSVM is more efficient with the accuracy rate of 95% compared to SVM with the accuracy rate of 80% in the detection and classification of brain tumors in MRI images.
In future the system can be improved to support other types of tumors. To achieve this, more number of features can be added to improve the tumor detection and the classification result.
REFERENCES
1) 1) Jay and Kaushal, “A Study of Segmentation methods for Detection of Tumor in Brain MRI”, Vol. 4, (2014)
2) 2) Alan Jose, “Brain Tumor Segmentation using K-Means Clustering”, IJCSEIT, Vol. 2, Issue 3, March 14
3) 3) El-Sayed, “Hybrid Intelligent techniques for MRI brain Images classification”, D S P 20 (2010) 433–441
4) 4) Sahil J, “Brain Tumor Detection by various Image Segmentation Techniques”, IJCSEIT, Vol. 4, March 2015
5) 5) Pranita Balaji Kanade, “Brain Tumor Detection using MRI images”, IJCSEIT, Vol. 3, Issue 2, February 2015
6) 6) Sapana and Vijaya, “Use of Histogram Equalization in Image Processing”, IJCSEIT, Vol.1, Issue 2, April, 2011
7) 7) J. Macqueen and Los Angeles, “Some methods for Classification and Analysis of Multivariate observations”
[image:8.612.42.284.323.463.2]© 2016, IRJET | Impact Factor value: 4.45 | ISO 9001:2008 Certified Journal | Page 1767
9) Bino Sebastian V, “GLCM: Generalization and some newfeatures”, IJCSEIT, Vol.2, No.2, April 2012
10) J. Ilonen, H. Kalviainen, “Efficient computation of Gabor features”, Lappeenranta University of Technology
11) Fritz Albregtsen, “Statistical texture measures computed from GLCM”, University of Oslo, Nov 5, 2008
12) Glenn M. Fung and O. L. Mangasarian, “Multicategory PSVM Classifiers”, University of California, 2005