© 2016, IRJET ISO 9001:2008 Certified Journal Page 1921
COMPARATIVE ANALYSIS OF DIFFERENT MPPT TECHNIQUES FOR
SOLAR PV SYSTEM
Pushprajsinh Thakor
1, Aakashkumar Chavada
2, Bhargviben Patel
31
PG Scholar, Dept. Electrical Engineering, TITS Modasa, Gujarat, India
2PG Scholar, Dept. Electrical Engineering, TITS Modasa, Gujarat, India
3PG Scholar, Dept. Electrical Engineering, TITS Modasa, Gujarat, India
---***---Abstract-This paper presents a comparative analysis of
control methods to extract the maximum power and to track the maximum power point (MPP) from photovoltaic (PV) systems under changeable environmental conditions. The PV system consists of a solar module and a DC/DC converter, in this case a boost converter, connected to a load. The maximum power point tracking (MPPT) algorithms compared are the perturb and observe (P&O) method, the Ripple Correlation control (RCC) and fuzzy logic control (FLC) technique .The parameters considered for the comparison are the efficiency of the MPPT algorithm taking into account the extracted power from the PV system, steady and dynamic response of the system under changeable conditions such as the temperature and the irradiance and the signals ripple. The methods have been compared and the algorithm with the best results has been implemented in an MATLAB simulation platform.
Keyword- PV System, Boost converter, MPPT methods
I INTRODUCTION
The energy demand and the number of distributed generation systems are growing all over the world last years. For that reason, it is essential the use of renewable energy systems in addition to the conventional ones, [1]. Among renewable energy systems, solar energy is one of the most wide spread due to the fact that it is clean, inexhaustible and free.
The solar cell turns the solar light into electricity. There are two types of PV systems, the isolated systems and the grid connected systems. The PV system connected to the electrical network consists of solar cells connected together in series or parallel to get a PV module, obtaining output voltage or output current greater than a unique solar cell, a DC/DC converter to regulate the PV module output voltage in order to achieve the maximum power point and a DC/AC converter to transfer energy to the AC side[2].
There are various topologies of DC/DC converters, In this work, a boost converter is designed to regulate the solar module output voltage depending on the requirements,
controlling the switch of the DC/DC converter to obtain the desired input voltage value to track the MPP.
II SYSTEM CONFIGURATION
The energy supplied by the PV panel depends on the environmental conditions, such as the irradiance and the temperature. Besides, there is only one MPP for each value of solar radiation and temperature and, in that point, the maximum power is extracted from the solar cells, If the PV system works at the MPP, the efficiency of the system is greater.
Fig: 1 Basic block diagram of MPPT in PV system
© 2016, IRJET ISO 9001:2008 Certified Journal Page 1922 The paper is organized as follows. Section III explains the
PV system model, including the PV module and the DC/DC converter. Section IV describes the different MPPT techniques compared in this work. The simulation and results are developed in Section V. Finally, Section VI presents the main conclusions.
III. PV SYSTEM
This section describes the model of the photovoltaic system: the PV modules and the DC/DC converter, connected to a DC load, to regulate the voltage that gives the MPP.
A. Solar cells
[image:2.595.312.556.269.376.2]A solar cell converts the solar light to electricity by means of the photovoltaic effect. It is a p-n junction made with semiconductor material. The equivalent circuit model of the solar cell consists of electronic devices such as a current source, a diode and two resistors, one in series and one in parallel, as it is shown in Fig. 2.
Fig: 2 Basic solar cell circuit
The equation that describes the I-V characteristic curve of a solar cell is :
I = IPh – IO [Exp ((V+ I RS)/ V T) − 1]-[(V+I RS)/ RP]
Where, Iph = The PV module saturation current (A) I = Output Current of a PV modules (A) I0 = Reverse Saturation Current V = Output Voltage of a PV modules (V) Rs = Series Resistance of PV modules Rp = Parallel Resistance
VT = Thermal Voltage
Being V the voltage of the solar cell in V, Iph the light generated by the photons and Io is the saturation current, both in A. In order to adjust the model with the losses, two
resistors have been added, Rs represents the ohmic losses and Rsh models the current leak in a parallel way, both measured in Ω.
The voltage generated by a solar cell is about 1 V and it is essential to connect cells in series and in parallel to create PV modules in order to supply the desired power.
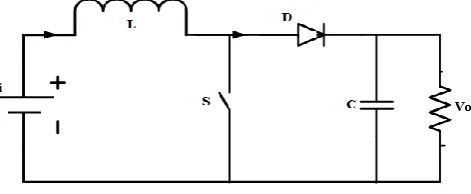
B. DC/DC Boost Converter
[image:2.595.38.286.382.520.2]A topology of the DC boost converter is shown in Fig. 3. It is modelled in two modes of operation, which are given by the operation state of the switch. The output variables are inductor current Il and the capacitor voltage Vc [6].
Fig: 3 Basic circuit of Boost Converter
When the switch is on (closed), the inductor stores the energy from PV array and the load is supplied only by the capacitor (Fig. 4) [5].
Fig : 4 Operation of Boost Converter (switch on)
When the switch if off (open), the inductor current flows to the load and the stored energy of the inductor is transferred to the capacitor and the load (Fig. 5) [5].
Fig : 5 Operation of Boost Converter (switch off) IV. MPPT ALGORITHMS
[image:2.595.311.550.437.531.2] [image:2.595.319.555.609.706.2]© 2016, IRJET ISO 9001:2008 Certified Journal Page 1923 environmental conditions in order to increase the efficiency
of the PV system. There are plenty of techniques for the tracking, the most used method, the P&O, is compared with the RCC and FLC.
A. Perturb and Observe (P&O)
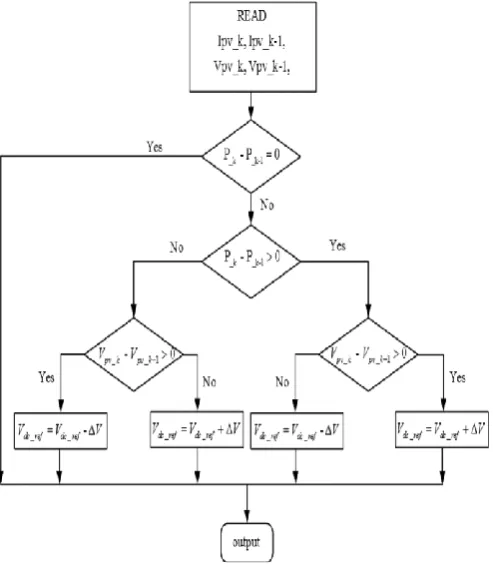
The advantage of this method is that it is simple and easy to implement and it is the most used algorithm. The P&O is based on the variation of the PV module output voltage, controlling the duty cycle of the DC/DC converter, and comparing the power supplied by the solar cells in the current instant of time with the power obtained in the previous instant of time, [9]. If the power of the current cycle is greater than the previous one, the voltage must be modified in the same way, increasing or decreasing it, whereas if the power is lower than the previous power, then the voltage must be varied in the opposite way, increasing or decreasing it as well. When the MPP is reached, the control algorithm oscillates around the maximum power. The flowchart of the P&O is shown in Fig. 6.
[image:3.595.315.557.210.332.2]
Fig : 6 Flow Chart of Perturb and Observe
The disadvantage of this technique is energy losses due to the oscillation around the MPP even when the maximum power is achieved, reducing the efficiency of the PV system.
B. Ripple correlation control (RCC)
The switching action of power converter imposes
voltage and current ripple on the PV array when connected to the Power converter, this results PV array power to ripple. RCC makes use of ripple to perform MPPT [10].
[image:3.595.37.284.357.641.2]RCC correlates the time derivative of time varying PV array power P with the time derivative of the time varying PV array current I or voltage V to derive the power gradient to zero, thus reaching MPP.
Fig : 7 Relation between Power and Vmpp or Impp
Operating point is above MPP. Combining the observations PV or PI are positive to left of MPP, Negative to right of MPP and Zero at MPP. When power converter is a boost converter results in increasing the duty ratio increases the inductor current which is same as PV array current but decreasing PV array voltage.
C. Fuzzy Logic Control (FLC)
MPPT using Fuzzy Logic Control gains several advantages of better performance, robust and simple design. In addition, this technique does not require the knowledge of the exact model of system. The main parts of FLC, fuzzification, rule-base, inference and defuzzification , are shown in Fig. 8.
Fig : 8 Four basic elements in fuzzy logic controller
[image:3.595.311.555.550.684.2]© 2016, IRJET ISO 9001:2008 Certified Journal Page 1924 PV current (ΔIpv), whereas the output of FLC is the
magnitude of the change of boost converter current reference (ΔIref).
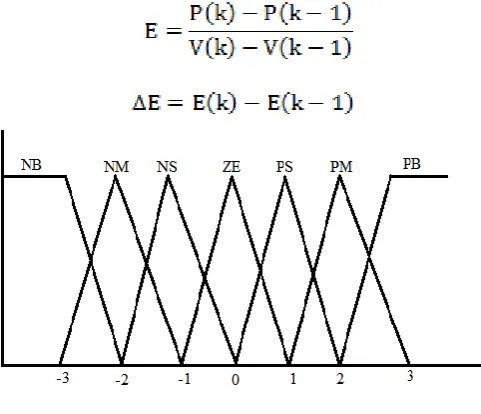
In the proposed design, the universe of discourse for the first input variable (ΔPpv) is assigned in terms of several linguistic variables by using seven fuzzy subsets, which are denoted by NB (negative big), NM (negative medium), NS (negative small), Z (zero), PS (positive small),PM (positive medium) and PB (positive big). The membership functions for the variable are shown in Fig. 9.
[image:4.595.37.278.263.470.2]The error equations for ΔPpv and ΔIpv are given as follows:
Fig : 9 Membership functions
V. SIMULATION RESULTS
A. Perturb and Observe (P&O)
Fig : 10 Output current/voltage/power for P&O Controller B. Ripple correlation control (RCC)
Fig : 11 Output current/voltage/power with RCC Controller
C. Fuzzy Logic Control (FLC)
Fig : 12 Output current/voltage/power with FL Controller D. Output Power Comparison of MPPT Techniques
Fig : 13 Comparison for Output Power of P&O, FLC and RCC Controllers
© 2016, IRJET ISO 9001:2008 Certified Journal Page 1925 In this work, three MPPT algorithms have been simulated
to be compared, the P&O algorithm, the RCC control and the fuzzy logic (FLC) controller.
All the methods have rapidly tracking under changeable environmental conditions. The P&O has two disadvantages, the signals ripple involves small oscillation about the MPP voltage leading to power losses and it can reach a local maximum instead of a global maximum in some cases. The other two methods avoid local maximum and have smooth transient response and gives the more output power compare than P&O. Ripple correlation control (RCC) gives slightly better result than P&O. Regarding the efficiency of the MPPT, the fuzzy logic control (FLC) achieves better result compare than other methods.
VII. APPENDICES
A. Parameters for Solar Photovoltaic System
Number of cells 36
Ns and Np 1
Open circuit voltage 19.1 volts
Short circuit current 2.5 Amp.
Series Resistance 0.18 Ohms
Shunt Resistance 360.002 Ohms
Ideality factor 1.36
Temperature 25°C
Irradiance 1000 W/m2
B. Parameters for DC-DC Boost converter
R 10 Ohms
L 0.005 H
C 12000 μF
fsh 10 kHz
D 0.86
C. Comparison an output results
Output P&O RCC FLC
Current 2.476(A) 2.451(A) 2.272(A)
Voltage 9.197(V) 12.3(V) 15.34(V)
Power 22.77(W) 30.15(W) 34.75(W)
ACKNOWLEDGMENT
Author Pushprajsinh Thakor wishes to thank the Department of Electrical Engineering, Tatva Institute of Technological Studies, Modasa for the working of Project under the guidance of Electrical faculty.
REFERENCES
[1] D. P. Hohm and M. E. Ropp, “Comparative Study of Maximum Power Point Tracking Algorithms,” Prog. Photovolt: Res. Appl., vol. 11, Nov. 2002, pp.47-62, doi: 10.1002/pip.459.
[2] A. A. J. A. Nabulsi, “Efficiency Optimization of a Standalone Solar Energy System Using Fuzzy Based MPPT,” Master`s Thesis, Colg. Eng., American Univ., Sharjah, UAE, 2012.
[3] A. K. Abdelsalam, A. M. Massoud, S. Ahmed, and P. N. Enjeti, “High-Performance Adaptive Perturb and Observe MPPT Technique for Photovoltaic-Based Microgrids,” IEEE Trans. Power Electron., vol. 26, no. 4, Apr. 2011, pp. 1010– 1021, doi: 10.1109/TPEL.2011.2106221
[4] N. Femia, G. Petrone, G. Spagnuolo, and M. Vitelli, “Optimization of Perturb and Observe Maximum Power Point Tracking Method,” IEEE Trans. Power Electron.., vol.
20, no. 4, Jul. 2005, pp. 963–973, doi:
10.1109/TPEL.2005.850975.
[5] G. Marcelo, J. Gazoli and E. Filho, “Comprehensive approach to modeling and simulation of photovoltaic arrays”, IEEE Transactions on Power Electronics, vol. 24, no. 5, May 2009, pp. 1198-1208
© 2016, IRJET ISO 9001:2008 Certified Journal Page 1926 [7] U.R. Yaragatti, A. N. Rajkiran, B. C. Shreesha, “A novel
method of fuzzy controlled maximum power point tracking in photovoltaic systems”, IEEE ICIT, Dec. 2005, pp. 1421-1426.
[8] Jenifer. A, Newlin Nishia.R, Rohini.G, Jamuna, “Development of Matlab- Simulink Model for Photovoltaic Arrays” in proceeding of ICCEET 2012.
[9] L. Piegari, R. Rizzo, "Adaptive perturb and observe algorithm for photovoltaic maximum power point tracking," Renewable Power Generation, IET, vol. 4, no. 4, pp. 317-328, July 2010.
[10] A. K. Sinha, Venkataiah Mekala, S.K.Samantaray “Design and Testing of PV Maximum Power Tracking System with MATLAB
Simulation” in IEEE proceedings of TENCON, pp. 466 -473, 2010.
[11] T. Salmi, M. Bouzguenda, A. Gastli, and A. Masmoudi, “Matlab/simulink based modeling of photovoltaic cell,” International Journal of Renewable Energy Research (IJRER), vol. 2, no. 2, pp. 213–218, 2012.
[12] G. Walker et al., “Evaluating mppt converter topologies using a matlab pv model,” Journal of Electrical & Electronics Engineering, Australia, vol. 21, no. 1, pp. 49–56, 2001.
[13] M. A. G. De Brito, L. Galotto, L. P. Sampaio, G de Azevedo e Melo, and C. A. Canesin, “Evaluation of the main mppt techniques for photovoltaic applications,” Industrial Electronics, IEEE Transactions on, vol. 60, no. 3, pp.1156-1167
[14] H.-L. Tsai, C.-S. Tu, and Y.-J. Su, “Development of generalized pho- tovoltaic model using matlab/simulink,” in Proceedings of the world congress on Engineering and computer science, vol. 2008 cite seer, 2008, pp. 1-6.
[15] H. Patel and V. Agarwal, “Matlab-based modeling to study the effects of partial shading on pv array characteristics,” Energy Conversion, IEEE Transactions on, vol. 23, no. 1, pp. 302–310, 2008.
[16] S. Bal, A. Anurag, and B. C. Babu, “Comparative analysis of mathematical modeling of photo-voltaic (PV) array,” in Proc. IEEE Annu. India Conf., Dec. 7–9, 2012, pp. 269–274.
[17] M. Suthar, G. K. Singh, and R. P. Saini, “Comparison of mathematical models of photo-voltaic (PV) module and effect of various parameters on its performance,” in Proc. Int. Conf. Energy Efficient Technol. Sustainability, Apr. 10–12, 2013, pp. 1354–1359.
[18] M. A. de Blas, J. L. Torres, E. Prieto, and A. Garcıa, “Selecting a suitable model for characterizing photovoltaic
devices,” Renewable Energy, vol. 25, no. 3, pp. 371–380, Mar. 2002.
[19] M. G. Villalva, J. R. Gazoli, and E. R. Filho, “Comprehensive approach to modeling and simulation of photovoltaic arrays,” IEEE Trans. Power Electron., vol. 24, no. 5, pp. 1198–1208, May 2009.