Copyright © 1998, American Society for Microbiology. All Rights Reserved.
Assessment of Hepatitis C Virus Sequence Complexity
by Electrophoretic Mobilities of Both
Single-and Double-StrSingle-anded DNAs
YU-MING WANG,
1STUART C. RAY,
1OLIVER LAEYENDECKER,
1JOHN R. TICEHURST,
2,3ANDDAVID L. THOMAS
1*
Departments of Medicine
1and Pathology,
2Johns Hopkins University School of Medicine, Baltimore, and
Center for Devices and Radiological Health, U.S. Food and Drug Administration, Rockville,
3Maryland
Received 4 May 1998/Returned for modification 15 June 1998/Accepted 16 July 1998
To assess genetic variation in hepatitis C virus (HCV) sequences accurately, we optimized a method for
identifying distinct viral clones without determining the nucleotide sequence of each clone. Twelve serum
samples were obtained from seven individuals soon after they acquired HCV during a prospective study, and
a 452-bp fragment from the E2 region was amplified by reverse transcriptase PCR and cloned. Thirty-three
cloned cDNAs representing each specimen were assessed by a method that combined heteroduplex analysis
(HDA) and a single-stranded conformational polymorphism (SSCP) method to determine the number of
clonotypes (electrophoretically indistinguishable cloned cDNAs) as a measure of genetic complexity (this
combined method is referred to herein as the HDA
1
SSCP method). We calculated Shannon entropy,
incor-porating the number and distribution of clonotypes into a single quantifier of complexity. These measures were
evaluated for their correlation with nucleotide sequence diversity. Blinded analysis revealed that the sensitivity
(ability to detect variants) and specificity (avoidance of false detection) of the HDA
1
SSCP method were very
high. The genetic distance (mean
6
standard deviation) between indistinguishable cloned cDNAs
(intraclono-type diversity) was 0.6%
6
0.9%, and 98.7% of cDNAs differed by <2%, while the mean distance between cloned
cDNAs with different patterns was 4.0%
6
3.2%. The sensitivity of the HDA
1
SSCP method compared favorably
with either HDA or the SSCP method alone, which resulted in intraclonotype diversities of 1.6%
6
1.8% and
3.5%
6
3.4%, respectively. The number of clonotypes correlated strongly with genetic diversity (R
2, 0.93), but
this correlation fell off sharply when fewer clones were assessed. This HDA
1
SSCP method accurately reflected
nucleotide sequence diversity among a large number of viral cDNA clones, which should enhance analyses to
determine the effects of viral diversity on HCV-associated disease. If sequence diversity becomes recognized as
an important parameter for staging or monitoring of HCV infection, this method should be practical enough
for use in laboratories that perform nucleic acid testing.
Genetic variation of certain RNA viruses may explain their
capability to cause persistent infections and evade traditional
treatment and prevention efforts. Hepatitis C virus (HCV)
frequently establishes chronic infection and has considerable
sequence variation, especially in putative envelope proteins E1
and E2, for which
,
60% amino acid identity has been
de-scribed worldwide (3, 15, 17, 18, 22, 37, 46).
Genetic variation may also refer to differences among the
swarm of viral variants within a person, often called a
quasi-species (10, 11). The variants in an HCV quasiquasi-species generally
have 94 to 99% nucleotide identity (2, 25, 35). Within a single
specimen, such variation can be characterized in terms of
di-versity or complexity. Didi-versity is the mean genetic distance
calculated for all pairs of sequences (26), where genetic
dis-tance is directly proportional to the number of nucleotide
differences between two variants. Complexity refers to the
pop-ulation distribution of variants and has been calculated from
sequence data (26) but has also been estimated more
practi-cally on the basis of either the number of distinct gel bands
resulting from single-stranded conformational polymorphism
(SSCP) analysis (24) or the number of indistinguishable cDNA
clones (clonotypes) recognized by gel shift analysis (32).
Nucleic acid sequencing of cloned cDNAs remains the “gold
standard” for the assessment of viral variation but is too
cum-bersome to be applied to large, population-based studies.
Elec-trophoretic analysis of SSCP has been more expedient, but its
sensitivity (ability to identify distinct clones) is limited and it
does not provide an estimate of genetic distance (5, 6, 23).
Heteroduplex analysis (HDA) is also convenient and provides
information on both genetic complexity and distance (4, 8, 9,
13, 14, 21, 27, 32, 47). However, HDA alone may not be
sufficiently sensitive (6). We sought to develop a method
com-bining HDA and SSCP analysis (referred to herein as the
HDA
1
SSCP method) that could assess genetic complexity
with high sensitivity (ability to discriminate between distinct
sequences) and specificity (chance that clones detected as
dis-tinct truly represent disdis-tinct sequences) and that could provide
accurate estimates of genetic diversity in a large prospective
investigation by sampling a sufficiently large number of cloned
cDNAs. In addition, we tested the value of estimating
quasi-species complexity by calculating the Shannon entropy of the
clonotype distribution, thus incorporating information about
both the number of clonotypes and their respective
propor-tions.
MATERIALS AND METHODS
Study subjects.As part of a prospective study of acute HCV infection, serial serum samples were obtained from individuals in the ALIVE cohort of injection drug users in Baltimore, Md. (45). These samples were tested for antibodies to HCV by using the second-generation HCV 2.0 enzyme immunoassay (Ortho
* Corresponding author. Mailing address: Division of Infectious
Diseases, 720 Rutland Ave., Ross 1159, Baltimore, MD 21205. Phone:
(410) 955-0349. Fax: (410) 955-7889. E-mail: dthomas@welchlink
.welch.jhu.edu.
2982
on May 15, 2020 by guest
http://jcm.asm.org/
Diagnostic Systems, Raritan, N.J.) as previously described (45). Individuals were identified as seroconverters when a sample tested positive following at least one negative result. Positive results were supplemented by a recombinant immuno-blot assay (Chiron RIBA HCV 2.0 strip immunoimmuno-blot assay; Chiron Corporation, Emeryville, Calif.) and confirmed by the detection of HCV RNA by a reverse transcriptase PCR (RT-PCR) assay (Amplicor HCV Monitor; Roche Diagnostic Systems, Branchburg, N.J.) as previously described (44). Twelve samples from seven subjects were arbitrarily selected for this investigation, without knowledge of risk factors or disease state (Table 1). Genotyping by analysis of Core-E1 HCV sequence, according to the nomenclature of Simmonds et al. (36), revealed that all subjects were infected with HCV genotype 1a except subject 11469 (sample E), who was infected with genotype 1b (44).
Reverse transcription and nested-PCR amplification.Total RNA was ex-tracted from 100ml of plasma or serum by using 1 ml of Trizol LS Reagent (Life Technologies, Gaithersburg, Md.) at room temperature, followed by chloroform extraction and isopropanol precipitation in the presence of 20mg of glycogen (Boehringer Mannheim, Indianapolis, Ind.). The RNA pellet was washed with 75% (vol/vol) ethanol and then air dried briefly and redissolved in 50ml of diethyl pyrocarbonate-treated water with 10 mM dithiothreitol (Promega, Mad-ison, Wis.) and 5 U of RNasin ribonuclease inhibitor (Promega). After incuba-tion at 65°C for 5 min, 5ml of purified RNA was used to generate cDNA in a 20-ml reaction mixture at 37°C for 1 h with 20 U of Moloney murine leukemia virus RT (Perkin-Elmer, Foster City, Calif.) and first-round PCR reverse primer (see below). The entire 20-ml cDNA synthesis reaction mixture was used for the first-round PCR in a 25-ml reaction mixture containing 0.625 U of Taq polymer-ase (Life Technologies), 1.5 mM MgCl2, 0.2 mM concentrations of deoxynucleo-side triphosphates, and 400mM concentrations of primers. The primers (and nucleotide positions in the HCV-H77 strain [12]) for the first round were 59-G
CCCACTGGGGTGTCCTAGCGGG-39(forward; positions 1380 to 1403) and
59-GTGCAGGGGTAGTGCCAGAGCCT-39(reverse; positions 2191 to 2168).
One microliter of the first-round reaction mixture was added to the second-round PCR, which had the same reagents as in the first second-round except for the
primers. The second-round (nested) primers were 59-TTCCATGGTGGGGAA
CTGGGC-39(forward; positions 1415 to 1436) and 59-GGCTCGGAGTGAAG
CAATAC-39(reverse; positions 1866 to 1846). Reverse transcription and PCR were performed in a Perkin-Elmer Cetus 9600 thermocycler. Each PCR round was 35 cycles of 94°C for 10 s, 65°C for 30 s, and 72°C for 30 s.
Plasmid cloning and amplification of cloned cDNA.PCR products were pu-rified with a QIAQuick Gel Extraction Kit (Qiagen, Chatsworth, Calif.) used according to the manufacturer’s protocol. Within 24 h of synthesis, 20 to 40 ng of PCR products were ligated to 50 ng of the pCR 2.1 vector (TA Cloning kit; Invitrogen, Carlsbad, Calif.), used according to the manufacturer’s protocol, and were used to transform Escherichia coli INVaF9competent cells (Invitrogen). Transformants were grown for approximately 20 h at 37°C on ampicillin plates, and 33 colonies were randomly selected.
Cloned cDNA was amplified from bacterial colonies as follows. Each colony was subcultured in Luria-Bertani medium for 14 h at 37°C. Three microliters of this culture was diluted in 100ml of distilled water, mixed with 10ml of 1 M NaOH, incubated for 1 h at 37°C, and then neutralized with 10ml of 1 M HCl. One microliter of this lysate was added to a 25-ml PCR mixture as described above for the second round. Taq polymerase was inactivated by adding EDTA to a final concentration of 5 mM. The PCR product was purified with a QIAQuick Gel Extraction Kit.
HDA1SSCP method.Gel electrophoresis was carried out with the MDE Heteroduplex Kit (FMC Bioproducts, Rockland, Maine) at a 13concentration according to the manufacturer’s protocol, with the addition of 15% (wt/vol) urea to increase the resolution. Driver and test-cloned cDNA (2.5ml each) were mixed, denatured at 95°C for 3 min, and then immediately plunged into crushed ice. Five microliters of each reaction mixture plus 1ml of Triple Dye loading buffer (FMC Bioproducts) was loaded on an MDE gel (19.0 by 16.0 by 0.1 cm) in a Protein II xi cell (Bio-Rad Laboratories, Hercules, Calif.), followed by electrophoresis at 140 V for 4,500 Vzh (;32 h). Gels were stained in a 1:10,000 dilution of SYBR Green II (FMC Bioproducts) for$30 min and documented with an Eagle Eye II Still Video System (Stratagene, Carlsbad, Calif.) with a SYBR Green Filter (Stratagene).
Selection of subject-specific driver.For each sample, a preliminary HDA1
SSCP gel was performed with 20 cloned cDNAs, 1 of which was also randomly selected for use as a preliminary driver. Inspection of the preliminary gel always yielded a cloned cDNA with a relatively large gel shift as well as an SSCP pattern with four distinct bands that represented a minority of the SSCP patterns among the cloned cDNAs. This process resulted in the selection of a subject-specific driver that optimized resolution of all HDA and SSCP bands, in contrast to results obtained with a suboptimal driver (Fig. 1).
Complexity analysis.For each of the three electrophoretic methods (HDA, SSCP analysis, and the HDA1SSCP method), a clonotype was defined as a group of indistinguishable cloned cDNAs based on inspection of the gel for the number and mobility of bands. The number of clonotypes and the number of clones comprising each clonotype were recorded.
To quantify complexity, the Shannon entropy (H) calculation (34, 40) was applied. Shannon entropy incorporates both the number of clonotypes and the number of cloned cDNAs in each clonotype. It is defined as H5 2S(from i5
1 to N) P(i) Ln[P(i)], where N is the total number of clonotypes and P(i) is the number of clones represented in clonotype i. Because each sample in our study could have up to 33 clonotypes, which would yield a maximum value of Ln(33) for H, a normalized value of H, denoted H9, was defined as H/Ln(33). This resulted in a range of possible values for H9from 0 to 1, representing 1 to 33 distinct clonotypes, respectively.
Nucleotide sequencing.Sequences were unidirectionally determined from the M13 primer binding site of plasmid clones by using a PRISM automated se-quencer (version 2.1.1; Applied Biosystems, Inc., Foster City, Calif.). Except as noted, sequences were obtained from up to three representatives of each clono-type. Sequences were assembled by using the ESEE3s program (E. Cabot, Mad-ison, Wis.), and primer sequences were removed.
Calculation of diversity.For a pair of sequences, distance was calculated as the Hamming distance, or number of nucleotide differences, per 100 bases. Intra-clonotype diversity (di) was defined as the mean of pairwise distance values for
cloned cDNAs from clonotype i. Interclonotype diversity (dij) was defined as the
mean of distance values for cloned cDNAs from clonotypes i and j, where iÞj.
The weighted diversity (Dw) for a specimen was defined as the mean of distance
[image:2.612.49.550.81.219.2]values for all pairs of cloned cDNAs from that specimen, with each pair’s contribution weighted according to the proportion of cloned cDNAs represented by its clonotype. This calculation was simplified by summing the intraclonotype and interclonotype diversities as separate terms and can be represented as follows:
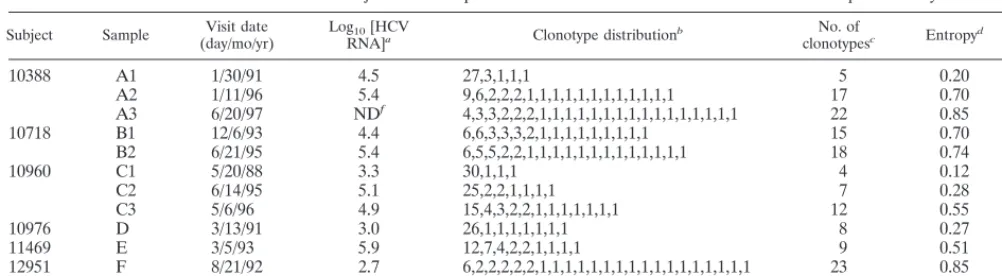
TABLE 1. Characteristics of subjects and samples and results of the HDA
1
SSCP method and sequence analysis
Subject Sample (day/mo/yr)Visit date Log10[HCV
RNA]a Clonotype distributionb clonotypesNo. of c Entropyd Dwe
10388
A1
1/30/91
4.5
27,3,1,1,1
5
0.20
0.52
A2
1/11/96
5.4
9,6,2,2,2,1,1,1,1,1,1,1,1,1,1,1,1
17
0.70
ND
gA3
6/20/97
ND
f4,3,3,2,2,2,1,1,1,1,1,1,1,1,1,1,1,1,1,1,1,1
22
0.85
ND
g10718
B1
12/6/93
4.4
6,6,3,3,3,2,1,1,1,1,1,1,1,1,1
15
0.70
ND
gB2
6/21/95
5.4
6,5,5,2,2,1,1,1,1,1,1,1,1,1,1,1,1,1
18
0.74
ND
g10960
C1
5/20/88
3.3
30,1,1,1
4
0.12
0.09
C2
6/14/95
5.1
25,2,2,1,1,1,1
7
0.28
0.66
C3
5/6/96
4.9
15,4,3,2,2,1,1,1,1,1,1,1
12
0.55
1.30
10976
D
3/13/91
3.0
26,1,1,1,1,1,1,1
8
0.27
1.23
11469
E
3/5/93
5.9
12,7,4,2,2,1,1,1,1
9
0.51
0.94
12951
F
8/21/92
2.7
6,2,2,2,2,2,1,1,1,1,1,1,1,1,1,1,1,1,1,1,1,1,1
23
0.85
6.17
40209
G
9/5/95
7.6
14,11,2,2,1,1,1,1
8
0.43
0.52
a[HCV RNA], HCV RNA copies per milliliter of serum.
bEach series shows the number of clones comprising each clonotype for the given samples. cNumber of electrophoretically indistinguishable cloned cDNAs.
dNormalized Shannon entropy, a calculated value that incorporates the number and distribution of clonotypes. eCalculated value that incorporates the distribution of clonotypes and their respective genetic diversities. fND, not done. The most recent value was 5.7, from 6/10/96.
gInsufficient sequence data were obtained for this calculation.
on May 15, 2020 by guest
http://jcm.asm.org/
Dw;
1
S
M2
D
3
O
i51N
diP~i!1
O
i51N21
O
j5i11
N
dijP~i!P~j!
4
where M is the number of cloned cDNAs (generally 33), N is the number of clonotypes, and P(i) is the proportion of cDNAs represented by clonotype i. The denominator of the fractional expression is the binomial coefficient, yielding the number of possible paired comparisons for M sequences. If all cDNAs were sequenced, Dwwould equal the mean of all pairwise distances.
A 32-bit Windows application called ClonoTyper was created by one of the authors (S.C.R.) to perform the complexity and diversity calculations and is available on request.
Nucleotide sequence accession number.The nucleotide sequences presented in this article have been submitted to GenBank (accession no. AF073020 to AF073176).
RESULTS
Clonotypes detected by HDA, SSCP, and HDA
1
SSCP
meth-ods.
For each sample, 33 cloned cDNAs were examined by the
HDA
1
SSCP method, and two investigators (Y.-M.W. and
O.L.) independently assigned clonotypes based on the
migra-tion patterns revealed by HDA alone, the SSCP method alone,
and the HDA
1
SSCP method. These assignments were
.
99%
concordant, and rare discrepancies were resolved in a blinded
fashion. By the HDA
1
SSCP method, the number of
clono-types varied from 4 to 23 per sample (Table 1). The nucleotide
sequence was determined for up to three representatives of
each clonotype indistinguishable by all gel shift assays,
gener-ating a total of 157 cDNA sequences from 12 samples from
seven individuals.
Assay sensitivity was determined from the sequence diversity
within a clonotype (intraclonotype diversity): sensitivity (the
ability of an electrophoretic method to distinguish nonidentical
cloned cDNAs) varies inversely with the intraclonotype
diver-sity. For 10 samples, intraclonotype diversity was lower for the
combined method versus HDA or the SSCP method alone
(Fig. 2A). Only samples A1 and A2 yielded similarly low
in-traclonotype diversity for one of the individual methods (HDA
and the SSCP method, respectively). Intraclonotype diversities
(mean
6
standard deviation [SD]) for the SSCP method,
HDA, and the HDA
1
SSCP method were 3.5%
6
3.4%, 1.6%
6
1.8%, and 0.6%
6
0.9%, respectively. Among cloned
cDNAs indistinguishable by the combined method, the
maxi-mum distance was 3.5%; 98.7% of such sequences differed by
,
2%.
Assay specificity was determined from the sequence diversity
among cloned cDNAs identified as electrophoretically
differ-ent (interclonotype diversity). For all 12 samples, assay
speci-ficity for the combined method was as high as that for either
HDA or SSCP alone (Fig. 2B). Interclonotype diversities for
the SSCP method, HDA, and the HDA
1
SSCP method
[image:3.612.68.266.70.517.2](mean
6
SD) were 3.9%
6
3.1%, 4.2%
6
3.2%, and 4.0%
6
3.2%, respectively, and no two cloned cDNAs assigned to
dif-ferent clonotypes had identical sequences. That the high
sen-sitivity of the combined method was achieved without loss of
specificity was evident in the high proportion of clone pairs
with low intraclonotype diversity by the combined method
compared to those by the other methods (shift to the left in
Fig. 3C compared with positions in Fig. 3A and B), while the
distribution of interclonotype diversity remained the same.
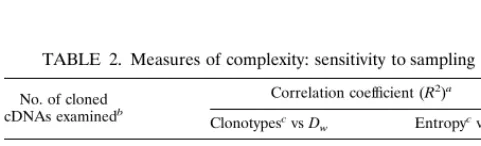
Complexity versus sequence diversity.
We compared
Shan-non entropy to the number of clonotypes as measures of
qua-sispecies complexity. The two measures gave very different
results for some samples, as illustrated in Fig. 4. The number
of clonotypes correlated more strongly than the normalized
Shannon entropy with the D
w, with correlation coefficients
of 0.93 and 0.70, respectively. When the number of cloned
cDNAs assessed was reduced from 33 by analyzing the leftmost
lanes in each sample gel, the correlation between measures of
complexity (number of clonotypes and entropy) and D
wwas
reduced in a nearly linear fashion (Table 2).
DISCUSSION
[image:3.612.109.236.622.655.2]Our data indicate that the HDA
1
SSCP method identified
distinct cloned cDNAs with high sensitivity and specificity. In
addition, by screening 33 cloned cDNAs per sample (versus 2
to 10 as is customary), more precise measurements of viral
FIG. 1. Example of combined HDA and SSCP analysis in one gel, illustrating the importance of driver selection. The E2 region of HCV was amplified from serum by RT-PCR and cloned, and the combined HDA1SSCP procedure was performed. Representative results are shown. (A) Lanes 1 to 4 contain DNA from four cloned cDNAs, with a driver sequence selected according to details given in Materials and Methods. (B) Lanes 1 to 4 contain DNAs from the same four clones, with a different driver sequence from the same sample. S, SSCP; Hn, heteroduplex bands; H0, homoduplex bands.
on May 15, 2020 by guest
http://jcm.asm.org/
complexity were obtained. Viral complexity measured by this
method also correlated with diversity determined by
nucleo-tide sequencing. When analyses were done with fewer cloned
cDNAs, much less accurate estimates were obtained (Table 2),
underscoring the merits of our approach (analysis of 33 cloned
cDNAs by the HDA
1
SSCP method).
In developing this method we sought a highly sensitive
means for detecting distinct sequences in a mixture of cloned
cDNAs, so that we can screen a large number of samples for
sequence variation in future investigations. The sensitivity we
report for the HDA
1
SSCP method is comparable to that
reported for more laborious and expensive methods which
employ radiolabeling and purification of single-stranded
driv-ers (14). Because we defined a clonotype according to any
difference in electrophoretic migration, we expected that the
HDA
1
SSCP method would be at least as sensitive as either
method alone. This is illustrated by Fig. 1A, in which lanes 1
and 2 appear identical by HDA but are clearly different by
SSCP analysis and lanes 3 and 4 appear identical by SSCP
analysis but have different HDA patterns. Importantly, and not
guaranteed by this design, the HDA
1
SSCP method
main-tained high specificity by not assigning identical cloned cDNAs
to different clonotypes. Although methods combining HDA
and SSCP for detection of genetic variation have been
re-ported previously (1), either combined in one gel or performed
separately, they used fewer samples and were not applied to
sequences as variable as HCV-E2 (43).
We developed a subject-specific process for selecting a
cloned cDNA driver because selection of an appropriate driver
to which each variant is annealed is crucial for HDA. For other
viruses, such as human immunodeficiency virus type 1, a single
reference driver for cross-sectional or longitudinal assays
al-lows comparison of gel shift both between individuals and over
time (41). Like others, however, we were unable to form
het-FIG. 2. Intraclonotype versus interclonotype diversity, by specimen. For each specimen, intraclonotype (A) and interclonotype (B) nucleotide sequence comparisons were made and expressed as the mean pairwise genetic distance. Error bars indicate61 SD.on May 15, 2020 by guest
http://jcm.asm.org/
eroduplexes when a driver representing this hypervariable
re-gion from another HCV quasispecies (i.e., another subject)
was used (data not shown). Therefore, we could not use a
single driver for all samples. We found that other approaches
to driver selection, including random choice (14, 47) or
selec-tion of a majority-cloned cDNA (32), resulted in decreased
sensitivity. Use of a driver which represented a majority
clono-type for that specimen resulted in a large number of gel lanes
with overlapping SSCP bands (rather than four distinct ones)
and overlapping hetero- and homoduplex bands, both
poten-tially obscuring small differences in gel shift (Fig. 1B). The
approach described in Materials and Methods resulted in the
selection of divergent minor variants for use as subject-specific
drivers, maximizing clonotype identification while maintaining
simplicity.
The combination of HDA and SSCP in one gel raises some
unique methodological challenges. In order to obtain adequate
resolution for both HDA and SSCP bands, which migrate with
different rates, we found that at least a 15-cm migration
distance was needed (data not shown). Prior studies of the
HDA
1
SSCP method utilized either denaturing conditions
which interfered with heteroduplex formation, producing
in-distinct bands (1, 28, 39, 42), or slow cooling, which decreased
the yield of SSCP by favoring formation of homo- and
hetero-duplexes (33). We found that rapid cooling under
nondenatur-ing conditions resulted in the best yield and resolution (data
not shown). We also found that SYBR Green II or
conven-tional silver staining gave equivalent results, whereas SYBR
Green I or ethidium bromide yielded unacceptably faint
stain-ing of SSCP bands. In order to preserve the SSCP bands it was
FIG. 3. Frequency distributions of intraclonotype and interclonotype diversity for all samples. All possible pairwise sequence comparisons were performed and classified as interclonotype or intraclonotype based on the results of HDA, the SSCP method, or the HDA1SSCP method. A histogram of the resulting percent diversity is displayed.on May 15, 2020 by guest
http://jcm.asm.org/
necessary to perform electrophoresis in a 4°C chamber or at a
low voltage for 32 h as described in Materials and Methods.
Compared to earlier evaluations of HCV quasispecies (19,
32), relatively little viral diversity was detected in our 12 serum
samples. Because a large number of cloned cDNAs was
se-quenced, it is unlikely that diversity was substantially
underes-timated. Rather, the relatively low diversity probably resulted
from selecting samples collected soon after HCV infection
(16). The diversity of an HCV quasispecies increases with
duration of infection, with estimates of 1.44
3
10
23to 1.92
3
10
23nucleotide substitutions per site per year (29, 30). In this
study the five samples from later time points did show
in-creases in entropy, D
w, and the number of clonotypes,
[image:6.612.52.289.69.228.2]com-pared with values from the earlier sample(s) from the same
subject (Table 1). Viral loads also generally increased at later
time points, but viral load did not correlate with diversity (e.g.,
Table 1, samples F and G).
A potential source of error in this type of investigation is
inherent in amplification and sequencing with currently
avail-able polymerases. Even as higher-fidelity thermostavail-able
en-zymes become available, investigators need to remain aware of
polymerase error as a potential source of “unique clones”
which differ by one or two bases from other variants (38).
Gel-based methods are ideal for studying large cohorts
be-cause the same errors will affect both cases and controls, and
their effects will be further reduced by assessing large numbers
of samples. We propose that gel-based methods like ours can
be used to assign a weight to each sequence in a diversity
calculation, according to frequency (clonotype distribution),
avoiding the bias of giving equal weight to an infrequent
vari-ant, regardless of its origin (polymerase artifact or divergent
viral clone).
We calculated Shannon entropy (34) to evaluate its utility as
a measure of complexity that reflects both the number and
distribution of the clonotypes. In contrast, earlier reports have
estimated complexity only from the number of clonotypes. The
effect of neglecting clonotype distribution can be illustrated by
samples D and G (Fig. 4). Both samples yielded eight
clono-types, but the distributions are clearly different, with sample D
dominated by a major clonotype comprising nearly 80% of 33
cloned cDNAs while the major clonotype in sample G
com-prises less than a third of 33 clones. This difference, reflected
in the higher entropy value for sample G, is ignored when only
the number of clonotypes is used to estimate complexity.
Un-balanced distribution of clones is the rule rather than the
exception in HCV (Table 1), some of which may be due to
artifacts incorporated during amplification and sequencing.
Such errors give rise to “solitary clones” which have little effect
on the Shannon entropy calculation but are given equal weight
when the number of clonotypes is used as a measure of
plexity. Shannon entropy has been used to describe the
com-plexity of individual amino sequence positions in sequences
representing human (40) and human immunodeficiency virus
type 1 (20) genomes, as well as for automated gel analysis (7),
and has recently been applied to HCV clone distributions (31).
Despite the theoretical power of entropy to model
complex-ity, the number of clonotypes was more strongly correlated to
sequence diversity in this study. While both methods of
esti-mating complexity are very sensitive to the number of cloned
cDNAs assessed (Table 2), our assessment of 33 clones per
sample in this study favored the use of the number of
clono-types. By extrapolating from the data in Table 2, we predict
that Shannon entropy would be more useful for assessing more
than 50 cloned cDNAs per sample. These results are consistent
with the findings of Pawlotsky et al., who used SSCP of a
185-bp fragment to identify clonotypes, examined 30 HCV
clones amplified from each of 13 subjects, and sequenced up to
three clones per clonotype. They found linear regression of the
normalized Shannon entropy versus the (unweighted) diversity
to have a correlation coefficient (R
2) of 0.331 (31). Whether
this lower correlation was due to the region amplified, the size
of the amplicon, the gel-shift assay used to identify clonotypes,
or weighting of the diversity calculation remains to be
deter-mined. When entropy of sequences from the 5 subjects who
responded to alpha interferon therapy was compared to that of
8 subjects selected from the 40 subjects who did not respond,
those who responded had lower entropy values (31). Further
study with more extensive sampling is required to determine
whether Shannon entropy is truly superior to the number of
clonotypes as a predictor of diversity and whether it has
bio-logical significance.
We report a method for measuring HCV quasispecies
com-plexity that combines HDA and SSCP in a single gel visualized
with UV light. The method was sensitive and specific for
de-tecting clonotypes, and the number of clonotypes detected
correlated strongly with sequence diversity when 33 cloned
cDNAs are assessed. We introduce the use of entropy as a
measure of complexity, incorporating the distribution of
vari-ants as well as the number of clonotypes, but suggest that a
larger number of cloned cDNAs needs to be assessed when this
measure is to be used. Our approach is expected to facilitate
accurate analysis of the large number of cross-sectional and
longitudinal samples that are now becoming available and
could lead to clinical-laboratory assays for diagnosis or
moni-toring of HCV patients.
FIG. 4. Measures of complexity. The clonotype distributions for samples D and G were plotted, and the normalized Shannon entropy values (H9) are indicated in the inset.
TABLE 2. Measures of complexity: sensitivity to sampling
No. of cloned cDNAs examinedb
Correlation coefficient (R2)a Clonotypescvs Dw Entropycvs Dw
11
0.46
0.33
17
0.70
0.44
22
0.78
0.50
33
0.93
0.70
aLeast-squares linear regression R2for the indicated relationship.
bThe leftmost n lanes were examined in rows for which n was,33. cThe number of clonotypes and degree of entropy were calculated from the cloned cDNAs examined.
on May 15, 2020 by guest
http://jcm.asm.org/
[image:6.612.51.292.620.693.2]ACKNOWLEDGMENTS
This study was supported by National Institutes of Health grants
AI-40035, DA-04334, and DA-08004.
We are grateful to the subjects in the ALIVE cohort for their
generosity in providing specimens and time. We also thank Stephen
Villano for identifying appropriate specimens and Amy Weiner for
assistance in the development of the HDA
1
SSCP method.
REFERENCES
1. Axton, R. A., I. M. Hanson, J. Love, A. Seawright, J. Prosser, and V. van
Heyningen.1997. Combined SSCP/heteroduplex analysis in the screening for PAX6 mutations. Mol. Cell Probes 11:287–292.
2. Bukh, J., R. H. Miller, and R. H. Purcell. 1995. Genetic heterogeneity of hepatitis C virus: quasispecies and genotypes. Semin. Liver Dis. 15:41–63. 3. Bukh, J., R. H. Purcell, and R. H. Miller. 1993. At least 12 genotypes of
hepatitis C virus predicted by sequence analysis of the putative E1 gene of isolates collected worldwide. Proc. Natl. Acad. Sci. USA 90:8234–8238. 4. Calvo, P. L., J. Kansopon, K. Sra, S. Quan, R. Dinello, R. Guaschino, G.
Calabrese, F. Danielle, M. R. Brunetto, F. Bonino, L. Massaro, A. Polito, M. Houghton, and A. J. Weiner.1998. Hepatitis C virus heteroduplex tracking assay for genotype determination reveals diverging genotype 2 isolates in Italian hemodialysis patients. J. Clin. Microbiol. 36:227–233.
5. Carrington, M., T. Millter, M. White, B. Gerrard, C. Stewart, M. Dean, and
D. Mann. 1992. Typing of HLA-DQA1 and DQB1 using DNA single-stranded conformational polymorphism. Hum. Immun. 33:208–212. 6. Cotton, R. G. 1993. Current methods of mutation detection. Mutat. Res.
285:125–144.
7. Delwart, E. L., H. Pan, H. W. Sheppard, D. Wolpert, A. U. Neumann, B.
Korber, and J. I. Mullins.1997. Slower evolution of human immunodefi-ciency virus type 1 quasispecies during progression to AIDS. J. Virol. 71: 7498–7508.
8. Delwart, E. L., E. G. Shpaer, J. Louwagie, F. E. McCutchan, M. Grez, W. H.
Rubsamen, and J. I. Mullins.1993. Genetic relationships determined by a DNA heteroduplex mobility assay: analysis of HIV-1 env genes. Science
262:1257–1261.
9. Delwart, E. L., E. G. Shpaer, and J. I. Mullins. 1995. Heteroduplex mobility assays for phylogenetic analysis, p. 154–160. In M. A. Innis, D. H. Gelfand, and J. J. Sninsky (ed.), PCR strategies. Academic Press, San Diego, Calif. 10. Domingo, E., E. Martinez-Salas, F. Sobrino, J. C. de la Torre, A. Portela,
J. Ortin, C. Lopez-Galindez, P. Perez-Brena, N. Villanueva, and R. Najera.
1985. The quasispecies (extremely heterogeneous) nature of viral RNA ge-nome populations: biological relevance—a review. Gene 40:1–8. 11. Eigen, M. 1971. Self organization of matter and the evolution of biological
macromolecules. Naturwissenschaften 58:465–523.
12. Feinstone, S. M., H. J. Alter, H. P. Dienes, Y. Shimizu, H. Popper, D.
Blackmore, D. Sly, W. T. London, and R. H. Purcell.1981. Non-A, non-B hepatitis in chimpanzees and marmosets. J. Infect. Dis. 144:588–598. 13. Gavier, B., M. A. Martı´nez-Gonza´lez, J. I. Riezu-Boj, J. J. Lasarte, N.
Garcia, M. P. Civeira, and J. Prieto. 1997. Viremia after one month of interferon therapy predicts treatment outcome in patients with chronic hep-atitis C. Gastroenterology 113:1647–1653.
14. Gretch, D. R., S. J. Polyak, J. J. Wilson, R. L. Carithers, Jr., J. D. Perkins,
and L. Corey.1996. Tracking hepatitis C virus quasispecies major and minor variants in symptomatic and asymptomatic liver transplant recipients. J. Vi-rol. 70:7622–7631.
15. Higashi, Y., S. Kakumu, K. Yoshioka, T. Wakita, M. Mizokami, K. Ohba, Y.
Ito, T. Ishikawa, M. Takayanagi, and Y. Nagai.1993. Dynamics of genome change in the E2/NS1 region of hepatitis C virus in vivo. Virology 197:659– 668.
16. Honda, M., S. Kaneko, A. Sakai, M. Unoura, S. Murakami, and K.
Koba-yashi.1994. Degree of diversity of hepatitis C virus quasispecies and pro-gression of liver disease. Hepatology 20:1144–1151.
17. Kao, J.-H., P.-J. Chen, M.-Y. Lai, T.-H. Wang, and D.-S. Chen. 1995. Qua-sispecies of hepatitis C virus and genetic drift of the hypervariable region in chronic type C hepatitis. J. Infect. Dis. 172:261–264.
18. Kato, N., Y. Ootsuyama, S. Ohkoshi, T. Nakazawa, H. Sekiya, M. Hijikata,
and K. Shimotohno.1992. Characterization of hypervariable regions in the putative envelope protein of hepatitis C virus. Biochem. Biophys. Res. Com-mun. 189:119–127.
19. Kato, N., Y. Ootsuyama, T. Tanaka, M. Nakagawa, T. Nakazawa, K.
Mu-raiso, S. Ohkoshi, M. Hijikata, and K. Shimotohno.1992. Marked sequence diversity in the putative envelope proteins of hepatitis C viruses. Virus Res.
22:107–123.
20. Korber, B. T., K. J. Kunstman, B. K. Patterson, M. Furtado, M. M.
McEvilly, R. Levy, and S. M. Wolinsky.1994. Genetic differences between blood- and brain-derived viral sequences from human immunodeficiency virus type 1-infected patients: evidence of conserved elements in the V3 region of the envelope protein of brain-derived sequences. J. Virol. 68:7467– 7481.
21. Kreis, S., and T. Whistler. 1997. Rapid identification of measles virus strains by the heteroduplex mobility assay. Virus Res. 47:197–203.
22. Kurosaki, M., N. Enomoto, F. Marumo, and C. Sato. 1993. Rapid sequence variation in the hypervariable region of hepatitis C virus during the course of chronic infection. Hepatology 18:1293–1299.
23. Lee, J. H., T. Stripf, W. K. Roth, and S. Zeuzem. 1997. Non-isotopic detec-tion of hepatitis C virus quasispecies by single strand conformadetec-tion polymor-phism. J. Med. Virol. 53:245–251.
24. Le Guen, B., G. Squadrito, B. Nalpas, P. Berthelot, S. Pol, and C. Brechot. 1997. Hepatitis C virus genome complexity correlates with response to in-terferon therapy: a study in French patients with chronic hepatitis C. Hepa-tology 25:1250–1254.
25. Martell, M., J. I. Esteban, J. Quer, J. Genesca, A. Weiner, R. Esteban, J.
Guardia, and J. Gomez.1992. Hepatitis C virus (HCV) circulates as a population of different but closely related genomes: quasispecies nature of HCV genome distribution. J. Virol. 66:3225–3229.
26. Navas, S., J. Martı´n, J. A. Quiroga, I. Castillo, and V. Carreno. 1998. Genetic diversity and tissue compartmentalization of the hepatitis C virus genome in blood mononuclear cells, liver, and serum from chronic hepatitis C patients. J. Virol. 72:1640–1646.
27. Nelson, J. A. E., S. A. Fiscus, and R. Swanstrom. 1997. Evolutionary variants of the human immunodeficiency virus type 1 V3 region characterized by using a heteroduplex tracking assay. J. Virol. 71:8750–8758.
28. Offermans, M. T., L. Struyk, B. de Geus, F. C. Breedveld, P. J. van den Elsen,
and J. Rozing.1996. Direct assessment of junctional diversity in rearranged T cell receptor beta chain encoding genes by combined heteroduplex and single strand conformation polymorphism (SSCP) analysis. J. Immunol. Methods 191:21–31.
29. Ogata, N., H. J. Alter, R. H. Miller, and R. H. Purcell. 1991. Nucleotide sequence and mutation rate of the H strain of hepatitis C virus. Proc. Natl. Acad. Sci. USA 88:3392–3396.
30. Okamoto, H., M. Kojima, S. Okada, H. Yoshizawa, H. Iizuka, T. Tanaka,
E. E. Muchmore, D. A. Peterson, Y. Ito, and S. Mishiro.1992. Genetic drift of hepatitis C virus during an 8.2-year infection in a chimpanzee: variability and stability. Virology 190:894–899.
31. Pawlotsky, J. M., G. Germanidis, A. U. Neumann, M. Pellerin, P. O.
Frain-ais, and D. Dhumeaux.1998. Interferon resistance of hepatitis C virus ge-notype 1b: relationship to nonstructural 5A gene quasispecies mutations. J. Virol. 72:2795–2805.
32. Polyak, S. J., G. Faulkner, R. L. Carithers, Jr., L. Corey, and D. R. Gretch. 1997. Assessment of hepatitis C virus quasispecies heterogeneity by gel shift analysis: correlation with response to interferon therapy. J. Infect. Dis. 175: 1101–1107.
33. Pursall, M. C., T. M. Clay, and J. L. Bidwell. 1996. Combined PCR-hetero-duplex and PCR-SSCP analysis for matching of HLA-A, -B and -C allotypes in marrow transplantation. Eur. J. Immunogenet. 23:41–53.
34. Shannon, C. E. 1948. A mathematical theory of communication. Bell Syst. Technol. J. 27:379–423.
35. Simmonds, P. 1995. Variability of hepatitis C virus. Hepatology 21:570–583. 36. Simmonds, P., E. C. Holmes, T.-A. Cha, S.-W. Chan, F. McOmish, B. Irvine,
E. Beall, P. L. Yap, J. Kolberg, and M. S. Urdea.1993. Classification of hepatitis C virus into six major genotypes and a series of subtypes by phy-logenetic analysis of the NS-5 region. J. Gen. Virol. 74:2391–2399. 37. Simmonds, P., D. B. Smith, F. McOmish, P. L. Yap, J. Kolberg, M. S. Urdea,
and E. C. Holmes.1994. Identification of genotypes of hepatitis C virus by sequence comparisons in the core, E1 and NS-5 regions. J. Gen. Virol.
75:1053–1061.
38. Smith, D. B., J. McAllister, C. Casino, and P. Simmonds. 1997. Virus ’quasispecies’: making a mountain out of a molehill? J. Gen. Virol. 78:1511– 1519.
39. Spritz, R. A., S. A. Holmes, R. Ramesar, J. Greenberg, D. Curtis, and P.
Beighton.1992. Mutations of the KIT (mast/stem cell growth factor recep-tor) proto-oncogene account for a continuous range of phenotypes in human piebaldism. Am. J. Hum. Genet. 51:1058–1065. (Erratum, 52:654, 1993.)
40. Stewart, J. J., C. Y. Lee, S. Ibrahim, P. Watts, M. Shlomchik, M. Weigert,
and S. Litwin.1997. A Shannon entropy analysis of immunoglobulin and T cell receptor. Mol. Immunol. 34:1067–1082.
41. Strunnikova, N., S. C. Ray, R. A. Livingston, E. Rubalcaba, and R. P. Viscidi. 1995. Convergent evolution within the V3 loop domain of human immuno-deficiency virus type 1 in association with disease progression. J. Virol.
69:7548–7558.
42. Sud, R., I. C. Talbot, and J. D. Delhanty. 1996. Infrequent alterations of the APC and MCC genes in gastric cancers from British patients. Br. J. Cancer
74:1104–1108.
43. Thomas, A. W., R. Morgan, M. Sweeney, A. Rees, and J. Alcolado. 1994. The detection of mitochondrial DNA mutations using single stranded conforma-tion polymorphism (SSCP) analysis and heteroduplex analysis. Hum. Genet.
94:621–623.
44. Villano, S. A., D. Vlahov, K. E. Nelson, S. Cohn, and D. L. Thomas. Persis-tence of viremia and the importance of long-term follow-up after acute hepatitis C infection. Unpublished data.
on May 15, 2020 by guest
http://jcm.asm.org/
45. Villano, S. A., D. Vlahov, K. E. Nelson, C. M. Lyles, S. Cohn, and D. L.
Thomas.1997. Incidence and risk factors for hepatitis C among injection drug users in Baltimore, Maryland. J. Clin. Microbiol. 35:3274–3277. 46. Weiner, A. J., M. J. Brauer, J. Rosenblatt, K. H. Richman, J. Tung, K.
Crawford, F. Bonino, G. Saracco, Q. L. Choo, M. Houghton, et al.1991. Variable and hypervariable domains are found in the regions of HCV
cor-responding to the flavivirus envelope and NS1 proteins and the pestivirus envelope glycoproteins. Virology 180:842–848.
47. Wilson, J. J., S. J. Polyak, T. D. Day, and D. R. Gretch. 1995. Characteriza-tion of simple and complex hepatitis C virus quasispecies by heteroduplex gel shift analysis: correlation with nucleotide sequencing. J. Gen. Virol. 76:1763– 1771.