M E T H O D
Open Access
Haplotype and isoform specific expression
estimation using multi-mapping RNA-seq reads
Ernest Turro
1*, Shu-Yi Su
2, Ângela Gonçalves
3, Lachlan JM Coin
1, Sylvia Richardson
1, Alex Lewin
1Abstract
We present a novel pipeline and methodology for simultaneously estimating isoform expression and allelic imbalance in diploid organisms using RNA-seq data. We achieve this by modeling the expression of haplotype-specific isoforms. If unknown, the two parental isoform sequences can be individually reconstructed. A new statistical method, MMSEQ, deconvolves the mapping of reads to multiple transcripts (isoforms or haplotype-specific isoforms). Our software can take into account non-uniform read generation and works with paired-end reads.
Background
High-throughput sequencing of RNA, known as RNA-seq, is a promising new approach to transcriptome pro-filing. RNA-seq has a greater dynamic range than micro-arrays, which suffer from non-specific hybridization and saturation biases. Transcriptional subsequences spanning multiple exons can be directly observed, allowing more precise estimation of the expression levels of splice var-iants. Moreover, unlike traditional expression arrays, RNA-seq produces sequence information that can be used for genotyping and phasing of haplotypes, thus permitting inferences to be made about the expression of each of the two parental haplotypes of a transcript in a diploid organism.
The first step in RNA-seq experiments is the prepara-tion of cDNA libraries, whereby RNA is isolated, frag-mented and synthesized to cDNA. Sequencing of one or both ends of the fragments then takes place to produce millions of short reads and an associated base call uncertainty measure for each position in each read. The reads are then aligned, usually allowing for sequencing errors and polymorphisms, to a set of reference chromo-somes or transcripts. The alignments of the reads are the fundamental data used to study biological phenom-ena such as isoform expression levels and allelic imbal-ance. Methods have recently been developed to estimate these two quantities separately but no approaches exist to make inferences about them simultaneously to
estimate expression at the haplotype and isoform (’haplo-isoform’) level. In diploid organisms, this level of analysis can contribute to our understanding ofcis vs.
trans regulation [1] and epigenetic effects such as
geno-mic imprinting [2]. We first set out the problems of iso-form level expression, allelic mapping biases and allelic imbalance, and then propose a pipeline and statistical model to deal with them.
Isoform level expression
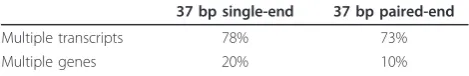
Multiple isoforms of the same gene and multiple genes within paralogos gene families often exhibit exonic sequence similarity or identity. Therefore, given the short length of reads relative to isoforms, many reads map to multiple transcripts (Table 1). Discarding multi-mapping reads leads to a significant loss of information as well as a systematic underestimation of expression estimates. For reads that map to multiple locations, one solution is to distribute the multi-mapping reads according to the cov-erage ratios at each location using only single-mapping reads [3]. However, this does not address the problem of inferring expression levels at the isoform level.
Essentially, the estimation of isoform level expression can be done by constructing a matrix of indicator func-tions Mit = 1 if region i belongs to transcript t. The
‘regions’ may for now be thought of as exons or part exons, though we later define them more generally. Using this construction it is natural to define a model:
Xit ∼ Pois bs M( i it t ), (1)
* Correspondence: [email protected]
1
Department of Epidemiology and Biostatistics, Imperial College London, Norfolk Place, London, W2 1PG, UK
Full list of author information is available at the end of the article
whereXit are the (unobserved) counts of reads from
region i of transcript t, b is a normalization constant used when comparing experiments, μt is a parameter
representing the expression of transcripttandsiis the
effective length of regioni(that is the number of
possi-ble start positions for reads in the region). This model can be fit using an expectation maximization (EM) algo-rithm, since the Xit are unobserved but their sums
across transcripts ki ≡
∑
tXit are observed.This model has been used by [4] in their POEM soft-ware, withirepresenting exons. Their method does not use reads that span multiple exons or reads that map to multiple genes. The same model has been used in [5], with
irepresenting exons or part exons, or regions spanning exon junctions, enabling good estimation of isoform expression within genes. They do not, however, include reads mapping to multiple genes. The RSEM method [6] employs a similar model, but models the probability of each read individually, rather than read counts. This method allows reads to come from multiple genes as well as multiple isoforms of the same gene. The modeling of individual reads allows RSEM to accommodate general position-specific biases in the generation of reads. How-ever, two recent papers [7,8] have shown that deviations from uniformity in the generation of reads are in great part sequence rather than position-dependent for a given experimental protocol and sequencing platform. Further-more, the computational requirements of modeling indivi-dual reads increasing proportionately with read depth, which, in the case of RSEM, is exacerbated further by the use of computationally intensive bootstrapping procedures to estimate standard errors. None of the above methods are compatible with paired-end data. A recently published method, Cufflinks [9], focuses on transcript assembly as well as expression estimation using an extension of the [5] model that is compatible with paired-end data. However, this method does not model sequence-specific uniformity biases and uses a fixed down-weighting scheme to account for reads mapping to more than one transcription locus, meaning that the abundances of transcripts in different regions are estimated independently.
Allelic imbalance
Studies of imbalances between the expression of two parental haplotypes have mostly been restricted to
testing the null hypothesis of equal expression between two alleles at a single heterozygous base, typically with a binomial test [1,2,10]. However, as transcripts may con-tain multiple heterozygotes, a more powerful approach is to assess the presence of a consistent imbalance across all the heterozygotes in a gene together. This has been done on a case-by-case basis using read pairs that overlap two heterozygous SNPs [11] while [12] propose an extension to the binomial test for detecting allelic imbalance that takes into account all SNPs and their positions in a gene. However, this approach, which is a statistical test rather than a method of quantifying hap-lotype-specific expression, assumes imbalances to be homogeneous along genes and thus does not take into account the possibility of asymmetric imbalances between isoforms of the same gene.
Allelic mapping biases
Aligners usually have a maximum tolerance threshold for mismatches between reads and the reference. Reads containing non-reference alleles are less likely to align than reads matching the reference exactly, so genes with a high frequency of non-reference alleles may be under-estimated. Ideally, aligners would accept ambiguity codes for alleles that segregate in the species (cf. Novoa-lign [13]), but no free software is currently able to do this. A possible workaround is to change the nucleotide at each SNP to an allele that does not segregate in the species, as has been proposed to remove biases when estimating allelic imbalance [10]. However, in the con-text of gene expression analysis, this leads to even greater underestimation of genes with many non-refer-ence alleles and an increase in incorrect alignments to homologous regions. Instead, we propose aligning to a sample-specific transcriptome reference, constructed from (potentially phased) genotype calls.
MMSEQ
In this paper we present a new pipeline, including a novel statistical method called MMSEQ, for estimating haplotype, isoform and gene specific expression. The MMSEQ software is straightforward to use, fully docu-mented and freely available online [14] and as part of ArrayExpressHTS [15]. Our pipeline exploits all reads that can be mapped to at least one annotated transcript sequence and reduces the number of alignments missed due to the presence of non-reference alleles. It is com-patible with paired-end data and makes use of inferred insert size information to choose the best alignments. Our method permits estimating the expression of the two versions of each heterozygote-containing isoform (’haplo-isoform’) individually and thus it can detect asymmetric imbalances between isoforms of the same gene. Our software further takes into account sequence-Table 1 Multi-mapping reads. Approximate proportion of
reads mapping to multiple Ensembl transcripts or genes in human using 37 bp single-end or paired-end data obtained from HapMap individuals
37 bp single-end 37 bp paired-end
Multiple transcripts 78% 73%
[image:2.595.56.291.134.172.2]specific deviations from uniform sampling of reads using the model described in [8] but can flexibly accommo-date other models. We valiaccommo-date our method at the iso-form level with a simulation study, comparing our results to RSEM’s, and applying it to a published Illu-mina dataset consisting of lymphoblastoid cell lines from 61 HapMap individuals [16]. We validate our method at the haplo-isoform level by showing we can deconvolve the expression estimates of haplo-isoforms on the non-pseudoautosomal (non-PAR) region of the X chromosome using a pooled dataset of two HapMap males. We further apply our method to a published dataset of F1initial and reciprocal crosses of CAST/EiJ (CAST) and C57BL/6J (C57) inbred mice [2] and demonstrate that MMSEQ is able to detect parental imbalance between the two haplotypes of each isoform.
Results
Overview of the pipeline
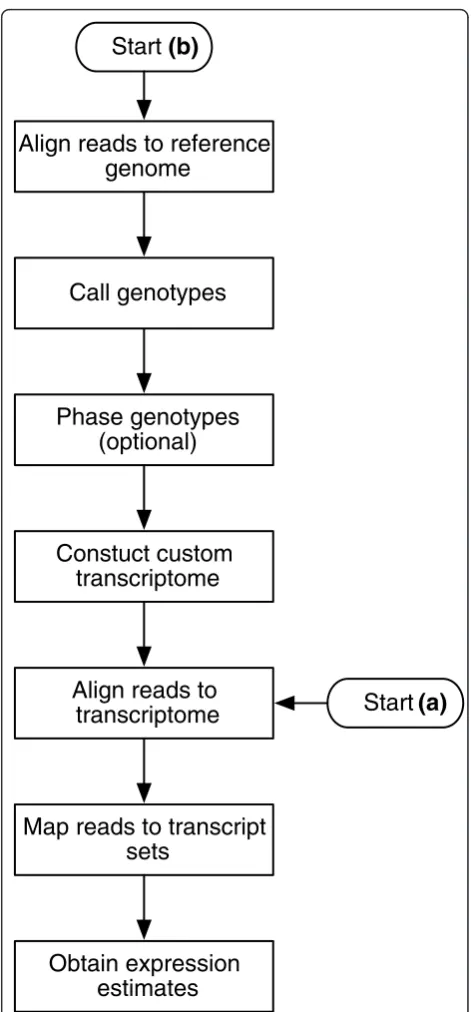
The pipeline can be depicted as a flow chart with two different start positions (Figure 1):
(a) Expression estimation using alignments to a pre-defined transcriptome reference,
(b) Expression estimation using alignments to a tran-scriptome reference that is obtained from the RNA-seq data.
In case (a), the level of estimation (haplo-isoform or isoform) depends on whether the reference includes two copies of heterozygous transcripts. In case (b), it depends on whether the genotypes are phased. The most exhaustive use of the pipeline proceeds as follows. First, the reads are aligned to the standard genome reference using TopHat [17]. Then, genotypes are called with SAMtools pileup [18]. Genotypes are then phased with polyHap [19] using population genotype data to produce a pair of haplotypes for all gene regions on the genome. The standard transcriptome reference is then edited for each individual to match the inferred haplo-types. The reads are realigned to the individualized hap-lotype specific transcriptome reference with Bowtie [20], finding alignments for reads that originally failed to align due to having too many mismatches with the stan-dard reference (approximately 0:3% more reads recov-ered, with some transcripts receiving up to 13% more hits, in the HapMap dataset [16]). Finally, our new method, MMSEQ, is used to disaggregate the expression level of each haplo-isoform.
MMSEQ
Poisson model
We use the model in Equation 1 as a starting point for modeling gene isoforms and extend it to apply to haplo-isoforms. First, we employ a more general definition of ‘region’: each read maps to one set of transcripts, which
Start
(b)
Align reads to reference
genome
Call genotypes
Phase genotypes
(optional)
Constuct custom
transcriptome
Align reads to
transcriptome
Map reads to transcript
sets
Obtain expression
estimates
[image:3.595.304.540.85.592.2]Start
(a)
Figure 1Pipeline flow chart. Flow chart depicting the steps in the pipeline and two main use cases.(a)expression estimation using a pre-defined transcriptome reference;(b)construction of a custom transcriptome reference from the data followed by expression estimation. Haplotype-specific expression can be obtained using a pre-defined transcript reference if the parental transcriptome sequences are known and recombination has no effect (for example in the case of an F1cross of two inbred strains). If the standard (for
may belong to the same gene or to various different genes, and which can have two versions, one containing the paternal and the other the maternal haplotype. These sets are labeled byi. Many reads will map to the exact same set, hence we can model reads counts (ki)
for the set. The Mit are defined very straightforwardly
as the indicator functions for transcript tbelonging to set i. The region length si is the effective length of the
sequence shared between the whole set. If the set of transcripts all belong to the same gene and haplotype, then si may be the effective length of an exon or part
exon. However, aligned reads often map to multiple genes equally well (Table 1) so the region need not cor-respond to an actual region on the genome. Using our definition of a region, thesiwould be difficult to
calcu-late given the sheer number of overlaps and regions, but in fact the si are not needed in the calculation of
the model (see Materials and Methods). Hence we have a model for read counts in which the data and fixed quantities (ki and Mit) are calculated in a
straightfor-ward way, and which allows for reads mapping to mul-tiple isoforms of the same or different genes in exons or exon junctions and to paternal and maternal haplo-types separately.
Without loss of generality, Figure 2a illustrates our formulation for a gene with an alternatively spliced cas-sette exon and Figure 2b illustrates it for a gene with a single heterozygous base. The heterozygote casts a‘ sha-dow’upstream of length equal to the read length, which acts like an alternative middle exon. This is because reads with starting positions within the shadow cover the heterozygote and contain one of the two alleles, thus mapping to only one of the two haplotypes.
We now formulate a Poisson model for read counts from transcript sets:
ki Pois bsi Mit
t t
∼ ⎛
∑
⎝ ⎜ ⎜
⎞
⎠ ⎟ ⎟
, (2)
whereb is a normalization constant, ∑tMitμtis the
total expression from the transcript seti andsiis the
effective length of the region of shared sequence between transcripts in seti. Figure 2a shows how thesican be
cal-culated for the gene with a cassette exon. Note that the sum of lengths of all the regions shared by transcriptt
add up to its effective length (transcript length minus read length plus one for uniformly generated reads):∑i siMit=lt, so the transcript-set model is consistent with
the usual Poisson model. Settingltto the transcript
length minus read length plus one is appropriate if a con-stant Poisson rate is assumed along all positions in a
transcript: rt Pois b t Pois bl
p l
t t
t
∼ ( )∼
=
∑
1 ( ), wherertisthe number of reads originating from transcripttand the
sum is over all possible starting read positionsp. The non-uniformity of read generation demonstrated in [8], however, suggests a variable-rate Poisson model:
rt Pois b tp t Pois bl
p l
t t
t
∼ ∼
=
∑
⎛
⎝ ⎜ ⎜⎜
⎞
⎠ ⎟
⎟⎟
(
)
1
, (3)
where lt is an adjusted effective length, referred to as
the sum of sequence preferences (SSP) in [8]. We use their Poisson regression model to adjust the length of each transcript based on its sequence, but other adjust-ment procedures may be used instead. Briefly, the loga-rithm of the sequencing preference of each possible start position in a transcript is calculated as the sum of an intercept term plus a set of coefficients determined by the sequence immediately upstream and downstream of the start position. It would also be possible to inte-grate the method described in [7], which uses a weight-ing for reads based on the first seven nucleotides of their sequences, by applying this weighting in our calcu-lation ofki. However, this approach does not
incorpo-rate the effects of the sequence composition on the reference upstream of the read start positions or further downstream than seven bases, and we thus prefer to use the [8] method instead. The normalization constantbis used to make lanes with different read depths compar-able. We setb to the total number of reads (in millions) and measure transcript lengths in kilobases, which means the scale of the expression parameter μt is
equivalent to RPKM (reads per kilobase per million mapped reads) described in [3]. In downstream analysis, a more robust measure can be used, such as the library size parameter suggested by [21].
The only unknown parameters in the model are the μt. The observed data are theki and the matrixM and
effective transcript lengths ltare known. In principle the
effective lengths of the transcript setssi can be
calcu-lated, but in fact, they are not needed (see Materials and Methods).
Inference
The maximum likelihood (ML) estimate ofμtcannot be
obtained analytically, so instead we use an expectation maximization (EM) algorithm to compute it, an approach also taken by [4,6] for isoforms. After conver-gence of the algorithm, we output the estimates of μt
and refer to them as MMSEQ EM estimates.
M=
⎛ ⎝1 11 0
0 1 ⎞ ⎠ s=
⎛ ⎝d1d+2d3
d4
⎞ ⎠=
⎛
⎝e1+ee32+−2(−1−1) −1
⎞ ⎠ M=
⎛ ⎝1 11 0
0 1
⎞ ⎠k=
⎛ ⎝64
1 ⎞ ⎠
l1=s1+s2=e1+e2+e3−(−1) l2=s1+s3=e1+e3−(−1)
t2
t1
t1 t2
e1 e2 e3
e1 e3
d1 d2 d3
d1 d4 d3
(a)
t1
t2 ε-1 ε-1 t1,t2t1,t2 t1 t1 t1,t2t1,t2
t1
t1,t2 t1,t2
(b)
t1A
C
G
d1 d2 d3 ε-1
t1B
t1At1B t1A,t1Bt1A,t1B
t1A,t1B
t1A t1A
t1A,t1B
t1Bt1B
k=
⎛ ⎝42
2
⎞ ⎠
Figure 2MMSEQ data structures to represent read mappings to alternative isoforms and alternative haplotypes.(a)Schematic of a gene with an alternatively spliced cassette exon. Each read is labeled according to the transcripts it maps to and placed along its alignment position. Reads that map to both transcripts,t1andt2, are shown in red, reads that map only tot1are shown in blue and the read that maps
only tot2is shown in green. Reads that align with their start positions in the regions labeled byd1andd3(in red) may have come from either
transcript, reads with their start positions ind2(in blue) can only have come from transcript 1, and reads with their start positions ind4(in
green) must be from transcript 2. Each rowiof the indicator matrixMcharacterizes a unique set of transcripts that is mapped to bykireads.
There are three transcript sets: {t1,t2} (red), {t1} (blue) and {t2} (green). Exon lengths aree1,e2,e3. Hences1=d1+d3,s2=d2ands3=d4. The
effective length of transcripttis equal to the sum over the elements ofsthat have a corresponding 1 in columntofM, that is∑isiMit. It can be
seen from the figure that these lengths are the sums of the exons minus read length () plus one, as expected. (b)Schematic of a single-exon gene with a heterozygote near the center. Reads with starting positions in regiond2contain either the‘C’allele or the‘G’allele and thus map
to either the haplo-isoformt1A, which has a‘C’ort1B, which has a‘G’. It is evident that the heterozygote acts like an alternative middle exon,
also be used to estimate errors, as in [6], but it is a com-putationally intensive method requiring repeated runs of the EM algorithm. Instead we use a simple Bayesian model with a vague prior onμt. As before, we use the
augmented data reads per region and transcript,Xit. The
full model is:
Xit|t~Pois bs M( i it t ), (4)
t∼Gam( , ). (5)
Again, the only lengths needed are thelt. The
conju-gacy of the Poisson-Gamma model makes the sampling fast and straightforward as the full conditionals are in closed form (see Materials and Methods). We use the final EM estimate of the μtas the initial values for the
Gibbs sampling. We then produce samples from the whole posterior distributions of theμtand calculate the
sample means and their respective Monte Carlo standard errors (MCSE), which take into account the autocorrela-tions of the samples [22]. We set the hyperprior para-meters toa= 1.2 andb= 0.001, producing a vague prior on theμtthat captures the well-known broad and skewed
distribution of gene expression values. We output the means of the Gibbs samples ofμt, which we refer to as
MMSEQ GS estimates. As we shall show, the regulariza-tion afforded by the Bayesian algorithm produces esti-mates with a lower error than the MMSEQ EM estimates. Moreover, it can readily be shown that for transcript with low coverage, the ML estimate is often zero, even though this is likely to be an underestimate of the expression. For example, suppose there exist two equally-expressed haplo-isoforms differing by only one heterozygote. Under the assumption of uniform sampling of 0.01 reads per nucleotide for both haplo-isoforms, if the read length is 35, then the probability of observing a read containing one allele but no reads containing the other allele is fairly high (2(1-e-0.35)e-0.35≃0.42). The ML estimate of the haplo-isoform with the unsampled allele under this scenario is zero while the ML estimate of the haplo-isoform with the sampled allele is overestimated. With Gibbs sampling, on the other hand, this effect is tempered by the Gamma prior. The MMSEQ GS esti-mates are thus our preferred expression measures. Best mismatch stratum filter
While a read may align to multiple transcripts, not all alignments may be equally reliable. We therefore filter out all alignments that do not have the minimal number of mismatches for a given read or read pair (similar to
the –strata switch in Bowtie, but compatible with
paired as well as single end data). In the case of paired-end data, the number of mismatches from both paired-ends is added up to determine the‘mismatch stratum’of a read pair. This filter is crucial in order to correctly
discriminate between the two versions of an isoform at a heterozygous position, since reads from one haplotype also match the alternative haplotype with an additional mismatch. The stratum filter thus ensures that reads are properly assigned to the correct haplotype.
Insert size filter for paired-end data
For paired-end data, both reads in a pair must align to a transcript for the mapping to be considered. If the frag-ments are sufficiently large, the alignfrag-ments may span three exons and align to transcripts that both retain and skip the middle exon. However, the alignment with an inferred fragment size (also called insert size) that is nearer to the expected insert size from the fragmentation protocol, is more likely to be correct. We exploit this information by applying an insert size filter to alignments in the best mis-match stratum for each read. If an alignment’s insert size is nearer thanxbp (for example equivalent to one stan-dard deviation) away from the expected insert size, then all other alignments for that read with an insert size greater thanxbp away from the expected insert size are removed. This filter can be thought of as an extension of mismatch-based filtering for reporting only alignments with moderately high probability of being true. Although full probabilistic modeling is more principled, filtering is a commonplace approach to reducing alignment candidates for each read to a set that can be dealt with pragmatically. For the HapMap dataset, mistakes in the protocol resulted in two distributions of insert sizes within some samples, so we omitted this filter.
MMSEQ output
Themmseqprogram produces three files each containing
EM and GS expression estimates with associated MCSEs. The first file provides estimates at the transcript/haplo-isoform level, the second file provides aggregate estimates for sets of transcripts that have been amalgamated due to having identical sequences (and therefore indistinguish-able expression levels), and the third file aggregates tran-script estimates into genes, thus providing gene-level estimates. Homozygous transcripts are aggregated together, whereas heterozygous transcripts are aggre-gated separately to produce‘haplo-gene’level estimates. With respect to transcripts that have identical sequences and hence indistinguishable and unidentifiable expression levels, the posterior samples exhibit high variance and strong anti-correlation but the sum of their expression can be precisely estimated (Additional file 1). We there-fore recommend use of the amalgamated estimates.
Performance and scalability
total number of observed reads do not result in com-mensurate increases in the size ofM, because additional reads tend to map to transcript sets that have been mapped to by previous reads (Table 2). Consequently,
themmseq program exhibits economies of scale which
allow it to cope with future increases in throughput. This contrasts with the RSEM method, which represents each read separately in their indicator matrix that maps reads to isoforms [6].
Correction for non-uniform read sampling
We have assessed the effect of applying the Poisson regression [8] correction for non-uniform sampling using read data from three Illumina Genome Analyzer II (GAII) lanes from the HapMap dataset [16] (described below). Two of the samples were from the same run (ID 3125) and a third from a separate run (ID 3122). We obtained Poisson regression coefficients for 20 bases upstream and downstream of each possible start position using the first 10 million alignments for each lane. The regression model was fitted using only the most highly expressed transcripts, as these have the best signal-to-noise ratio [8]. Specifically, from the 500 transcripts with the highest average number of nucleotides per position, we selected a subset containing only one transcript per gene so as to avoid double-counting of sequence prefer-ences. As shown in Additional file 2, the coefficients are highly stable across both lanes and runs. The time-con-suming task of calculating adjusted transcript lengths separately for each lane is therefore unnecessary. Instead, our software can reuse the adjusted transcript lengths calculated from one sample when analyzing other sam-ples. Variations in the Poisson rate from base to base tend to average out over the length of each transcript, and thus the adjustments to the lengths are generally slight (Additional file 3). As expected from the Poisson model (Equation 3), changes in the expression estimates (estimates ofμt) tend to be inversely proportional to
adjustments to the lengths. Nevertheless, as transcripts
sharing reads may be adjusted in opposite directions, for some transcripts even a small change in the length has a significant impact on the expression estimate (Figure 3).
Simulation study of isoform expression estimation
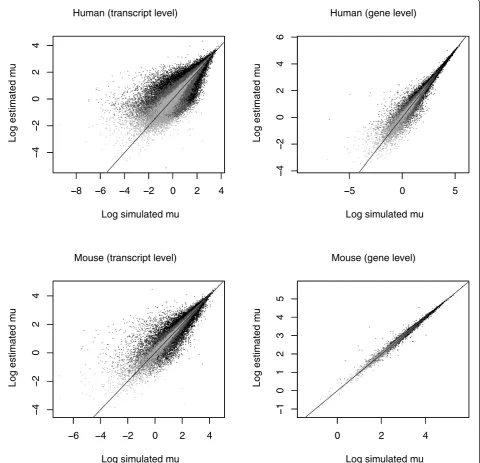
We simulated reads from human and mouse Ensembl cDNA files under the assumption of uniform sampling of reads and ran the MMSEQ workflow. We found good correlation between simulated and estimated expression values and between dispersion around the true values and estimated MCSEs. We did however observe a small upward bias in our estimates of tran-scripts with low expression levels, attributable to our use of the mean to summarize highly skewed distribu-tions. We evaluated our gene-level estimates by sum-ming over the isoform components within each gene. As anticipated, we obtained more precise estimates for genes than for transcripts (Figure 4).
We also observed better estimates for mouse, which has 45,452 annotated transcripts, than for human, which has higher splicing complexity manifested in 122,636 annotated transcripts (Figure 5). Transcripts may be connected to other transcripts via reads that align to regions shared by isoforms of the same gene or to dif-ferent genes with sequence homology. The complexity of the graph that connects transcripts with each other reflects the ambiguity in the assignment of reads to
−0.6 −0.4
−0.2
0.0
0.2
0.4
−
2
−
1
0123
Log FC transcript length
Log FC e
xpression
[image:7.595.306.540.434.643.2]Figure 3 Impact on expression of transcript lengths adjustment. Smooth scatterplot of the log fold change in transcript length after adjusting for non-uniform read generation vs. the log fold change in expression. The hundred transcripts in the lowest density regions are shown as black dots. Changes in the expression estimates tend to be inversely proportional to adjustments to the lengths but for some transcripts even a small change in the length has a significant impact on the expression estimate.
Table 2mmseqperformance. Performance of themmseq program on subsets of different sizes of the HapMap paired-end dataset
Read pairs (millions) Dimension ofM Runtime (seconds)
1 63,924 × 68,666 507 2 84,417 × 75,649 541 3 97,576 × 79,035 746 4 107,344 × 81,289 793 8 134,489 × 86,528 1,047 16 166,100 × 91,023 1,204
transcripts and thus the errors in our estimates. A bar plot of the number of transcripts that each transcript is connected to in human and mouse demonstrates a sig-nificant difference in complexity between the annotated transcriptomes of the two species (Additional file 4).
Comparison of isoform expression estimation between MMSEQ and RSEM
Like MMSEQ, the RSEM method [6] makes use of all classes of reads to estimate isoform expression. The
authors have shown an improvement of their method for gene-level estimation over strategies that discard multiply aligned reads or allocate them to mapped transcripts according to the coverage by single-mapping reads (as in [3]). However, isoform-level results for their method have not been assessed. We obtained RSEM estimates for Ensembl transcripts using our simulated human sequence dataset for the purposes of comparison.
We scaled our simulated and estimated expression values to add up to one in order to make them
8 6 4 2 0 2 4
4
20
2
4
Human (transcript level)
Log simulated mu
Log estimated m
u
5 0 5
4
20
2
4
6
Human (gene level)
Log simulated mu
Log estimated m
u
6 4 2 0 2 4
4
2
024
Mouse (transcript level)
Log simulated mu
Log estimated m
u
0 2 4
1
012345
Mouse (gene level)
Log simulated mu
Log estimated m
u
8 6 4 2 0 2 4
4
2
0
2
4
Human (transcript level)
Log simulated mu
L
og est
imate
d
m
u
5 0 5
4
2
0
2
4
6
Human (gene level)
Log simulated mu
Lo
g
estimated
m
u
6 4 2 0 2 4
4
2
0
2
4
Mouse (transcript level)
Log simulated mu
Lo
g estimated
m
u
0 2 4
1
0
1
2
3
4
5
Mouse (gene level)
Log simulated mu
Lo
g est
imate
d
m
[image:8.595.58.539.91.554.2]u
comparable to RSEM’s fractional expression estimates. We found that RSEM and MMSEQ EM are comparable but, unlike the MMSEQ EM algorithm, RSEM tended to overestimate some medium-expression transcripts. Both the RSEM and MMSEQ EM algorithms tended to underestimate some low-expression transcripts, pushing them very close to zero and thus producing very large errors on the log scale. This was avoided by the regular-ization of the Gibbs algorithm, which produced tighter estimates and only overestimated slightly some very lowly expressed transcripts (Figure 5 and Additional file 5), showing the benefits of using the whole posterior distribution ofμtto estimate expression rather than a
maximization strategy.
Isoform-level application to the HapMap dataset
The HapMap paired-end Illumina GAII dataset [16] consists of 73 lanes: 7 lanes for the same Yoruban indi-vidual, another 7 lanes for the same CEU individual and the remaining 59 lanes each for different CEU indivi-duals. The authors assessed exon-count correlations between the lanes. Here we look at transcript and gene-level correlations. We analyzed the data using the MMSEQ pipeline, aligning approximately 75% of reads
to Ensembl human reference transcripts. The average rank correlation was 0.92 and 0.84 respectively at the gene and transcript level (Figure 6). When comparing identical samples at the gene level the rank correlation ranged from 0.96 to 0.97 for the Yoruban individual and from 0.92 to 0.97 for the CEU individual. At the tran-script level, the ranges were 0.91 to 0.92 and 0.90 to 0.91 for the Yoruban and CEU individuals respectively. The transcript-level values are comparable to exon-count correlations found by [16]. Both are lower than the gene-level correlation, as might be expected due to the inclusion of within-gene variance.
Although the ordering of transcripts and genes was broadly maintained even between lanes belonging to dif-ferent individuals and runs, we found a striking contrast in the distribution of expression values between lanes of the same individual and lanes of different individuals (Additional file 6). The consistency of expression values for lanes of the same individual indicates that the tech-nical replicability of the Illumina GAII sequencer is extremely high and therefore that the variation observed between lanes from different individuals is mostly a reflection of biological variability. This is in line with previous research showing that sequence count data
0e+00 2e 05 4e 05 6e 05 8e 05
0e+00 4e 04 8e 04 RSEM
Normalised simulated expression
N or ma lise d est imate d e xpress ion
0e+00 2e 05 4e 05 6e 05 8e 05
0e+00 4e 05 8e 05 RSEM (blow-up)
Normalised simulated expression
N or ma lise d est imate d e xpress ion
0e+00 2e 05 4e 05 6e 05 8e 05
0e+00 4e 05 8e 05 MMSEQ EM
Normalised simulated expression
N or ma lise d est imate d e xpress ion
0e+00 2e 05 4e 05 6e 05 8e 05
0e+00 4e 05 8e 05 MMSEQ GS
Normalised simulated expression
N or ma lise d est imate d e xpress ion
0e+00 2e 05 4e 05 6e 05 8e 05
0e+0 0 4e 04 8e 04 RSEM
Normalised simulated expression
No rm alised es ti m a ted e xpr ess ion
0e+00 2e 05 4e 05 6e 05 8e 05
0 e+00 4e 05 8e 05 RSEM (blow-up)
Normalised simulated expression
No rma lise d est imate d e xpr ess ion
0e+00 2e 05 4e 05 6e 05 8e 05
0 e+ 00 4e 0 5 8e 05 MMSEQ EM
Normalised simulated expression
No rm alised es ti m a ted e xpr ess ion
0e+00 2e 05 4e 05 6e 05 8e 05
0e+0 0 4e 05 8e 05 MMSEQ GS
Normalised simulated expression
[image:9.595.65.537.88.207.2]No rmal ise d e sti mat ed e xpr ess ion
Figure 5Scatterplots comparing RSEM with MMSEQ. Scatterplots comparing simulated vs. estimated normalized expression values from RSEM, MMSEQ EM and MMSEQ GS for a simulated human dataset. The second RSEM plot from the left is a blown up version of the plot on the far left so that the y-axis covers the same range as the MMSEQ plots on the right.
4
_14_24_34_54_64_74_82_12_22_32_52_62_72_81_5 4_14_24_34_54_64_74_82_83_63_75_15_25_55_65_75_81_5 1_6 6_16_26_36_56_66_78_18_28_58_68_78_80_27_8 2_84_10_10_20_31_5 7_7 9_81_1 1_3 7_2 2_22_62_83_62_52_62_72_72_85_15_25_35_55_65_7
0.70 0.75 0.80 0.85 0.90 0.95 1.00
Gene-level
Spear man's r ank correlation 0.70 0.80 0.90 1.00 4_14_24_34_54_64_74_82_12_22_32_52_62_72_81_5 4_14_24_34_54_64_74_82_83_63_75_15_25_55_65_75_81_5 1_6 6_16_26_36_56_66_78_18_28_58_68_78_80_27_8 2_84_10_10_20_31_5 7_7 9_81_1 1_3 7_2 2_22_62_83_62_52_62_72_72_85_15_25_35_55_65_7
0.70 0.75 0.80 0.85 0.90 0.95 1.00
Transcript-level
Spear man's r ank correlation 0.70 0.80 0.90 1.00 Lanes Lanes [image:9.595.59.540.557.694.2]follow a negative binomial distribution in biological replicates and a Poisson distribution in technical repli-cates [21]. As such, we expect the variance of our esti-mates to be proportional and greater than proportional to the expression values for technical and biological replicates respectively. This is indeed borne out both at the gene and transcript level (Additional file 7) and cor-roborates the need to take into account extra variability for highly-expressed transcripts in differential expression analysis with biological replication (see Discussion).
Validation of haplo-isoform deconvolution
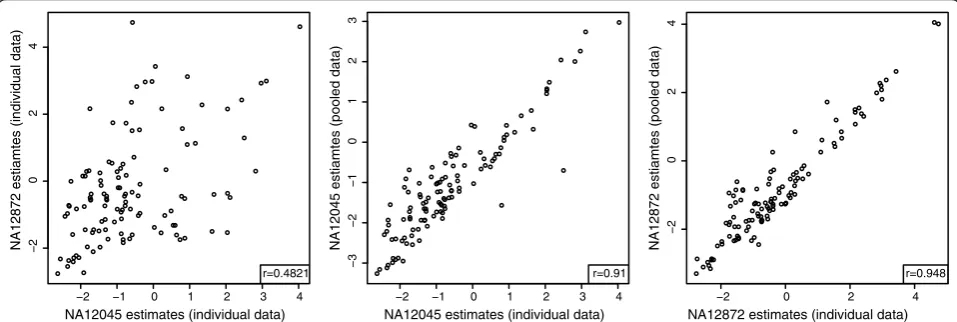
The non-pseudoautosomal region (non-PAR) of the X chromosome in human males is haploid, and thus the alleles in that region can be called directly without the need for phasing. We validated our method for deconvol-ving expression between two haplotypes of the same iso-form as follows. We used the RNA-seq data of two males from the HapMap data (NA12045 and NA12872) to call their haplotypes. We identified 117 isoforms on the non-PAR of the X chromosome that differed between the two individuals. We created custom transcriptome references for each of the two males, containing their individual ver-sions of the 117 isoforms. We then created a third hybrid reference containing two copies of the 117 isoforms, one matching the haplotype of one male and the second matching the haplotype of the other. This hybrid refer-ence mimics the case of a female with two X chromo-somes with unknown expression of the two parental copies of each isoform. We obtained individual expres-sion estimates of the 117 isoforms using the separate transcriptome references in each male and compared them with estimates obtained by aligning a dataset pooled from the data of both males to the hybrid refer-ence. Although the original correlation between the two
males was 0.85, the correlation between the individual estimates and the deconvolved estimates was 0.96 and 0.98, showing MMSEQ is capable of disaggregating the expression from paternal and maternal isoforms (Addi-tional file 8).
To test whether MMSEQ is able to recover greater imbalances than found naturally between the two male individuals, we divided the genes of the 117 isoforms that are heterozygous in the hybrid reference into three equal-sized groups. For one group, we artificially removed 90% of the reads hitting one male and, for another group, we artificially removed 90% of the reads hitting the other male. This reduction of reads mimics what would be observed if more extreme imbalances existed. We thus reduced the correlation between the log expression of the two males from 0.85 to 0.48. Despite this large imbalance, there was a cor-relation of 0.91 and 0.95 between the individual and the deconvolved estimates obtained from the pooled dataset (Figure 7), showing that MMSEQ is able to accurately disaggregate haplotype-specific expression in the presence of large imbalances.
Demonstration of haplo-isoform expression estimation using an F1hybrid mouse brain dataset
We have applied MMSEQ to a published murine embryo-nic day 15 RNA-seq dataset of CAST/C57 initial (F1i) and reciprocal (F1r) crosses [2]. Each RNA sample was a pool from four individuals. The C57 reference transcriptome used by the authors is available from the UCSC Genome Browser [23]. The authors called SNPs by aligning reads from the CAST samples to the C57 reference. We created a CAST reference transcriptome by changing alleles in the C57 reference sequences according to those SNP calls. The two references were combined in a hybrid reference
−2 −1 0 1 2 3 4
−
2
024
NA12045 estimates (individual data)
NA12872 estiamtes (individual data)
r=0.4821
−2 −1 0 1 2 3 4
−3
−2
−1
0
1
2
3
NA12045 estimates (individual data)
NA12045 estiamtes (pooled data)
r=0.91
−2 0 2 4
−2
0
2
4
NA12872 estimates (individual data)
NA12872 estiamtes (pooled data)
[image:10.595.58.537.521.682.2]r=0.948
containing two entries for isoforms that differed in sequence between C57 and CAST. Thus there is a one-to-one mapping between SNPs called in the parents and het-erozygotes in the hybrids. The data consist of 152 and 159 million 36 bp Illumina GAII reads for F1i and F1r respectively.
A scatterplot of the CAST/C57 differential expres-sion between F1i and F1r crosses reveal a clear cluster-ing of points into three groups (Figure 8). Firstly, the points on the upper-left to lower-right diagonal corre-spond to transcripts which show imbalance towards the parent of origin, suggesting they are imprinted. Those on the upper-left quadrant and bottom-right quadrant correspond to maternally and paternally imprinted transcripts respectively. Transcripts termed ‘consensus imprinted’ by [2] are highlighted in color. These were defined arbitrarily by the authors as tran-scripts with more than two heterozygotes exhibiting imbalance in favor of the same parental sex, at least one of which was significant in a c2 goodness-of- fit test with a P-valuethreshold of 0.05.
We also identified a clustering of transcripts that exhibited CAST overexpression in the F1i hybrids but approximately balanced expression in the F1r’s. We identified the cluster as consisting wholly of transcripts on the X chromosome (Additional file 9), which sug-gests that the initial crosses were male and the
reciprocal crosses female. The sexes of the hybrid mice are in fact unknown. There was a slight skew in favor of the CAST strand in the reciprocal crosses. We think it is unlikely that this was due to mapping biases, since the CAST reference was produced from SNP calls against the C57 reference and was thus of lower quality, so any mapping bias would be expected to be in favor of C57. Moreover, [24] found a similar skew in adult samples of the same crosses. It is possible that the skew is the result of a selective bias in favor of C57 X-inacti-vated cells [25], possibly caused by one or more of the three mutations on the X-inactivation transcript (UCSC ID uc009tzp.1) or mutations in its promoter region.
The third grouping in the plot is on the lower-left to upper-right diagonal. These transcripts demonstrate consistent CAST/C57 differential expression regardless of the sex-strain combination of the parents, and are thus indicative ofcisregulation.
One advantage of MMSEQ is that imbalances are assessed at the transcript level rather than for individual SNPs. Thus it is not necessary to set arbitrary thresholds on the numbers of heterozygotes or the magnitude and significance of the imbalances to make claims about tran-script-level imbalances. Indeed, some of the transcripts that contain one or more heterozygote with a significant
P-valuebut were not classified as‘consensus imprinted’
by [2] are clearly shown to be imprinted by our results. Note however that 27 transcripts had significant hetero-zygotes with imbalances in opposing directions, demon-strating that it is not always appropriate to generalize from a single locus to make claims of imbalance at the transcript level (Figure 8 and Additional file 10).
[image:11.595.57.292.426.633.2]For genes containing heterozygotes with opposing imbalances, one approach is to scan the transcript anno-tations to identify isoform structures consistent with the observed SNP positions and imbalances. This approach was taken by [2], who defined these genes as ‘complex’ as long as at least one SNP was significant. An example of a complex gene isH13, which has two short isoforms and three longer isoforms with several additional exons towards the 3’end (Figure 9). The short isoforms con-tained heterozygotes with a paternal bias in their 3’ exons while the heterozygotes on the 3’and intermedi-ary exons of the longer isoforms had a maternal bias (cf. Figure S9 of [2] for a SNP-by-SNP visualization of the results of their preoptic area F1 samples). Using MMSEQ, we were able to discern this effect by direct quantification of haplo-isoforms. The two short isoforms were clearly imbalanced towards the paternally inherited haplotype while two of the long isoforms were clearly imbalanced towards the maternally inherited haplotype. An additional gene within the boundaries of H13,
Mcts2, was also found to be paternally overexpressed
(Table 3). By exploiting the data and annotation
6 4 2 0 2 4 6
6
4
20
2
4
6
X transcripts
Gregg et al. "consensus" mat. imprinted transcripts Gregg et al. "consensus" pat. imprinted transcripts
F1r CASTfather C57
mother
F1
i
CAST mother
C57 father
Figure 8Reciprocal vs. initial cross, highlighting‘consensus’ imbalanced isoforms and X transcripts. Scatterplot of log fold changes between haplo-isoforms in the reciprocal (F1r) and the
initial (F1i) cross, highlighting X transcripts in blue, isoforms termed
simultaneously, MMSEQ can be used to detect opposing imbalances between isoforms of the same gene directly.
Discussion
We have presented a pipeline and statistical method that can disaggregate expression between isoforms and even between the two haplotypes of each isoform within an individual. MMSEQ produces improved isoform esti-mates compared to RSEM for medium to low expres-sion transcripts, is more scalable, and estimates standard errors more efficiently. Furthermore, our principled approach to haplo-isoform quantification obviates the need for ad-hoc interpretations of SNP-by-SNP imbal-ances in terms of transcripts. Two aspects of our method, however, deserve further discussion.
Transcript discovery
MMSEQ aims to quantify the abundance of known tran-scripts, and as such relies on the comprehensiveness of the transcriptome’s annotation. It is usually possible to align a very large proportion of the reads to Ensembl transcripts (approximately 75% in the HapMap study using Ensembl version 56). However, samples may contain previously unobserved genes or isoforms. MMSEQ can in such cases work in tandem with transcript discovery methods by add-ing newly predicted isoform sequences to the reference transcript FASTA file and using it in the alignment and mapping steps of the MMSEQ workflow.
Modeling biological variability
The Poisson distribution captures technical variability arising in repeated sequencing experiments with the same biological sample. The true expression value is, in effect, fixed by the experiment, and the only source of variability arises from measurement error and mapping uncertainty. However, between biological replicates such as different individuals in the HapMap study, there is, additionally, variability of a biological origin. As has been previously reported, this results in expression values between replicates that show overdispersion, captured, for example, by a negative binomial distribution [21].
Here we have focused on the problem of estimating the posterior distribution of expression values indepen-dently per sample. Nevertheless, it would be possible to add a further level to our Bayesian model to capture overdispersion across samples flexibly. For example, if exchangeable Gamma priors are set on theμt, a suitable
negative binomial model can be induced.
Phasing with paired-end data
In this work, we have phased genotype calls obtained from SAMtools pileups - an approach that works well with both single and paired-end data. However, in the case of paired-end data, the haplotypes observed directly at multiple SNPs spanned by overlapping read pairs could be used to increase confidence in the phasing calls. Although incorporating this information would benefit phasing estimates only for some sets of SNPs, we believe it is a worthwhile area of future research. As phasing is a distinct step in our pipeline, improved methodologies can be integrated flexibly as they become available.
Conclusions
RNA-seq is a promising and rapidly developing technol-ogy that provides sequence and expression intensity information of a sample in a single experiment. We have presented a novel pipeline and fast, scalable metho-dology to estimate expression of diploid organisms at the haplotype, isoform and gene levels. This allows researchers to go beyond allele-specific expression ana-lysis and assess imbalance between paternal and mater-nal copies of isoforms, which in turn may be compared to differential isoform expression between individuals. We have shown that our method is able to deconvolve
Hm13/uc008nfz.1 H13/uc008nga.1 H13/uc008ngb.1 H13/uc008ngc.1 H13/uc008ngd.1 Mcts2/uc008nge.1
[image:12.595.60.539.95.160.2]UCSC Genes Based on RefSeq, UniProt, GenBank, CCDS and Comparative Genomics
Figure 9Isoform structures ofH13andMcts2. Labeled graphical depiction ofH13andMcts2UCSC isoform structures.
Table 3 MMSEQ estimates forH13andMcts2isoforms in F1hybrid samples. MMSEQ estimates for each haplotype and isoform ofH13andMcts2of the initial and
reciprocal crosses are shown
Mother Father
CASTi C57r C57i CASTr
uc008nfz.1 1.26 1.63 9.61 9.17 uc008nga.1 1.29 3.58 7.68 7.51 uc008ngb.1 12.97 9.81 0.94 0.39 uc008ngc.1 13.63 10.51 1.10 1.08 uc008ngd.1 0.22 0.18 0.30 0.13 uc008nge.1 2.01 4.20 11.29 14.66
[image:12.595.57.291.583.682.2]the expression of transcripts on each of two X chromo-somes from human males in a pooled dataset, and that it can be successfully applied to detect genomic imprint-ing and cis-regulated transcripts in mouse hybrids. Our method retains reads that emanate from junctions as well as wholly within exons, models alignments to mul-tiple transcripts, potentially across genes, exploits insert size information in paired-end data to choose the best alignments and flexibly incorporates corrective models for non-uniform read sampling. The pipeline, the MMSEQ software and related documentation are freely available online [14].
Materials and methods Expectation maximization
We augment the data with the reads per region and transcript, Xit, where Σt Xit = ki and use the Poisson
approximation for the augmented data likelihood:
Xit ∼Pois bs M( i it t ). (6)
The distribution of the augmented data conditional on the observed data and the parameters is multinomial:
{ ,..., } { ,..., }, ~
, ,...,
X X k Mult
k M
M
M M
i in t t
i i it t t in n 1 1 1 1
∑
iit tt
∑
⎛ ⎝ ⎜ ⎜ ⎜ ⎞ ⎠ ⎟ ⎟ ⎟ (7) ⇒ = ′ ′ ′∑
( , ( )) . ( ) ( )X k k M
M
it i tp i it t p it t t p (8)
The derivative of the expected Poisson log likelihood overXgiven kandμ(p)with respect toμtis linear in X,
and hence
arg max
X k
p
p L X b M s
L X k b
,
( )
( )log ( ; , , , )
arg max log ( ; ( , ), ,
=
M
M s, ). (9)
The EM algorithm can be thus be expressed as repeat-edly updating the t( )p at each iterationpusing a form of the Poisson ML estimator in which theXithave been
substituted with (Xit kit,t( )p):
tp it
p i t X bl ( ) ( ) ,
+1 ←
∑
(10)where X bl bl k M M itp i t tp t i it
it tp t i ( ) ( ) ( ) ( ),
∑
∑
∑
= ′ ′ ′ (11)which converges to the ML estimate ofμt. To
initia-lize the algorithm, we set μ(0) equal to bl1 i M kM
t
it i t it
Σ′ ′
∑
,which is equivalent to distributing ki evenly between
cells of Xi where Mit is one. For a given region i, the
probability of reads being allocated to a given transcript depends only on the μtand not on si(as the region is
the same length on all transcripts). Hence, thesi do not
appear in the update steps.
Bayesian model and Gibbs sampling
As before, we use the augmented data reads per region and transcript,Xit. The full model is:
Xit t∼Pois bs M( i it t ), (12)
t∼Gam( , ). (13)
The full conditionals are:
{X ,...,X } { ,..., },k ~Mult k, M ,..., M
M M
i it t i i i it t t
in n
1 1 1 1
∑
iit t t ∑
⎛ ⎝ ⎜ ⎜ ⎜ ⎞ ⎠ ⎟ ⎟ ⎟, (14)t t mt it t
i
X X Gam X bl
{ 1 ,... } ~ ⎛ + , + .
⎝ ⎜ ⎜ ⎞ ⎠ ⎟ ⎟
∑
(15)Again, thesi are not needed as they are absent from
the full conditionals.
TopHat settings
Gapped alignment to the genome is performed with TopHat. We use a GFF file (specified with-G) based on the Ensembl annotation. We set –no-novel-juncs,
–min-isoform-fraction 0.0and–
min-anchor-length 3. The expected inner distance between mate
pairs is specified with the-rswitch.
SAMtools pileup settings
Bowtie settings
Alignment to the transcriptome with Bowtie is per-formed with the -a–bestswitches, which ensure all the best alignments in terms of mismatches are pro-duced. Additionally, we recommend using–stratato output only alignments with the minimum number of mismatches, although it currently has no effect on paired-end data. The minimum and maximum insert sizes should be set appropriately with the -I and -X switches respectively, as should –norc/–nofw for stranded protocols.
Additional material
Additional file 1: Gibbs traces of identical transcripts. Gibbs traces for two transcripts that have identical sequences, ENST00000436491 and ENST00000415119, and their sums. The individual transcript estimates exhibit high variability and anti-correlation, but the total expression level of the two transcripts can be well estimated.
Additional file 2: Poisson regression coefficients for three lanes in the HapMap dataset. Plots of the Poisson regression coefficients obtained using the method described in [8] from three lanes in the HapMap dataset. The first two plots are for two lanes of the same Illumina GAII run (3125_2 and 3125_7), while the last plot is for a lane in a separate run (3122_7). The coefficients are highly stable across both lanes and runs.
Additional file 3: Plots of adjusted transcript lengths. Scatterplot of log10 true vs. adjusted transcript lengths (top) and histogram of the log10 fold change in transcript length after adjustment (bottom). The adjustments are in general very slight.
Additional file 4: Transcript connectivity bar plot. Bar plot of the number of transcripts that each transcript is connected to via shared reads for human and mouse.
Additional file 5: MMSEQ vs. RSEM scatterplots. Normalized simulated expression vs. log ratio between simulated and estimated normalized expression for RSEM (left) and MMSEQ GS (right) (note the difference in the scales of the y-axes). The RSEM estimates tend to underestimate some low-to-medium expression values and set them very close to zero, which translates to large negative log ratios. This also applies to MMSEQ EM estimates. The posterior means estimated using MMSEQ Gibbs sampling are less biased except for a slight upwards bias for very lowly expressed transcripts.
Additional file 6: Quantile-quantile plots between pairs of lanes of the same individual and between pairs of lanes of different individuals. Quantile-quantile plots of transcript expression estimates between pairs of lanes in the HapMap dataset. The lane IDs are shown along the diagonal. The bottom-left triangle shows pair-wise comparisons for a single individual sequenced in seven lanes of the same run. The upper-right triangle shows pair-wise comparisons between different individuals all sequenced in different lanes. There is a striking contrast in the consistency of the distribution of high values between pairs in the two triangles.
Additional file 7: Log-base mean-variance correlation between technical and biological replicates. Scatterplots of log mean expression values against the log of the variance across technical and biological replicates at the transcript and gene levels. Each scatterplot has a line with a gradient of one if it shows technical replicates and two if it shows biological replicates. The variance is approximately
proportional to the mean for technical replicates and the square of the mean for biological replicates.
Additional file 8: Scatterplots of log expression estimates from individual and pooled data. Left: scatterplot of log expression estimates of male NA12045 vs. NA12872 obtained from individual datasets. Center: scatterplot of log expression estimates of male NA12045 obtained from
the individual vs. pooled data. Right: scatterplot of log expression estimates of male NA12872 obtained from the individual vs. pooled data.
Additional file 9: Reciprocal vs. initial cross, omitting transcripts on the X chromosome. Scatterplot of log fold changes between haplo-isoforms in the reciprocal (F1r) and the initial (F1i) cross, omitting
transcripts on the X chromosome.
Additional file 10: Reciprocal vs. initial cross, highlighting isoforms containing at least one significant SNP. Scatterplot of log fold changes between haplo-isoforms in the reciprocal (F1r) and the initial
(F1i) cross, highlighting in green circles and red crosses isoforms
containing at least one significant SNP imbalanced towards the paternal and maternal strain respectively. SNPs were called significant using ac2 goodness-of-fit test with aP-value threshold of 0.05 and are listed in [2]. Some transcripts contain significant SNPs with opposing imbalances, one example of which is clearly visible in the bottom-right quadrant.
Abbreviations
CEU: Utah residents with ancestry from northern and western Europe; EM: expectation maximization; GAII: Genome Analyzer II; GS: Gibbs sampling; Haplo-isoform: haplotype-specific isoform; MCSE: Monte Carlo standard errors; ML: maximum likelihood; PAR: pseudo-autosomal region; RPKM: reads per kilobase per million mapped reads; SNP: single nucleotide
polymorphism; UCSC: University of California: Santa Cruz.
Acknowledgements
This research was supported by BBSRC grant BBG0003521. We thank William Astle for constructive comments on the statistical model.
Author details
1Department of Epidemiology and Biostatistics, Imperial College London,
Norfolk Place, London, W2 1PG, UK.2Ernest Gallo Clinic and Research Center,
Department of Bioinformatics, University of California, San Francisco, 5858 Horton Street, Suite 200, Emeryville, CA 94608, USA.3European Bioinformatics Institute (EMBL-EBI), Wellcome Trust Genome Campus, Hinxton, Cambridge CB10 1SD, UK.
Authors’contributions
ET and AL developed the statistical model with the advice of SR and drafted the manuscript. ET implemented the MMSEQ software and ran validation experiments. SS and ET implemented the haplo-isoform pipeline and ran validation experiments. LC proposed and helped develop the EM algorithm and supervised the haplo-isoform validation experiment. AG proposed the application to mouse crosses and provided guidance on RNA-seq analysis. AG and ET applied the method to the mouse brain dataset. AL and SR supervised the project. AG, LC, SR and SS reviewed and revised the manuscript. All authors have read and approved the final manuscript.
Received: 19 September 2010 Revised: 17 November 2010 Accepted: 10 February 2011 Published: 10 February 2011
References
1. McManus CJ, Coolon JD, Duff MO, Eipper-Mains J, Graveley BR, Wittkopp PJ:
Regulatory divergence in Drosophila revealed by mRNA-seq.Genome Res
2010,20:816-825.
2. Gregg C, Zhang J, Weissbourd B, Luo S, Schroth GP, Haig D, Dulac C: High-resolution analysis of parent-of-origin allelic expression in the mouse
brain.Science2010,329:643-648.
3. Mortazavi A, Williams BA, McCue K, Schaeffer L, Wold B:Mapping and
quantifying mammalian transcriptomes by RNA-Seq.Nat Methods2008,
5:621-628.
4. Richard H, Schulz MH, Sultan M, Nürnberger A, Schrinner S, Balzereit D, Dagand E, Rasche A, Lehrach H, Vingron M, Haas SA, Yaspo ML:Prediction of alternative isoforms from exon expression levels in RNA-Seq
experiments.Nucleic Acids Res2010.
5. Jiang H, Wong WH:Statistical inferences for isoform expression in RNA-Seq.Bioinformatics2009,25:1026-1032.
6. Li B, Ruotti V, Stewart RM, Thomson JA, Dewey CN:RNA-Seq gene
expression estimation with read mapping uncertainty.Bioinformatics
7. Hansen KD, Brenner SE, Dudoit S:Biases in Illumina transcriptome
sequencing caused by random hexamer priming.Nucleic Acids Res2010,
38:e131.
8. Li J, Jiang H, Wong WH:Modeling non-uniformity in short-read rates in
RNA-Seq data.Genome Biol2010,11:R50.
9. Trapnell C, Williams BA, Pertea G, Mortazavi A, Kwan G, van Baren MJ, Salzberg SL, Wold BJ, Pachter L:Transcript assembly and quantification by RNA-Seq reveals unannotated transcripts and isoform switching during
cell differentiation.Nat Biotechnol2010,28:511-515.
10. Degner JF, Marioni JC, Pai AA, Pickrell JK, Nkadori E, Gilad Y, Pritchard JK:
Effect of read-mapping biases on detecting allele-specific expression
from RNA-sequencing data.Bioinformatics2009,25:3207-3212.
11. Heap GA, Yang JHM, Downes K, Healy BC, Hunt KA, Bockett N, Franke L, Dubois PC, Mein CA, Dobson RJ, Albert TJ, Rodesch MJ, Clayton DG, Todd JA, van Heel DA, Plagnol V:Genome-wide analysis of allelic expression imbalance in human primary cells by high-throughput
transcriptome resequencing.Hum Mol Genet2010,19:122-134.
12. Fontanillas P, Landry CR, Wittkopp PJ, Russ C, Gruber JD, Nusbaum C, Hartl DL:Key considerations for measuring allelic expression on a
genomic scale using high-throughput sequencing.Mol Ecol2010,
19(Suppl 1):212-227.
13. Novocraft.[http://novocraft.com].
14. Bayesian Gene eXpression.[http://bgx.org.uk].
15. Goncalves A, Tikhonov A, Brazma A, Kapushesky M:A pipeline for RNA-seq
data processing and quality assessment.Bioinformatics2011.
16. Montgomery SB, Sammeth M, Gutierrez-Arcelus M, Lach RP, Ingle C, Nisbett J, Guigo R, Dermitzakis ET:Transcriptome genetics using second
generation sequencing in a Caucasian population.Nature2010,
464:773-777.
17. Trapnell C, Pachter L, Salzberg SL:TopHat: discovering splice junctions
with RNA-Seq.Bioinformatics2009,25:1105-1111.
18. Li H, Handsaker B, Wysoker A, Fennell T, Ruan J, Homer N, Marth G, Abecasis G, Durbin R, 1000 Genome Project Data Processing Subgroup:The
sequence alignment/map format and SAMtools.Bioinformatics2009,
25:2078-2079.
19. Su SY, Asher JE, Jarvelin MR, Froguel P, Blakemore AIF, Balding DJ, Coin LJM:Inferring combined CNV/SNP haplotypes from genotype data. Bioinformatics2010,26:1437-1445.
20. Langmead B, Trapnell C, Pop M, Salzberg SL:Ultrafast and memory-efficient alignment of short DNA sequences to the human genome. Genome Biol2009,10:R25.
21. Anders S, Huber W:Differential expression analysis for sequence count
data.Genome Biol2010,11:R106.
22. Law AM:Confidence intervals in discrete event simulation: a comparison
of replication and batch means.Naval Res Logist Q1977,23:667-678.
23. UCSC Genome Browser.[http://genome.ucsc.edu].
24. Gregg C, Zhang J, Butler JE, Haig D, Dulac C:Sex-specific parent-of-origin
allelic expression in the mouse brain.Science2010,329:682-685.
25. Puck JM, Willard HF:X inactivation in females with X-linked disease.N Engl J Med1998,338:325-328.
doi:10.1186/gb-2011-12-2-r13
Cite this article as:Turroet al.:Haplotype and isoform specific expression estimation using multi-mapping RNA-seq reads.Genome Biology201112:R13.
Submit your next manuscript to BioMed Central and take full advantage of:
• Convenient online submission
• Thorough peer review
• No space constraints or color figure charges
• Immediate publication on acceptance
• Inclusion in PubMed, CAS, Scopus and Google Scholar
• Research which is freely available for redistribution


![Figure S9 of [2] for a SNP-by-SNP visualization of the](https://thumb-us.123doks.com/thumbv2/123dok_us/8659796.870226/11.595.57.292.426.633/figure-s-snp-snp-visualization.webp)

