R a ti n g pl a y e r s i n t e s t m a t c h
c ri c k e t
Ak h t ar, S, S c a rf, PA a n d R a s o ol, Z
h t t p :// dx. d oi.o r g / 1 0 . 1 0 5 7 /jo r s. 2 0 1 4 . 3 0
T i t l e
R a ti n g p l a y e r s in t e s t m a t c h c ri c k e t
A u t h o r s
Ak h t ar, S, S c a rf, PA a n d R a s o ol, Z
Typ e
Ar ticl e
U RL
T hi s v e r si o n is a v ail a bl e a t :
h t t p :// u sir. s alfo r d . a c . u k /i d/ e p ri n t/ 3 0 9 5 9 /
P u b l i s h e d D a t e
2 0 1 5
U S IR is a d i gi t al c oll e c ti o n of t h e r e s e a r c h o u t p u t of t h e U n iv e r si ty of S alfo r d .
W h e r e c o p y ri g h t p e r m i t s , f ull t e x t m a t e r i al h el d i n t h e r e p o si t o r y is m a d e
f r e ely a v ail a bl e o nli n e a n d c a n b e r e a d , d o w nl o a d e d a n d c o pi e d fo r n o
n-c o m m e r n-ci al p r iv a t e s t u d y o r r e s e a r n-c h p u r p o s e s . Pl e a s e n-c h e n-c k t h e m a n u s n-c ri p t
fo r a n y f u r t h e r c o p y ri g h t r e s t r i c ti o n s .
Rating players in test match cricket
Sohail Akhtar1*, Philip Scarf2and Zahid Rasool2
1University of Malakand, Malakand, Pakistan; and2University of Salford, Salford, UK
In general, the evaluation of player performance in test cricket is based on measures such as batting and bowling averages. These measures have a number of limitations, among which is that they fail to take into account the context in which runs are made or conceded and wickets are taken or given away. Furthermore, batting and bowling averages do not allow the comparison of performances in these two disciplines; this is because batting and bowling performances are measured using different metrics. With these issues in mind, we develop a new player rating system for test cricket. We use multinomial logistic regression to model match outcome probabilities session by session. We then use these probabilities to measure the overall contribution of players to the match outcome based on their individual batting, bowling and fielding contributions during each session. Our measure of con-tribution has the potential for rating players over time and for determining the‘best’player in a match, a series or a calendar year. We use results from 104 matches (2010–2012) to illustrate the method.
Journal of the Operational Research Societyadvance online publication, 30 April 2014; doi:10.1057/jors.2014.30
Keywords:ranking; rating; sport
The online version of this article is available Open Access
1. Introduction
Rating of teams and players is an important part of most sports. Ratings are used for the selection of teams and players for tournaments, and for seeding players and teams within tourna-ments (eg, Association of Tennis Professionals (ATP), 2012). They are of interest in their own right (eg, Castrol Football, 2012; FA Premier League (FAPL), 2012; Federation International of Football Association (FIFA), 2012). A rating is a numerical value allocated to each player or team based on their contributions, while a ranking is the ordinal position based on the ratings (Stefani, 2011). Broadly speaking, the rating of teams in team sports and the rating of individual players in individual sports is relatively straightforward and well developed (eg, Stefani, 1977; Elo, 1978; Harville, 1980). Recently, Stefani (2011) reviewed rating systems and discussed the three basic types of sport rating systems, namely, the subjective, objective and accumulative. Typically, objective rating systems use data on results to estimate competitors’strengths. Estimated strengths then directly provide a rating, and rankings can be established from these (eg, Koning, 2009). Many proprietary systems use a combination of the objective and subjective, with results forming the objective component, and the scaling of results according to other factors, such as the importance of a match or tournament, the subjective component (eg, ATP, 2012; FIFA, 2012). The rating of individual players in team sports is more challenging since individual contributions have to be
determined in the presence of a team effect and due to the fact that individuals may make different types of contributions according to their specialisms (McHaleet al, 2012). The rating of individual players in test cricket is the focus of this paper.
In test cricket, each team consists of 11 players, a combina-tion of batters and bowlers and a wicket keeper. The standard measures of batting and bowling averages have been used to assess player performance over many years. The Reliance ICC (2011) player rankings are the official ICC rankings, and therein are separate measures for batsmen, bowlers and all-rounders. All-rounders are players who bat and bowl to a frontline standard; all-rounders are rated using a combination of their batting and bowling averages. Interest in estimating measures of player performance in cricket goes back to Johnston et al (1993), who assessed player performance in 1-day cricket using dynamic programming. Beaudoin and Swartz (2003) proposed a new statistic for assessing players’ performances in 1-day cricket using the Duckworth/Lewis (D/L) methodology. Lewis (2005) calculates player performance in 1-day cricket. The author also uses the D/L methodology to evaluate players’ performances in relation to the runs expected for the stage of the innings and in relation to the resources that are consumed when batting, or contributed when bowling. Lewis (2008) extended this work to evaluate player performance over a longer term. However, test matches are different because in 1-day matches there is no notion of playing out the time remaining for a draw. Recently, Borooah and Mangan (2010) proposed new ways of computing test match batting averages to account for two deficiencies. First, they take account of a player’s career consistency. Second, they take account of a player’s batting
*Correspondence: Sohail Akhtar, Department of Statistics, University of Malakand, Lower Dir 25000, KPK, Pakistan.
E-mail: [email protected]
contribution relative to their team’s contribution (total). How-ever, fundamentally these adjustments do not consider the influence of a contribution on match outcome.
We propose a new rating system based on players’ perfor-mances (batting, bowling andfielding) during each session of a test match. (Note that each day of a 5-day test match is divided into three sessions: morning, afternoon and evening, each nominally 2 h in length.) There are advantages to looking at players’performances session by session. First, a session-by-session analysis can take account of the state of the batting and bowling conditions; thus, scoring runs on the first day in a match may be quite different from scoring runs on the fourth or
fifth day because test pitches deteriorate with the passage of time and batting becomes more difficult in the later stages of the match. Second, a session-by-session analysis can take account of the state of the match (pressure situation); thus, a player who scores 50 runs when his team score is 100 runs for 5 wickets may be making a more valuable contribution and should be rated more highly for this contribution than a player who scores 50 runs when his team score is 100 runs for 1 wicket. A similar argument may be put forward for bowlers and wicket-taking contributions. The system we develop also takes account of the wicket value, that is, whether a wicket of a recognized batsman or‘tail-ender’is taken. Furthermore, we propose a rating system that measures batting and bowling (andfielding) performances on the same scale. Then in principle the rating system can be used to choose the best player in a match or in a series (of matches), or to determine the new emerging player in a particular year, or the best player in a year, whether a batsman, a bowler, an all-rounder (a player who is a frontline batsman and a frontline bowler) or a wicket keeper. Best batting and best bowling performances over a period can also be determined. The system we propose has certain similarities to that
developed by Scarf and McHale (2005) and McHale et al (2012) for rating soccer players.
To illustrate the importance of different match contexts, consider the following example: the first test match between India and Australia at Chandigarh, India in 2010. The batting scorecard for this match is shown in Table 1. The match was very closely contested and India won by 1 wicket. Watson scored 126 runs in thefirst innings and 56 runs in the second innings. Tendulkar scored 98 runs and 38 runs in his two innings. These players scored the maximum number of runs for their respective sides during the match. However, it is difficult to determine how important these batting contributions were in the match from Table 1; this is because the state of the match at the time it was scored is not clear. The session-by-session scorecard (Table 2) shows that Watson and Tendulkar scored runs in relatively easy situations in the match. On the other hand, the most crucial and decisive period appears to be the last four sessions in which Laxman played a very important role, scoring 73 runs and arguably playing the decisive innings for his team in this match. Traditional measures of performance ignore the context of the match, and thus the Reliance ICC player ranking, which is based on traditional measures, does likewise.
[image:3.595.50.545.78.267.2]In order to take account of the match situation when runs are scored or wickets taken, we analyse the net contribution of players using a model of match outcome probabilities given the position at the end of each session that was proposed by Akhtar and Scarf (2012). This model was developed to predict match outcomes‘in-play’. It is similar in principle to those developed by Brookset al(2002), Scarf and Shi (2005), Scarf and Akhtar (2011) and Scarfet al(2011a). In particular, Brookset al(2002) use an ordered probit model to predict match outcome given the batting and bowling strengths at the start of a match, Scarf and Shi (2005) use logistic regression to predict match outcome
Table 1 Batting scorecard forfirst test, India against Australia in India in October 2010
Australia batting scorecard India batting scorecard
Players First innings Second innings Players First innings Second innings
SR Watson 126 56 G Gambhir 25 0
SM Katich 6 37 V Sehwag 59 17
RT Ponting‡ 71 4 R Dravid 77 13
MJ Clarke 14 4 I Sharma 18 31
MEK Hussey 17 28 SR Tendulkar 98 38
MJ North 0 10 SK Raina 86 0
TD Paine† 92 9 MS Dhoni‡,† 14 2
MG Johnson 47 3 Harbhajan Singh 0 2
NM Hauritz 9 9 Z Khan 6 10
BW Hilfenhaus 20* 6 VVS Laxman 2 73*
DE Bollinger 0 5* PP Ojha 0* 5*
Extras 26 21 Extras 20 25
Total 428 192 405 216
Wickets 10 10 10 9
*denotes a not-out innings. †wicket keeper.
given the end of third innings position, Scarf and Akhtar (2011) extend this latter work to the end offirst and second innings positions, and finally Scarfet al(2011a) consider declaration strategy using the third innings position model.
Using the session-by-session match outcome probabilities, we measure the effect of a contribution (runs scored or wickets taken during a session) on the match outcome probabilities; the greater the effect, the greater the value of the contribution and the more highly the contribution should be rated in the rating system. This principle of rewarding contributions by players in a team according to the effect of the contribution on the match outcome was essentially put forward in the development of the EA Sports Player Performance Index for soccer (McHaleet al, 2012). The novelty of our paper lies in implementing this principle in the context of a sport in which players make fundamentally different kinds of contributions. Early development of the work is described in Scarfet al(2011b) and Akhtar (2011).
The structure of the paper is as follows. The session-by-session prediction model is briefly described. We then describe how the prediction model is used to determine player contributions. We then compare different potential method measures of player contribution. Furthermore, we illustrate player rating with examples. Lastly, we introduce a weighted average rating scheme.
2. Measuring batting, bowling andfielding contributions
We use match outcome probabilities to measure the contribu-tions of players. The probabilities are predicted using a nominal multinomial logistic regressionfitted session by session to data on 146 test matches. Data were obtained from the ESPNcricinfo website (ESPN Cricinfo, 2010), and the complete data set of 146 matches relates to all the test matches in the period between November 2005 and March 2010, excluding those matches for which the session-by-session data were not available and in which more than 90 overs were lost to poor weather. Session-by-session information is not generally available before November 2005. The data were processed in order to obtain session-by-session information (eg, Table 2) for each match.
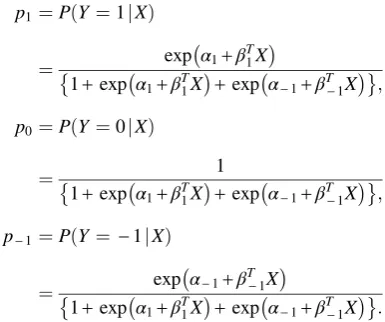
The nominal multinomial logistic regression model is as follows. With match outcome Y taking values (1, 0, −1) to denote a win, draw and loss, respectively, covariates denoted by X and taking a draw (0) as a reference category, the model
assumes Y has a multinomial distribution, that is, Y~MN (p1,p0,p−1; ∑pi=1), where p1, p0 and p−1 represent the
probability of a win, a draw and a loss, with
p1¼PðY ¼1jXÞ
¼ exp α1+βT1X
1+exp α1+βT1X
+exp α-1+βT-1X
;
p0¼PðY ¼0jXÞ
¼ 1
1+exp α1+βT1X
+exp α-1+βT-1X
;
p-1¼PðY ¼ -1jXÞ
¼ exp α-1+βT-1X
1+exp α1+βT1X
+exp α-1+βT-1X
:
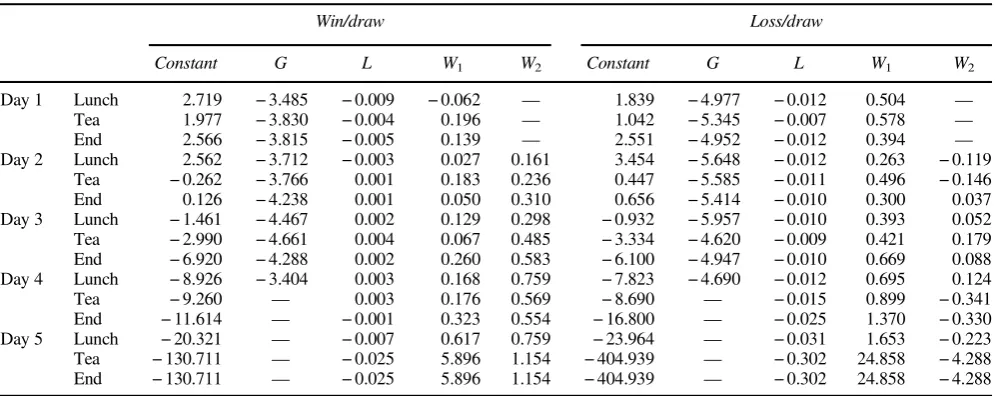
[image:4.595.305.544.231.415.2]A sequence of models with covariates lead, ground effect and total wickets lost for each team is obtained. These models are given in Table 3. The coefficients are shown in
Table 2 Session-by-session scorecard for match in Table 1
Day 1 Day 2 Day 3 Day 4 Day 5
Session At lunch At tea End At lunch At tea End At lunch At tea End At lunch At tea End At lunch At tea
Lead 101 179 224 295 390 318 237 148 23 123 188 160 53 −1
W1 1 3 5 6 8 10 10 10 10 13 16 20 20 20
W2 0 0 0 0 0 2 3 4 10 10 10 14 18 19
W1is Australia total wickets down at end of session andW2is India total wickets down at end of session.
Table 3 Bestfitting multinomial logistic regression model at each
stage, and showing NagelkerkeR2and number of matches used to estimate the model
Day Session Model Nagelkerke
R2(in percentage)
Number of matches
Day 1 At lunch G+L+W1 24.4 146
At tea G+L+W1 32.3 146
End of day G+L+W1 39.6 146
Day 2 At lunch G+L+W1+W2 44.0 146
At tea G+L+W1+W2 53.4 146
End of day G+L+W1+W2 56.7 146
Day 3 At lunch G+L+W1+W2 60.7 146
At tea G+L+W1+W2 66.5 146
End of day G+L+W1+W2 72.7 143
Day 4 At lunch G+L+W1+W2 74.8 131
At tea L+W1+W2 74.2 122
End of day L+W1+W2 80.5 111
Day 5 At lunch L+W1+W2 84.0 91
[image:4.595.328.521.512.673.2]Table 4. There are two points to note here. First, the win–draw comparison and the loss–draw comparison depend on the covariates in different ways—this is a property of nominal as opposed to ordinal multinomial logistic regres-sion. Second, the wickets covariate is transformed to wicket resources before fitting—this allows the value of the tenth wicket, for example, to be less than that of thefirst wicket in the wickets-lost effect. The models of Akhtar and Scarf (2012) included further covariates: pre-match team strengths and home advantage. We do not use these here because our view is that the worth of the player should be based on the current performance. Finally, note that the number of matches available for model fitting for later sessions decreases because not all matches last the full 5 days.
Using these models, we can predict the match outcome probabilities (win, draw and loss) given the match position at the end of each sessiont(t=1, 2, 3…15). These are given by
PAtð Þ ¼y Pt Y¼yjL¼lt;W1¼w1;t;W2¼w2;t
(1)
wherePtAdenotes the probabilities at the end of sessiont,and
W1,W2andLare, respectively, the total wickets down of the
reference team, the total wickets down of the opponent team and the lead of the reference team. The reference team batfirst in the match. The actual match position at the end of sessiontis (L=lt,W1,=w1,t,W2=w2,t).
Next, to measure performance session by session, we define hypothetical positions for the batting team and for the bowling team. For the batting team, we define a hypothetical position at (the end of) session tin which batsmen have not scored any runs in sessiont, and obtain match outcome probabilities given the hypothetical position:
PHt;batð Þ ¼y Pt Y¼yjL¼lt-1;W1¼w1;t;W2¼w2;t
: (2)
Thus, the hypothetical position for the batting side at the end of sessiontis (L=lt−1,W1,=w1,t,W2=w2,t); if the batters score
nothing in the session then their lead does not increase and remains atlt−1, which is the lead at the end of the previous
sessiont−1.
Similarly for the bowling side, we define a hypothetical position at the end of sessiontin which bowlers have not taken any wickets in sessiontand obtain match outcome probabilities given the hypothetical position
PHt;bowlð Þ ¼y Pt Y¼yjL¼lt;W1¼w1;t-1;W2¼w2;t-1
: (3)
Thus, the hypothetical position for the bowling team in sessiont is (L=lt,W1=w1,t−1,W2=w2,t−1). In this way, if
the bowling team take no wickets in the session then the wickets down for the other team remains atwt−1. Of course, the wickets
down for the bowling team remains unchanged during the session.
At the end of each session, to assess the worth of players’ contributions, we use the difference between the hypothetical match outcome probabilities and the actual match outcome probabilities. These differences, for batters and for bowlers, are our measures of total player contribution during the session. The probability difference (total contribution) is then awarded to a batter according to his share of the runs scored in the session, and to a bowler according to his share of wickets taken in the session. For bowling contributions, however, a share is also given to fielders. The details of these procedures are given below.
[image:5.595.48.546.87.285.2]However, matters are not straightforward. This is because we can look at probabilities in relation to alternative outcomes: winning, drawing or at least one of these, or equivalently, not losing. Hence, we can calculate in the manner described above the value of a contribution to winning or the value of a contribution to not losing. Different situations have been
Table 4 Thefitted parameter estimates for each session of the match with covariates lead (L), total wickets down by reference team (W1), total
wickets down opposing team (W2) and ground effect (G)
Win/draw Loss/draw
Constant G L W1 W2 Constant G L W1 W2
Day 1 Lunch 2.719 −3.485 −0.009 −0.062 — 1.839 −4.977 −0.012 0.504 —
Tea 1.977 −3.830 −0.004 0.196 — 1.042 −5.345 −0.007 0.578 —
End 2.566 −3.815 −0.005 0.139 — 2.551 −4.952 −0.012 0.394 —
Day 2 Lunch 2.562 −3.712 −0.003 0.027 0.161 3.454 −5.648 −0.012 0.263 −0.119 Tea −0.262 −3.766 0.001 0.183 0.236 0.447 −5.585 −0.011 0.496 −0.146 End 0.126 −4.238 0.001 0.050 0.310 0.656 −5.414 −0.010 0.300 0.037 Day 3 Lunch −1.461 −4.467 0.002 0.129 0.298 −0.932 −5.957 −0.010 0.393 0.052 Tea −2.990 −4.661 0.004 0.067 0.485 −3.334 −4.620 −0.009 0.421 0.179 End −6.920 −4.288 0.002 0.260 0.583 −6.100 −4.947 −0.010 0.669 0.088 Day 4 Lunch −8.926 −3.404 0.003 0.168 0.759 −7.823 −4.690 −0.012 0.695 0.124
Tea −9.260 — 0.003 0.176 0.569 −8.690 — −0.015 0.899 −0.341
investigated, and we propose one criterion for batters and another for bowlers. For batters, we look at probability differences with respect to‘not losing’and at bowlers with respect to winning. We believe that looking at not losing is a reasonable approach to rate the batters in test cricket. This is because batting teams act conservatively and early in a game will aim to bat towards a position from which they cannot lose. Even later in a game, a team will bat for a win only if a target or a lead is moderate; otherwise they play for a draw. On the other hand, bowlers and
fielders predominantly play for a win—the notion of bowlers and
fielders playing for a draw does not really exist, despite the fact thatfields might be set to be defensive. The numerical results considered later in Section 4 (Figure 1) provide a further justification of these choices of criteria. Alternatively, one might use an expected ‘points’ gained criterion for both batters and wicket takers that assumes 1 point for a win and 2 points for a draw.
The value of a player’s contribution is computed at the end of each session in the following way. Defining the event {win} that the match outcome is a win for the reference side, and likewise for {lose}, and {not lose}={win∪draw},
the batting and bowling contributions of all players in session tare
Ct;bat¼PAtðfnot losegÞ-PHt;batðfnot losegÞ
Ct;bowl¼PAtðfwingÞ-P H
t;bowlðfwingÞ:
The value of an individual player’s batting contribution is
Ci;t;bat¼Ct;bat´ ri;t
rt :
whereri,tis the runs scored by playeriin sessiontandrtis the
total runs scored by his team in sessiont.
For wickets taken, we proceed in the same way in principle to runs scored, sharing the total points among those who take wickets. However, we make allowances forfielding contribu-tions (catches, run-outs and stumpings), and award a share of the points for a wicket to the fielder if indeed a fielder contributed. The choice of the number to express such a share for catches and stumpings is arbitrary. We suppose there are j=1,…,n types of wicket-taking contribution, each of which has shareαjof the points. Thus,j=1 corresponds to a wicket 350 300 250 200 150 100 50 0 1.0 0.9 0.8 0.7 0.6 0.5 0.4 0.3 0.2 0.1 0.0 -0.1 -0.2 total score batting points (not lose) -1-1-1-1-1 -1
-1 -1 -1
-1 -1 1 1 11
1 1 1 1 1 1 1 1111 1 1 1 1
1 1
1 -1111111-1-1-1 -1 -1-1-1-1-1-1 1
1 1 1 1 -1-1-1 -1 -1 -1 -1 -1 -1-1 -1 -1
-1-1-1-1-1-1-1 -1 -1 -1 1 1 1 1 1 1 1 1 11 1 1 1 1 111 1 1 1 1 1-1-1 -1 -1 -1 -1 -1 -1 -1 -1 -1 0 0 0 0 0 0 0 0 0 0 0 00 0
0 0 0 0 0 0 0 0 00
00000 00 0 0 00 0000
0
0
0
0 0
0 000 000000 000 00 0 0
0 0 0 0 0 1
1111 1 1 1
1 11 -1 -1 -1-1 -1-1 -1 -1 -1 -1-1 0
00 0 000 00 0 0 000
000 0 000
0
00 0 0 000
0 0 0 0 0000
0 0 0 0 0 00 0 0 0 0 00 0 0 0 0 0 0 000 0 0 0 0 0 0 0
00 000 0 00 0 0 000 0
0 0 0 0 0 0 0 0 1 111 11 1 1 1 1 1 -1 -1 -1 -1 -1 -1 -1 -1 -1 -1 -1 -1 1 1 1
1 1 1
1 1
1 1 1 -1-1-1 -1
-1 -1 -1 -1 -1 -1 -1 -1-1 -1 -1-111-1-1-1-1-1 -1
1 1 1 1 1 1 1 11 1 111
1 1 1 1 11 1 -1-1 -1 -1 -1 -1 -1 -1 -1 -1 -1 -1 -1 -1-1-1-1-1
-1 -1 -1 -1 1 1 1 1 1 1 1 11 11 11 1 1 1 1 1 1 1 1 1 -1 -1 -1 -1 -1 -1 -1 -1 -1 -1 -1
-11-1 -11-1-1-11-1-1-1-1 -1 1 1 1 1 1 1 1 1 000
000 0 0 0 0 0 0
0 0 0 0
0 0 0
0
0 0
1 1 1 1
1 11 1
1
1 1
-1-1-1
-1 -1 -1 -1 -1 -1 -1-1 -1-1 -1 -1-1 -1
-1 -1 -1
-1
-1
11 1 1 1 1 1
1 1
1
1 -1 -1-1 -1-1-1-1-1
-1 -1 -1 1 1 1 1 1 1 1 1 1 1 1 1 111 1 1 1 1 11 1 -1 -1 -1 -1 -1 -1 -1 -1 -1 -1 -1 -1-1-1-1-1-1-1-1-1
-1 -1 1 1 1 1 1 1 1 1
1 1 1
-1-1-1 -1-1-1-1 -1-1 -1 -1 1 1 1 1
1 1 1 1 1
1
1
-1-1-1 -1 -1 -1 -1 -1
-1 -1 -1 1 1 1 11 1 1 1 1 1 1 1 1
11 1 1 1
1 1
1 -11 -1 -1 -1-1-1-1-1
-1 -1
-1 -1
-1 -1 -1 -1-1 -1 -1
-1 -1 -1 -1 -1 -1 -1-1 -1 -1 -1 -1 -1 -1 1 1
1111 1 1 1 1
1
-1-1-1-1 -1-1-1-1-1 -1-1-1-1 -1 -1 -1-1 -1
-1
-1 -1
1 1111 1
1 1 1 1 1 00 0 0 0 0 0 0 0 0 0 00 0 0 0 0 0 0 0 0 0
-1 -1-1-1-1 -1 -1 -1 -1 -1 -1 1 1 1 1 1 1 1 1 1 1 1 1 1 1 1 1
1 1 11 1 1 -1 -1 -1 -1 -1 -1 -1 -1 -1 -1 -1 0 0 0 0 0 0 0 0 0 0 0 0 0 0 0 0 0 0 0 0 0 0 -1 -1-1 -1 -1 -1 -1-1 -1 -1 -1 1 111 1 1 1 1 1 1 1 -1 -1 -1 -1 -1 -1 -1 -1 -1 -1-11 1 1 1 1 1 1 1 1 1 1 1 1
1 1 1
11 1 1 1 1 -1 -1 -1 -1 -1 -1 -1 -1-1 0 000 0
0 0 0 0 0 0 00 0 0 0 0 0 0 0 0 0 0 0 0
0 0 0 0
0 0 0 00 0 0 0 0 00 0 0 0 0 -1 -1-1-1 -1 -1 -1-1 -1 -1 -1 1 1 1 1 1 1 1 1 1 1 1 0 0 0 0 0 0 0 0 0 0 0 0 0000
0 0 0 0 0 0 0 000
0 0 0 0 0 0 0 00 0 0 0 0 0 0 0 0 0 -1 -1-1-1 -1
-1 -1 -1 -1 -1-1 11 1 1 1 1 1 1 1 1 1 -1-1 -1-1 -1 -1 -1 -1 -1 -1 -11 1 1 1 1 1 1 1 11 1 1 1
1111 1 1 1
1 1
-1 -1 -1 -1
-1 -1 -1 -1-1
-11-1-1-1-1-1 -1 -1-1 - -1 -1 -1 1 1 11111 1 1 1 1 -1-1-1-1
-1 -1 -1 -1 -1 -1 -1 1 1 1 11 1 1 1 1 1 1 0 00 00 0 0 0 0 0 0 0 000 0 00
0
0
0 0
0 00 0 0
0 0 0 0 0 0 0 000 0 0 0 0 0 0 0 0 0 0 0 00 0 0
0 0 0 0 0 0 0 0 00 0 0 0 11 1 1 1 1 1 1 1 1 1 -1 -1 -1 -1 -1 -1 -1-1 -1 -1 -1
000000
0 0 0 0 0 0 0 0 0 0 0 0 0 0 0 0 11 1 1 1 1 1 11 1 1 -1-1 -1 -1 -1 -1 -1 -1 -1 -1 -1 1
1 111 1 11
1 1 1 -1 -1 -1 -1 -1 -1 -1 -1
-1-1 -1 -1-1-1
-1-1-1-1 -1-1-1 -1 -1 1 11 1 1 1 1 1 1 1 1 111 1 1 1 1 1 1 1 1 -1-1 -1 -1 -1 -1 -1 -1 -1 -1 -1 000 0 0 0 0 0 0 0 0 00 0 0 0 0 0 0 0 0 0 1 1 1 1 1 1 1 1 1 1 1 -1 -1 -1 -1 -1-1 -1 -1-1-1-1 -1 -1 -1 -1 -1 -1-1 -1-1-1
-1
1111 1 1 1 1 11 11 1 1 1 1 1 1 1 1 1 1 -1-1-1-1 -1-1-1 -1 -1 -1-1-1-1
-1 -1 -1 -1-1 -1 -1 -1 -1 1 1 1 1 1 1 1 1 1 1 1 -1-1 -1-1 -1 -1
-1 -1 -1 -1-1 11 1 1 1 1 1 1 1 1 1 1 1 1 1 1 1 1 1
111
-1-1-1-111111 -1 -1-1-1-1-1-1-1-1-1-1-1-1 -1-1-1 -1-1 1
1 1
1
1 1
1 11 1 11111
1
1 -1
-1 -1 -1-1
-1 -1 -1 -1 -1 -1 1 1 11 1 1 1 1 1 1 1 -1 -1 -1 -1
-1 -1 -1
-1-1 -1 -1 -1-1-1 -1-1
-1 -1
-1 -1-1 -1 1
11 11 1
1 1
1 1 1 -1 -1 -1 -1 -1 -1 -1 -1 -1-1 -1 1
11 11 1
1 1
1 1 1 -1-1-1
-1 -1 -1 -1 -1 -1 -1 -1
1111 1
1 1
1
1
1 1 -1-1-1-1-1 -1-1-1
-1
-1 -1
11111 1 1 1 1 1 1 0 0 0 00 0 0 0 0 00 000 00 0 0 0 0 0 0 1 1 1 1 1 1
11 1 1 1
-1 -1 -1 -1 -1 -1 -1 -1-1 -1 -1 000 0 00 0 0000 000
00 0 0
0 0
0
0 -1-1 -1-1 -1 -1 -1 -1 -1 -1 -1 1 1 1 1 1 1 1 1 1 1 1 1 11111 1
1 1 1 1 -1 -1 -1 -1 -1 -1 -1 -1 -1 -1 -10 0 0
0 0 0
0 0 0 0 0
0 0
0000
0 0 0 0 0 0 000 0
0 0 0
0 0 0 0 00
0 0 0 0 00 0 0 -1-1 -1 -1-1 -1
-1 -1 -1 -1 -1 1 1 1 1 1 1 1 1 1 1 1 11 1 1 11
1 1 1 1 1 -1 -1 -1 -1 -1 -1 -1 -1 -1 -1 -1 11 1 1 1 1 1 1 1 1 1 -1-1-1 -1 -1 -1 -1 -1 -1 -1 -1 0 0 0 0
0000000 00000 00 0 00 0
-1
-1-1-1-1 -1-1-1 -1 -1 -1 1 1 1 1 1 1 1 1 1 1 1 00 0000 00 0 0 0 0 0
0000 0 0
0 0 0 00 0 0 0
0 0 0
0
0 0
0000 0 0 0 0 0 0 0 1 1 1 1 1 1 1 1 1 1 1
-1-1-1-1
-1 -1 -1 -1 -1 -1 -1 111 1 1 1 1 1 1 1 1 -1 -1 -1 -1 -1 -1 -1 -1 -1 -1 -1 1 1 1 1 1 1 1 1 1 1 1 -1-1-1-1-1
-1 -1 -1 -1
-1 -1
0 00 0 0 00 0 0
0
0
0 00 0 0 0 0 0 0 0 0 -1-1 -1 -1 -1 -1 -1 -1 -1 -1-1 1 11 1 1 1 1 1 1 1 1 -1-1 -1-1-1-1-1 -1
-1 -1 -1 1 1 1 1 1 1 1 1 1 1 1 1 1 1 1 1 1 1 1 1 1 1 -1 -1-1 -1 -1 -1 -1 -1 -1 -1 -1 0 0 0 000 0
000 0
0
00 000 0
0 0 0
0 -1-1-1
-1 -1-1-1
-1 -1 -1
-1 1
111 1 1 1 1 1 1 1 111 1
1
1
1
11-1-1-1 -11-1 1 -1 -1 -1 -1 -1 -1 0 0 0 0 0 0 0 0 0 00 0 0 0 0 0 0 0 0 0 1 1 11 1 1 1 1 1 1 1 -1-1 -1 -1 -1 -1-1-1
-1
-1 -1 -1 -1 -1-1
-1 -1
-1-1-1 -1 1 111 1 1 1 1 1 1 1 -1 -1 -1 -1 -1 -1 -11 -1-1-1 -1 1 1 1 1 1 1 1 1 1 1 1 111 111 1
1 1
1
-1-1-1 -1 -1 -1 -1 -1 -1 -1 -1 00 00 0
00 0 0 0 0 00 0 0 0 0 0 0 0 0 0 1 1
11 11 111 1 1
-1-1-1-1-1-1-1-1-1-1-1-1-1 -1 -1 -1 -1 -11111-1 -1-1 -1
1 1 1 1 1 1 1 12 10 8 6 4 2 0 1.0 0.9 0.8 0.7 0.6 0.5 0.4 0.3 0.2 0.1 0.0 -0.1 -0.2 wickets share total wic k
ets-taking points (not lose)
-1 -1
-1 -1 -1 -1 -1 -1 -1 -1 -1 1 1 1 1 1 1 1 1 11 1 1 1 1 1 1 1 1 1
1 11-1 -1
-1 -1 -1 -1-1-1 -1 -1-1 1 1 1 1 1 1 11 1 1 1 -1-1 -1 -1 -1 -1 -1 -1 -1-1 -1 -1 -1 -1 -1 -1 -1 -1 -1 -1-1-1 11 1 1 1 1 1 1111 1
1 1
1 1
1 11111 -1 -1-1 -1 -1 -1 -1-1 -1 -1 -1 0 0 0 0 0 0 00 0 0 0 00 0 0 0 0 0 0 0 0 0 0 0 0 0 00 0 0 0 0
0 000 0 00
00 0 0 0 0 0 0 0 0 0 0 0 0 0 0
0 0 0 0
00 00 0 00 1 1 1 1 1 1 1 1
1-1-11 -1-1-11 -1 -1 -1-1-1
-10
0 00 0
000 0
0 0
0 0 0 0
00 0 000 0
0
0 0 0
0 000 0 0
0 0 0
0 0
000 00 0 0 0 0 0 0 0 0 0 0 0 0 00 0
0 0 00 00 0 0 0 0 0 0 0 0 00 0
0 0 0 00 0 0 0 0 0 0 0 0 01 1 1 1 1 1 1 1 11 1 -1 -1 -1 -1 -1 -1 -1 -1-1 -1 -11 -1 1
1 1 1 1 1 1 1 1 1 -1 -1 -1 -1 -1 -1 -1-1 -1 -1 -1 -1 -1 -1 -1 -1 -1 -1 -1
-1-11 1
-1111111 11 1 1 1 1 1 1 1 1 1 1 1 1 -1 -1 -1 -1 -1 -1 -1 -1 -1 -1 -1 -1 -1 -1 -1 -1 -1 -1 -1 -1-1 -1 1
1
1 1 1
1 1 1 1
1 1 1
1 1 1 1 1 1 1 1 1 1 -1 -1 -1
-1 -1 -1-1 -1 -1 -1
-1-1-1 -1-1 -1 -1-1 -1 -1-1-1 1 1 1 1 11 1 1 1 1 1 0
0 0 0 0 0 0
0 0 0 0
0 0 0 000 0 0 00 0 1 1 1 1 1 1 1 1 1 1 1 -1 -1 -1 -1 -1 -1 -1 -1 -1 -1 -1 -1 -1 -1 -1-1 -1-1 -1 -1 -1
-111111111 1 -1 -1 -11 1 -1 -1 -1 -1 -1 -1 -1 -1 1 1 1 1 1 1 1 11 1 1 1 1 1 1 1 1 1 1 1 1 1 -1-1
-1 -1 -1 -1 -1 -1 -1-1-1-1-1
-1 -1 -1 -1
-1 -1-1-1 -1
1 1 1 1 1 1 1 1 1 1 1 -1 -1 -1 -1 -1 -1 -1 -1 -1-1 -1
1 1 1 1 1 1 1 1 1 1 1 -1 -1 -1 -1-1 -1 -1-1 -1 -1 -1 1 1 1 1 1 1 1 1 1 1
111 1 1 1 1 1 1
1 1 1 -1 -1 -1-1-1-1-1-1 -1 -1 -1 -1 -1 -1 -1 -1 -1-1 -1 -1 -1
-1-1-1-1-1 -1 -1 -1 -1 -1-1 -1
1
1 1
1 1 1 1
1 1 1-1-11 -1 -1 -1 -1-1 -1-1 -1-1 -1 -1 -1 -1 -1 -1 -1 -1 -1
-11-111 111 111 10 1 0 0 0 0 0 0 0 000 0
0 0 0 0 0 0 0 0 0 -1 -1 -1 -1 -1 -1 -1-1 -1 -1-1 1 1 1 1 1 111 1 1
1 1 1 1 1
1 1 1 1 1 1 1 -1 -1 -1 -1 -1 -1 -1 -1 -1 -1-1 0 0 0 0 0 0000
0 0 0 0 0 0 0 0 0 000
-1 -1 -1 -1 -1 -1 -1 -1 -1 -1 -1 1 1 1 1 1 1 1 1 1 11 -1 -1 -1 -1 -1
-1 -1-1 -1 -1-1 1 1 1 1 1 1 1 1 1 1 1 1 1 1 1 1 1 1 1
1 1 -1 -1 -1 -1-1 -1 -1 -1 -1 -1 -1 0 0 0 0 0 0 0 0 00 0
0 0 0 0 0 0 0 0 0 0 0 0
000 0
0
0 0 0 0 0 0
0 0 0 0 0 0 0 0 0 0 -1 -1 -1 -1 -1 -1 -1-1-1-1 -1 1 1 1 1 1 1 1 1 111
0 0 0 0 0 0 0 0 0 0 0 0 0 0 0 0 0 0 000 0 0 0 0 0 0 0 0 0 0 00 0 0 0 0 0 0 0 0 0 0 0 -1 -1 -1 -1 -1 -1 -1 -1 -1-1
-111111 1 1 1 1 1 1 -1 -1 -1 -1 -1 -1 -1 -1-1-1 -1 1 1 1 1 1 1 1 1 1 11
1 1 1 1 1 1 11 1 11 -1
-1 -1 -1 -1-1 -1-1 -1-1 -1 -1 -1 -1 -1 -1-1
-1 -1-1
-1-11111111 1 11 1 -1 -1 -1 -1 -1 -1 -1 -1 -1 -1 -1 1 1 1 1 1 11 11 1 1 0 0 0 0 0 0 0 0 0 0 00 0
0 0 0 000 0 0 0 0 0 0 0 0 0 0 0 0 0 0 0 0 0 0 000 0 0 0 0 0 0 0 0 00 0 0 0 0 0
00 0 0 0 00 0 0 1 1 1 1 1 1 1 1 1 1 1 -1 -1 -1
-1 -1 -1 -1 -1 -1 -1 -1 0 0 0 0 0 0 00 0 0
0
0 0 0000000 0 0
1 1 1 1 1 1 1 1 1 11
-1 -1 -1 -1 -1 -1 -1 -1-1 -1 -11 1 1 1 1 1 1 1 1 1 1 -1 -1 -1 -1 -1 -1 -1-1-1 -1 -1 -1 -1 -1 -1 -1 -1 -1 -1
-1 -1-1-1 1 11 1
11 1 1111
1 1 1 1 1 1 1 1 1 1 1 -1 -1 -1 -1 -1 -1 -1 -1 -1 -1 0 0 0 0 0 0 00 0 0 0 0 0 0 0 0 0 00 0 0 0 1 1 1 1 1 1 1 1 1 1 1 -1 -1 -1 -1 -1 -1 -1 -1 -1-1 -1 -1 -1 -1 -1 -1 -1 -1 -1 -1-1 -1 1 1 1 1 1 11 1 1 1 1 1 1
1 1 1 1 1 1 1 1 1-1 -1 -1
-1 -1 -1 -1 -1 -1-1 -1
-1 -1 -1 -1 -1-1 -1 -1 -1 -1 -1 1 1 1 1 1 1 11 1 1 1 -1 -1 -1 -1 -1 -1 -1-1 -1 -1 -1 1 1 1 1 1 1 1 1
1 1 11
1 1 1 1 1 1 1 1 1 1 -1 -1 -1 -1 -1 -1-1-1 -1 -1 -1 -1 -1 -1 -1 -1-1 -1 -1 -1-1
-111111 1 1 1 11 1 1
1 1
1
1 1 11 1 1 1 -1 -1 -1 -1 -1 -1 -1 -1 -1-1 -1
1 1 1 1 1 1 1 1 1 1 1 -1 -1 -1 -1 -1 -1 -1 -1-1 -1 -1 -1 -1 -1 -1 -1 -1-1-1 -1 -1 -1 1 1 1 1 1 1 11111
-1 -1
-1 -1 -1
-1-1-1 -1 -1 -1 1 1 1 1 1 1 11111
-1 -1 -1 -1 -1 -1 -1 -1 -1 -11-1
1 1 1 1 1 1 1 1 1 1 -1 -1 -1 -1 -1 -1 -1-1 -11-1-1
1 1 1 1 1 1 1 11 1 0 0 0 0
0000 0 0 0 0 0 0 0 0 00 0 0 0
0 1 1
1
1 1 1 11
1
1 1 -1 -1 -1 -1 -1 -1 -1 -1 -1 -1
-10 000000000000000 000 0 0 0 -1 -1 -1 -1 -1 -1 -1-1 -1 -1 -1 1 1 1 1 1 11 1 1 1 1 1 1 1 1 1 1 1 11 1
-1-1 -1-1 -1 -1 -1 -1 -1 -1 -10 0 0 0 0 0 0
0 0 0
0 0 0
0 0 0 0 0 0 0 0 0 0 0 0 0 0 0
0000 0
0 0 0 0 0 0 0 0 0 0 0 -1 -1 -1 -1 -1 -1 -1 -1 -1-1 -1 1 1 1 1 1
111 1
1 1 1 1 1 111 1 1 1 1 1 -1 -1 -1 -1 -1 -1 -1 -1-1-1 -1 1 1 1 1 1 1 1 11 1 1
-1
-1 -1 -1 -1 -1 -1
-1 -1 -1
-1 0000000000000000-100 0 -100 0 -1 -1 -1 -1 -1 -1 -1-1 -1
1 11 1
1 11 11 11 0 0 0 0 0 0 0 0 0 0 0 0 000 0 0 0 000 0 0 0 0 0 0 0 0 0 0
0 0 0 00
0 0 0 00
0 00 1
1 1 1
1
1 1 1 11 1 -1 -1 -1 -1 -1 -1 -1 -1 -1 -1 -1 1 1 1 1 1 1 1 1111
-1 -1 -1 -1 -1 -1 -1 -1 -1 -1 -1 1 1 1 1 1 1 1 1 1 11 -1 -1 -1-1 -1 -1 -1 -1
-10-1000-1 00 0
0 00 000 0 000 0 0 0 -1 -1 -1 -1 -1 -1 -1 -1 -1-1-1 1
1 1 1
11 11 1 1 1 -1
-1 -1 -1 -1 -1 -1 -1 -1 -1 -1 1 1 1 1 1 1 1 1 11 1
1 1 1 1 1 1 1 1 1 11
-1 -1
-1
-1
-1 -1-1-1 -1 -1 -1 0 0 0 0 0 0 00 0 0 00 0 0 0 0 00 0 0 0 -1 -1 -1-1 -1 -1-1-1 -1 -1
-11111111 1 1 1 1 1 1 1 1 1 1 1 1 1 1 1 -1 -1 -1 -1 -1 -1 -1 -1 -1-10-1
0 0 0 0 0 0 0 0 0 0 0 0
0 000 00 0 0 0
1
1
1
1111 111 1
-1
-1 -1 -1-1 -1 -1 -1-1-1-1
-1 -1 -1 -1 -1 -1-1 -1 -1 -1 -1 1 1 1 1 1 1 11 1 1 1 -1 -1 -1 -1 -1 -1 -1 -1 -1 -1 -1 1 1 1 1 1 11 1 1 1 1
1 1 1 1 1 1 1 1 1
1 1-1-1-1 -1-1 -1 -1 -1 -1 -1 -1 0 0 0 0 0 0 0 0 0 0 0 0 0 0 0 0 0 0 0 0 0 0 1 1 1 1 1 1 1 1 1 1-11 -1 -1-1-1 -1 -1 -1-1 -1 -1 -1-1 -1
-1
-1 -1 -1 -1-1-1
-111111 11 1 11 1
350 300 250 200 150 100 50 0 1.0 0.9 0.8 0.7 0.6 0.5 0.4 0.3 0.2 0.1 0.0 -0.1 -0.2 total score batting points (win) -1
-1 -1 -1 -1 -1 -1 -1 -1 -1 -1 1
111 1 1 1 1 11 1
111 1 1
11 1 1 1 1
-1-1-1 -1-1-1 -1 -1 -1-1 -1 1 1 1 1 1 1 1 1 1 1 1 -1-1-1
-1 -1
-1-1 -1-1 -1 -1 -1
-1-1 -1-1 -1 -1 -1 -1 -1 -1 1 1 1 1 1 1 1 1
11 1
1 1 1 1 1 1 1 1 1 1 1-1-1 -1 -1 -1-1 -1 -1 -1-1 -1 0 0 0 0 0 0 0 0 0 0 0
00 0
00 0
0 0 0 0 0 00
000000 00 0 00 0000
0 0
0 0 0
0000 00
0 0 0 0 0 0 0 0 0 0 0 0 0 0 0 0 1 1 1 1
1
1 1 1
1
11
-1-1-1-1-1 -1 -1 -1 -1 -1-1 0
0000 000 00 0 000
000 0 0
0 0 00 0 0 00
0 0 0 0 0 00 0 0 0 0
0 00
0 0 0 0 0 0 0 0 0 0 0 0 0 0 0000 0 0 0 0 0 0 00000 0 00 0 0
000 0
00 0
0 0 0 0 1 111 11 1 1 1 1 1 -1 -1-1-1 -1
-1 -1 -1 -1 -1 -1 -1 1 1 1 1 1 1 1 1 1 1 1
-1-1-1-1-1 -1-1 -1
-1 -1
-1 -1-1
-1-1-1111 11111-1-1-1-1-11111-11 1 1 1 1 1 1 1 1 1 -1 -1 -1 -1 -1 -1
-1 -1 -1
-1 -1
-1 -1
-1-1 -1-1 -1 -1 -1 -1 -1 11 1 11 1
1 11 11 11 1 1 1 1 1 1 1 1 1
-1-1-1 -1 -1
-1-1 -1
-1 -1 -1 -1 -1 -1 -1 -1 -1 -1 -1-1-1
-1
111 1 1
1 1 1 1 1 1 000
0 0 0 0
0
0 0 0
0 0 0 0 0 0 0 0 0 0 1 1 1 1 111 11
1 1
-1-1-1 -1 -1 -1
-1-1-1 -1 -1 -1-1 -1 -1-1 -1-1 -1-1
-1 -1
11 11 1 1 11
1 1
1 -1-1-1
-1 -1 -1 -1-1 -1 -1 -1 11 1 11 1
11 1
1 1
1
11 1 11 11 11-1-1-1-1-1 1
-1 -1 -1 -1 -1-1 -1-1 -1 -1 -1 -1 -1 -1 -1 -1 -1 1
1 1 1 1 1
1 1
1 1 1
-1-1 -1 -1 -1 -1 -1 -1-1 -1 -1 1 1 1 1 1 11 1
1 1 1 -1-1-1 -1 -1 -1 -1-1 -1 -1 -1 1 1 1 11 1 1 1 1 11 1 1 1 1 11 1 1 1 1 1 -1 -1-1 -1 -1-1 -1-1
-1 -1
-1 -1-1 -1 -1 -1-1 -1
-1 -1 -1 -1 -1 -1 -1 -1-1 -1 -1 -1 -1 -1 -1 1 1
11-1-111-1-11 -1-11 11 1 -1 -1
-1-1-1 1 111 1 1
1 1 1 1 1 00 0 0 0 0 0 0 0 0 0 0 0 0 0 0 0 0 0 0 0 0
-1-1-1-11-1-11 111-111 -1 -1-1 -1
1
1 1 1
1 1 11 1 1 1 11 1 1 -1 -1 -1 -1-1-1-1 -1
-1 -1 -1 0 0 0 0 0 0 0 0 0 0 0 -1
-1-1 -1 -1
-1 -1-1 -1 -1 -11111 11111 11 -1 -1 -1 -1 -1-1 -1 -1 -1 -1 -1 1
11 1 1 1 1
1 1 1 1
1 1 1
111 1
1 1 1 1 -1 -1 -1 -1
-1-1 -1 -1 -1 -1-1 00 0 0 0 0 00 0 0 0 0 0 0 0 0 0 0 0 0 0 00
0000 0 0 00 00 -1 -1 -1 -1 -1 -1 -1-1 -1 -1 -1 11
1 1 1 1 1
1 1
11 0 0000
0 0
0 0
0 0 00000 0
0
0 0
0 0
11 11 1 1
1 1
1 1 1 -1-1-1 -1 -1-1 -1-1-1
-1
-1111 1 1 11 111 1 1
1
1-1-111 -11 11-1 1 1 -1 1 -1 -1-1-1
-1 -1
-1-1-1- -11 -1-1 1
-1111 11-1 -11 -1 1 1 1 1
-1-1-1-1
-1
-1
-1 -1
-1 -1-1 111111
1 1 1 1 1 0 00
000 00000 0000 000 0 0 0 0 0 0 0 0 0 0 0 0 0 0 0 0 0 0
000 0 0
11
1 11 11 11 1 1 -1-1-1 -1-1-1-1 -1
-1 -1 -1 0000 000
0 0 0 0 11 1 1
1 1 1 11 1 1 -1-1-1 -1
-1 -1 -1 -1 -1 -1 -1 1
1 111
1 11 1
1 1
-1-1-1-1-1 -1-1
-1 -1-1 -1
-1-1 -1 -1 -1 -1 -1 -1 -1 -1 -1 -1 1
11 1 1
1 1 1 1 1 1 -1-1-1-1 -1
-1 -1 -1 -1 -1 -1 00 00 0 0 0 0 0 0 0 11 1 1 1 1 1 1 1 1 1 -1-1-1 -1
-1-1 -1
-1-1-1 -1 -1 -1-1 -1-1-1-1 -1-1 -1
-1 1111 1
1 1 1 11 11 1
1 1 11 1 1 1-1 -1-1-1 -1-1-1 -11-1 1-1
-1 -1 -1 -1 -1 -1 -1 -1 -1 -1 -1 -1
1 111 11 1 1 1 1 1 -1-1 -1 -1 -1 -1 -1 -1 -1 -1-1
11 111 1 1 1 1 1 1 1 1 1 1
1 1 1 1
111
-1 -1 -1-1 -1 -1 -1 -1 -1 -1 -1 -1 -1 -1 -1 -1 -1 -1 -1-1 -1 -1 1 1 1 1 1 1 1 1 1 1 1 1111
111-1-111 1 1 -1-1-1-1-1-1 -1 -1
-1 11 11 1 1 11 1 -1 1 1 -1-1-1-1 -1-1 -1 -1-1-1 -1-1-1 -1-1
-1 -1 -1 -1 -1 -1 1 11 11 1
1 1 1 1 1
-1111-1-1-1-11-1-1-11 -11 -1 -1
1 1 11 1
-1 -1-1-1-1-1-1 -1 -1 -1 -1 11111 1
1
1 1
1 1 -1-1-1-1 -1 -1 -1 -1
-1 -1 -1
1110111 101 1 1 1 000 000000 000 0 0
0 0 0 0 0 0 1 1 1 1 11 11 1 11 -1-1 -1 -1 -1 -1 -1
-1-1 -1 -1 00 0
00 0 0 0
0 0
0 -1-1 -1-1 -1 -1 -1 -1 -1 -1 -1 1 1 111 11
1 1
1 1 1 111 11 1
1
1 1
1 -1 -1-1-1 -1
-1 -1 -1 -1-1 -10 0
000000 0 0 0 0 00 0 0 0 0 0 0 0 0
000 0000000 0 -1
-1 -1 -1-1 -1
-1
-1 -1 -1
-1 11 1 1
1 1 1 1
111 11 1 1 11
1 1 1 1 1 -1 -1 -1 -1-1
-1 -1 -1
-1-1 -1 111 111 1
1 1 1 1 -1 -1-1 -1 -1 -1 -1 -1 -1 -1 -1 0 0 0 0
0000000000 0 0 0-1 -10-1 00 0-1-1 0
-1 -1 -1 -1-1-1 1 1 111 1 1
1 1 1 1 0 0
000 0 0 0
0 0
0 0 000 0
0 0 0 0 0 0 1 1 1 1 1 1 1 1 1 1 1
-1-1-1-1-1 -1 -1 -1 -1
-1 -1
-1-1-1-1-1
-1 -1 -1 -1
11 1 11 1 1
1
1 1 1 -1 -1-1-1 -1-1-1
-1 -1 -1 -1 0000 0 0 0 0 0
1 111 1 1 11 1 1
1 -1-1-1-1-1
-1 -1 -1 -1 -1 -1 1 1 1 1 1 1 1 1 1 1 1 1 1 1 1
1 1 1 1 1 1 1 -1 -1-1 -1 -1 -1 -1 -1 -1 -1 -1 0 0 0 000 0
000 0
0 00 00
0 0 0 0 0 0
-1-1 -1 -1 -1-1 -1
-1 -1 -1
-1 1
111 1 1 1 1 1 1 1 1 11
1 1 1 1 11-1-1-1-1 1-1 1 -1 -1 -1 -1 -1 -1 0 0 0 0 0 0 0 0 0 0 0 1 1 111 1 1
1 1 1 1 -1-1 -1 -1 -1 -1-1-1
-1 -1 -1
1 111 1
1 1 1 1 1 1 -1 -1 -1 -1 -1-1 -1 -1-1
-1 -1 1
1 1 1 1
1 1 1 1
1 1 111 1
1 1 1 1 1 1 1 -1-1-1 -1 -1 -1 -1 -1 -1 -1 -1 00 0 0 0 00 0 0 0 0 00 0 0 0 0 0 0 0 0 0 1 1
111 11 111 1
-1-1-1-1-1-1-1-1 -1-1-1-1-1-1 -1 -1 -1
-1
-1 -1 -1
-1
1111 1
1 1 1 1 1 1 12 10 8 6 4 2 0 1.0 0.9 0.8 0.7 0.6 0.5 0.4 0.3 0.2 0.1 0.0 -0.1 -0.2 wickets share wic k
ets-taking points (win)
-1 -1 -1 -1 -1 -1 -1 -1 -1 -1 -1 1 1 1 1 1 1 1 1 11 1 1 1 1 1 1 1 1 1 111
-1 -1 -1 -1 -1 -1-1-1 -1 -1-1 1 1 1 1 1 1 1 1 11 1 -1 -1-1
-1 -1 -1 -1 -1 -1-1 -1 -1 -1 -1 -1 -1 -1 -1 -1 -1-1-1 11
1 1
1 1 1 1111
1 1 1 1 1 1 1 1 1 1 1 -1 -1 -1 -1 -1 -1 -1-1 -1 -1 -1 0 0 0 0 0 0 0 0
0 0 0 0 00
0 0 0 0 0 0 0 0 0 00 0 0 0 0 000 0 0
0 0 0 0 0 00 0 0 0 0 0 0 0 0 0 0 0 00 0 0 0 0 0 00 0 0 0 0 0 1 1 1 1 1 1 1 1 1 1 1 -1 -1 -1 -1 -1 -1 -1 -1-1-1
-100 0
0 0 000 0 0 0 0 0 0 0 0 0 0 00 0 0
0
0 0
0
0 0 00 0 0 0 0 0 0 0 0 0 0 0 0 0 0 0 0 0 0 0 0 0 0 00 00 0
0 0
0 0 0 0 0 0 0 0 0 0 0 0 0 0 0 0 0 0 0 0 0 0 0 0 0 0 0 0 0 1 1 1 1 1 1 1
1 11 1 -1 -1 -1 -1 -1 -1 -1 -1-1 -1 -1 -1 1 1 1 1 11 1 1 1 1 1 -1 -1 -1 -1 -1 -1 -1 -1 -1 -1 -1 -1 -1 -1 -1 -1 -1 -1 -1 -1-1 -1 1 1 1 1 1 1 1 1 11 1 1 1 1 1 1 1 1 1 1 1 1 -1 -1 -1 -1 -1 -1 -1 -1 -1 -1 -1 -1 -1 -1 -1 -1 -1 -1-1 -1-1 -1 1 1 1 1 1 1 1 1 1 1 1 1 1 1 1 1 1
11 1
1 1 -1 -1 -1 -1 -1 -1-1 -1 -1 -1 -1 -1 -1 -1-1 -1 -1 -1 -1 -1 -1 -1 1 1 1 1 1 11 1 1 1 1000 0 00 0 000 0 0 0 0 0 00 0 00 0 0 1 1 1 1 1 1 1 1 1 1 1
-1-1 -1 -1 -1 -1 -1 -1 -1 -1 -1 -1 -1 -1 -1 -1 -1-1 -1 -1 -1 -1 1 1 1 1 1 1 1 1 1 1 -1 -1 -1 -1 -1 -1 -1 -1 -1 -1 -1 1 1 1 1 1
1 1 1 1 1 1 1 1 1 1 1 1 1 1 1 1 1 -1 -1 -1 -1 -1 -1 -1 -1 -1-1-1-1
-1 -1 -1
-1 -1 -1 -1-1-1 -11
1
1
1 1 1 1
1
11 1 -1 -1 -1 -1 -1 -1 -1 -1 -1 -1 -1 1 1 1 1 1 1 1 1 1 1 1 -1 -1 -1 -1-1 -1 -1-1 -1 -1 -1 1 1 1 1 1 1 1 1 1 1 1 1 1 1 1 1 1 1 1 1 1 -1 -1 -1 -1 -1 -1 -1-1 -1 -1 -1 -1 -1 -1 -1 -1 -1-1 -1-1 -1 -1 -1 -1 -1 -1 -1 -1 -1 -1 -1 -1 -1 1 1 1
1 1 1 1 1 1 1-11
-1 -1 -1 -1 -1 -1 -1-1 -1-1 -1 -1 -1 -1 -1 -1 -1 -1 -1 -1-1 1 1 1 1 1 1 1 1 1 1 1 0 0 0 00 00 0 000
-1 -1 -1 -1 -1 -1 -1-1 -1 -1-1 1 1 1 1 1
1 11 1 1 1 1 11 1 1 1 1 1 1 1 1 -1 -1 -1 -1 -1 -1 -1 -1 -1 -1-1 0 0 0 0 0 0 0 0 0 0 0 0 0 0 0 0 00 0 0 0 0 -1 -1 -1 -1 -1 -1 -1 -1 -1 -1 -1 1 1 1 1 1 1 1 1 1 11 -1 -1 -1 -1 -1
-1 -1-1 -1 -1-1 1 1 1 1 1 1 1 1 1 1 1 -1 -1 -1 -1-1-1 -1 -1 -1-1 -1 0 0 0 0 0 0 0 0 0 00
0 0 0 0 0 0 0 0 0 00 0 0 0 0 0 0 00 0 0
0 0 0 0 000 0 0 0 0 0 -1 -1 -1 -1 -1 -1 -1-1-1-1
-111111 11 1 1 1 1 0 0 0 0 00 0 00 0 0 0 0 0 0 0 0 0 000 0 0 0 0 0 0 0 0 0 0 0 0 0 0 0 0 0 0 0 0 0 0 0 -1 -1 -1 -1 -1 -1 -1 -1 -1-1 -1 1 1 1 1 1 11 11 11 -1 -1 -1 -1 -1 -1 -1 -1 -1 -1 -1 1 1 1 1 1 1 1 1 1 11
1 1 1 1 1 1 11 11 1 -1 -1 -1 -1 -1 -1 -1-1 -1-1 -1 -1 -1 -1 -1 -1-1 -1 -1-1 -1-1 1 1 1 1 1 1 1 1 1 1 1 -1 -1 -1 -1 -1 -1 -1 -1 -1 -1
-1 1 11
1 1 11 11 1 1 0 0 0 0 0 0 0 0 0 0 00
0 0 0 0 0 0 0 0 0 00
0
0
0 0 0 00 0 0 0 0 0 0 0 0 0 0 0 0 0 1 1 1 1 1 1 1 1 1 1 1 -1 -1 -1 -1 -1 -1 -1 -1 -1 -1 -1 0 0 0 0 0 0 0 0 0 00 0 0 0 0 0 0 0 0 0 0 1 1 1 1 1 1 1 1 1 11
-1 -1 -1 -1 -1-1 -1 -1-1 -1 -11 1 1 1 1 1 1 1 1 1 1 -1
-1-1 -1 -1 -1 -1-1-1 -1 -1 -1 -1 -1 -1 -1 -1 -1 -1 -1 -1 -1 -1 1 1 1 1 1 1 1 1111
1 1 1 1 1 1 1 1 1 1 1 -1 -1 -1 -1 -1 -1 -1 -1 -1 -1-1 0 0 0 0 0 0 00 0 0 0 0 0 0 0 0 0 0 0 0 0 0 1 1 1 1 1 1 1 1 1 1 1 -1 -1 -1 -1 -1 -1 -1 -1 -1 -1 -1 -1 -1 -1 -1 -1 -1 -1 -1 -1-1
-1 11 1
1
1 1111 111 1
1 1 1 1 1 1 1 1 1-1 -1 -1 -1 -1 -1 -1 -1 -1-1 -1
-1 -1 -1 -1 -1-1 -1 -1 -1 -1 -1 1 1 1 1 1 1 1 1 11 1 -1 -1 -1 -1 -1 -1 -1-1 -1 -1 -11 1 1 1 1 1 1 1 1 1 11
1 1
1
1 1 1 1 11 1 -1 -1 -1 -1 -1 -1-1-1 -1 -1 -1 -1 -1 -1 -1 -1-1 -1 -1 -1-1 -1 1 1 1 1 1 1 1 1 1 1 1 1 1 1 1 1 1 11 1 1 1 -1 -1 -1 -1 -1 -1 -1 -1 -1-1 1-1
1 1 1 1 1 1 1 1 1 1 -1 -1 -1 -1 -1 -1 -1 -1-1 -1 -1 -1 -1
-1 -1 -1 -1-1-1 -1 -1 -1 1 1 1 1 1 1 11111 -1 -1
-1 -1 -1 -1-1-1 -1 -1 -1 1 1 1 1 1 1 1 1 1 1 1 -1 -1 -1 -1 -1 -1 -1 -1 -1 -11-1
1 1 1 1 1 1 1 1 1 1 -1 -1 -1 -1 -1 -1 -1-1 -1-11-1
1 1 1
1 1 1 1 11 1 0 0 0 0 0 0 0 0 0 00 0 0 0 0 0 000 0 0 0 1 1 1 1 1 1 11
1
1 1 -1 -1 -1 -1 -1 -1 -1 -1 -1 -1 -10 0 0 0 0 000
0000000 0 0 0 0 0 0 -1 -1 -1 -1 -1 -1 -1 -1 -1 -1 -1 1 1 1 1 1 1 11 1 1 1 1 1 1 1 1 1 1 1 1 1 -1 -1 -1 -1 -1 -1 -1 -1 -1 -1 -1 0 0 0 0 0 0 0 0 0 0 0 0 0 0 0 0 0 0 0 0 0 00 0 0 0 0 0 0 0 0 0 0 0 0 0 0 0 0 0 0 00 0 -1 -1 -1 -1 -1 -1 -1 -1 -1-1 -1 1 1 1 1 1 1 1 1 1 1 1 1 1 1 1 1 1 1 1 1 1 1 -1 -1 -1 -1 -1 -1 -1 -1-1 -1 -1 1 1 1 1 1 1 1 11 1 1 -1 -1 -1 -1 -1 -1 -1 -1 -1 -1
-1 000000000000000000 0 00 0 -1 -1 -1 -1 -1 -1 -1 -1 -1-1 -1 1 1 1 1 1 1111 1 1
000 0 0 0 0 0 0 0 0 0 0 00 0 0 0 0 00 0 0 0 0 0 0 0 0 0 0 0 0 0 0 0 0 0 00 00 0 1 1 1 1 1 1 1 1 1 1 1 -1 -1 -1 -1 -1 -1 -1 -1 -1 -1 -1 1 1 1 1 1 1 1 111
1 -1 -1 -1 -1 -1 -1 -1 -1 -1 -1 1 1 1 1 1 1 1 1 1 1 1 -1 -1 -1 -1 -1
-1-1 -1 -1 -1-1
0 0 0 0 0 0 0 0 0 0 0 -1 -1 -1 -1 -1 -1 -1 -1 -1-1-1 1 1 1 1 11 1 1 1 1 1 -1 -1 -1 -1-1 -1 -1 -1 -1 -1 -1 1 1 1 1 1 1 1 1 1 1 1 1 1 1 1 1 1 1 1 1 11
-1 -1
-1
-1 -1 -1 -1-1 -1 -1
-100000000 0 00
-1
-1 -1-1 -1 -1-1 -1-1 -1 -1 1 1 11 1 1 11111
1 1 1 1 1 1 1
111-1-1 -1 -11 -1 -1 -1
-1 -1-10-1
0 0 0 0 0 0 0 0 0 0 0 0 0 0
00 0 0 0 0 0 1 1 1
1111 111 1 -1 -1 -1 -1 -1 -1 -1 -1-1-1-1
-1 -1 -1 -1 -1 -1-1 -1 -1 -1 -1 1 1 1 1 1 1 11 1 1 1 -1 -1 -1 -1 -1 -1 -1 -1 -1 -1 -1
1 1 11 1
11 1 1 1 1
1 1 1 1 1 1 1 1 1 1 1 -1 -1 -1 -1 -1 -1 -1 -1 -1 -1 -1 0 0 0 0 0 0 0 00 0 0 0 0 0 0 0 0 0 0 0 0 0 1 1 1 1 1
1 11 1-1 11 -1 -1-1-1 -1 -1 -1-1 -1 -1 -1 -1 -1 -1 -1 -1 -1 -1-1-1
-1 1
1 1
1
1 1 11 1 1 1
a b
c d
Figure 1 For individual players: (a) total batting points (not lose criterion)versusruns in the match; (b) total wicket-taking points (not lose
criterion)versuswickets share; (c) total batting points (win criterion)versusruns in the match; (d) total wicket-taking points (win criterion)
taken by the bowler (bowled, lbw,α1=1),j=2 corresponds to
a catch taken by afielder (α2=0.25) andj=3 corresponds to
the bowler contribution in this case (α3=0.75). Run-out
contributions are shared between thefielders involved. Stump-ings are treated similarly to catches. For playeriin sessiont, the number of contributions of typej, zitj, can be obtained from the
scorecard. If the total number of wickets taken in sessiontiszt
then the wicket-taking points awarded to playeriin sessiontis
Ci;t;bowl¼Ct;bowl´
Pn j¼1zitjαj
zt :
The net contribution of playeriin the match is then the sum of contributions from all sessions:
X15
t¼1
Ci;t;bowl+Ci;t;bat
:
We assume in these expressions that there is no change of innings during a session. When there is, we calculate the actual and hypothetical probabilities in a slightly different way. We suppose in effect that the within-session change of innings occurs at a virtual session-end. The outcome probabilities for the virtual session-end are calculated by interpolating between the probabilities that can be calculated for the actual session-ends immediately before and after the virtual session-end. We carry out the interpolation linearly with weights determined by the number of overs into the session at which the change of innings occurs. We omit the details of the calculation here. A player will only score batting and wicket-taking points in the same session if there is a change of innings in the session. The following should also be noted. First, in modelling match outcome, lead is calculated session by session throughout the match with respect to the reference team, the team battingfirst in the match. Therefore, all the above formulae are strictly applicable to the reference team. For the opponents, the team bowlingfirst, the bowling criterion {win} of the reference team becomes {lose} of the reference team and vice versa. Second, the change in the probabilities at the end of a match (last session) is calculated by comparison of the hypothetical posi-tion with the actual match result. Third, we could use different criteria, for example, {win} for batters and {not lose} for bowlers. This is explored in the example below. Finally, our intention is to produce a rating system where total batting and wicket-taking points over all time should be the same. How-ever, we are not yet in a position to do this as we have not collected data on sufficient matches.
3. Comparison of potential measures of contribution
We now compare the approaches described above. Batting and wicket-taking points for individual players are calculated by the above stated approaches, and plotted in Figure 1, for 104 test matches played in 2010, 2011 and 2012. To calculate the ratings of not too large a number of players for a reasonably large number of matches, we only consider the top eight teams
(Australia, New Zealand, Pakistan, India, South Africa, West Indies, Sri Lanka and England). Figure 1(a) clearly shows a positive relationship between batting points under the {not lose} criterion and total score. On the other hand, using the {win} criterion for batters, some of the players earn negative points (Figure 1(c)). This is because batters do not always play for a win; sometimes batters bat slowly for a draw when the opponent’s lead is large. When a batter bats slowly the win and loss probabilities decrease and the draw probability increases. Therefore, those batters who play for a draw can receive negative points under the {win} criterion. By using the {not lose} criterion for wicket taking (Figure 1(b)), some players received negative points. On the other hand, Figure 1(d)({win} criterion for wicket-taking points) gives a stronger positive relationship. Thus, these plots would appear to support the idea of using the {win} criterion for wicket-takers and the {not lose} criterion for batting points.
4. Examples
4.1. Example 1
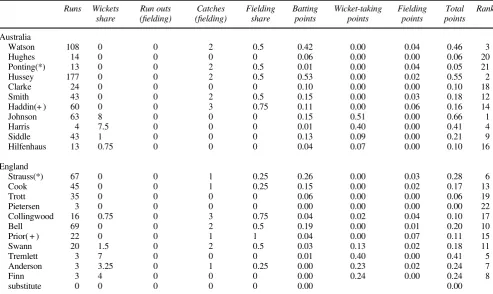
Consider now the third test between Australia and England, Perth, 2010. Table 5 provides the summary of players’batting, bowling and fielding contributions in the match. Batting contributions use {not lose} and bowling andfielding contribu-tions use {win}. Australia battedfirst, scoring 268 runs in their
first innings and 309 runs in their second innings. In reply, England scored 187 runs in theirfirst and 123 runs in the second innings. Australia won this match by 267 runs. Hussey scored maximum runs in the match and received maximum batting points (0.53). On the other hand, Johnson scored 63 runs and took nine wickets in the match. He received the maximum points (0.66) with this all-round performance and was declared man of the match. Note that wicket-taking points are adjusted (rescaled) so that total batting points and total wicket-taking points are equal; we do this to standardize the contributions. Such standardization might be carried out over a series of matches, or even over all matches played in a specified period. The rationale for this is that ultimately, if enough matches are considered, run-scoring and wicket-taking contributions ought to be balanced.
4.2. Example 2
contributions. Using the combined contribution measure to evaluate the player of the series or tournament award, we see that Alastair Cook, the England opening batsman, is placed in top position. Behind him in second is his countryman Ander-son, a bowler whose contribution with the ball was also outstanding. It is difficult to argue against these players being the best batsman and bowler, respectively. Cook in fact was awarded the man of the series accolade. England players occupy four of the topfive positions; Hussey is the exception at third. England won the series 4–0.
4.3. Example 3
Consider the two-match test series between South Africa and India in India, February 2010. The series was tied at 1–1. Tables 7 and 8 summarize the net wicket-taking (bowling and fielding) and batting contributions of the players. To calculate the batting points, we tried both the earlier stated criteria ({win} and {not lose}). However, under the {win} criterion, a significant number of batsmen received negative batting points. Therefore, batting contri-butions are calculated using the {not lose} criterion. Wicket-taking contributions are calculated using the {win} criterion. Raw unadjusted contributions are shown.
Table 7 summarizes the net batting and net wicket-taking contributions in the first test match. South Africa won this match by an innings and 6 runs. Amla scored 253 runs in the
match and received the maximum batting points (0.187). On the other hand, Steyn received the maximum wicket-taking points (0.878) in the match. Note that Sehwag and Ten-dulkar scored almost the same number of runs but received quite different numbers of points. This is because Tendulkar made 100 runs in the second innings when the defeat of his team was almost certain. Table 8 summarizes the net batting and wicket-taking contributions in the second test. India won the match by an innings and 57 runs. Amla once again scored maximum runs in the match but received fewer batting points than Sehwag and Tendulkar. The Sehwag and Tendulkar partnership was the crucial and decisive one from the point of view of the match result. Laxman and Dhoni also made hundreds in the match but received fewer points than Sehwag and Tendulkar. This is because India were already in a strong position in the match and faced the less pressured situation.
[image:8.595.49.543.79.373.2]Table 9 shows the total scores over the 2-match series for the top 10 players in rank order, with wicket-taking con-tributions rescaled so that the total batting and wicket-taking contributions over the series are equal. Harbhajan Singh is placed in top position with maximum total points on the basis of his 7.5 wickets (bowling plusfielding) in the second test; arguably, all these wickets were decisive and played a vital role in the win. Amla scored a massive 490 runs in the two-match series but is some way behind Singh in the adjusted contribution score. Sehwag, who scored 290 runs
Table 5 Player contributions in the third Ashes test, AustraliaversusEngland, Perth, 2010
Runs Wickets
share
Run outs (fielding)
Catches (fielding)
Fielding share
Batting points
Wicket-taking points
Fielding points
Total points
Rank
Australia
Watson 108 0 0 2 0.5 0.42 0.00 0.04 0.46 3
Hughes 14 0 0 0 0 0.06 0.00 0.00 0.06 20
Ponting(*) 13 0 0 2 0.5 0.01 0.00 0.04 0.05 21
Hussey 177 0 0 2 0.5 0.53 0.00 0.02 0.55 2
Clarke 24 0 0 0 0 0.10 0.00 0.00 0.10 18
Smith 43 0 0 2 0.5 0.15 0.00 0.03 0.18 12
Haddin(+ ) 60 0 0 3 0.75 0.11 0.00 0.06 0.16 14
Johnson 63 8 0 0 0 0.15 0.51 0.00 0.66 1
Harris 4 7.5 0 0 0 0.01 0.40 0.00 0.41 4
Siddle 43 1 0 0 0 0.13 0.09 0.00 0.21 9
Hilfenhaus 13 0.75 0 0 0 0.04 0.07 0.00 0.10 16
England
Strauss(*) 67 0 0 1 0.25 0.26 0.00 0.03 0.28 6
Cook 45 0 0 1 0.25 0.15 0.00 0.02 0.17 13
Trott 35 0 0 0 0 0.06 0.00 0.00 0.06 19
Pietersen 3 0 0 0 0 0.00 0.00 0.00 0.00 22
Collingwood 16 0.75 0 3 0.75 0.04 0.02 0.04 0.10 17
Bell 69 0 0 2 0.5 0.19 0.00 0.01 0.20 10
Prior( + ) 22 0 0 1 1 0.04 0.00 0.07 0.11 15
Swann 20 1.5 0 2 0.5 0.03 0.13 0.02 0.18 11
Tremlett 3 7 0 0 0 0.01 0.40 0.00 0.41 5
Anderson 3 3.25 0 1 0.25 0.00 0.23 0.02 0.24 7
Finn 3 4 0 0 0 0.00 0.24 0.00 0.24 8
in the series, achieved nearly as many adjusted contribution points as Amla. This is because Sehwag’s runs came at a more decisive time than Amla’s, particularly in the second match of the series. It is quite clear that Amla was the most consistent batsman in the series, but he received fewer points than Harbhajan Singh. This is perhaps because one good bowling spell can change the situation in the match completely and in a very short time; therefore, under the system bowlers can accrue a large number of points. On the other hand, batters take time to make the
position strong. This suggests that bowlers are more likely to receive the maximum points, even in the adjusted contribution system.
5. Rating test match players
[image:9.595.50.544.78.315.2]To rate players on the above measures of contribution may not be totally satisfactory. For instance, consider the above stated Example 3, the two-match series between India and South
Table 7 Raw player contributions for 2010 test series between India and South Africa in India,first test match
Batting contribution Wicket-taking contribution Batting contribution Wicket-taking contribution
South Africa Runs Points Wickets
(bowling+fielding)
Points India Runs Points Wickets
(bowling+fielding) Points
Smith 6 0.005 0.25 0.026 Gambhir 13 0.004 0 0.000
Boucher ( + ) 39 0.007 0.75 0.048 Vijay 36 0.008 0.25 0.011
Amla 253 0.187 0 0.000 Sehwag 125 0.081 0.75 0.010
Kallis 173 0.152 1 0.097 Tendulkar 107 0.022 0 0.000
Prince 0 0.000 0.25 0.026 Bedrinith 62 0.048 0.25 0.003
Duminey 9 0.003 0.25 0.030 Saha 36 −0.023 0 0.000
de villiers 53 0.030 0.25 0.023 Dhoni (+ ) 31 0.013 0.25 0.021
Harris 0 0.000 3.5 0.299 Mishra 0 0.000 0.25 0.002
Pernell 0 0.000 2.5 0.224 H Singh 47 −0.016 1.75 0.048
Steyn 0 0.000 9.25 0.878 Z Khan 35 −0.024 2.5 0.153
Morkel 0 0.000 2 0.168 Sharma 0 0.000 0 0.000
Substitute 0 0.000 0 0.000 Substitute 0 0.000 0 0.000
Extras 25 Extras 60
Match total 558 0.384 20 1.819 Match total 552 0.114 6 0.249
[image:9.595.48.545.371.567.2]South Africa won by an innings and 6 runs.
Table 6 Ashes series 2010/2011: Players in rank order of total contribution, batting and wicket taking (bowling andfielding)
Players Country Batting
contribution
Wicket-taking contribution
Fielding contribution
Adjusted wicket-taking contribution
Adjustedfielding contribution
Total net contribution
Rank
Cook England 0.885 0.000 0.106 0.000 0.059 0.944 1
Anderson England 0.031 1.400 0.063 0.774 0.035 0.840 2
Hussey Australia 0.791 0.000 0.048 0.000 0.027 0.818 3
Swann England 0.039 0.932 0.110 0.515 0.061 0.615 4
Strauss England 0.528 0.000 0.149 0.000 0.082 0.610 5
Tremlett England 0.005 0.950 0.000 0.525 0.000 0.530 6
Johnson Australia 0.200 0.602 0.000 0.333 0.000 0.533 7
Watson Australia 0.434 0.107 0.077 0.059 0.043 0.536 8
Siddle Australia 0.089 0.491 0.002 0.271 0.001 0.361 9
Pietersen England 0.232 0.133 0.164 0.074 0.091 0.396 10
Finn England 0.001 0.650 0.032 0.359 0.018 0.378 11
Prior England 0.061 0.000 0.528 0.000 0.292 0.353 12
Haddin Australia 0.322 0.000 0.069 0.000 0.038 0.360 13
Trott England 0.257 0.000 0.124 0.000 0.069 0.326 14
Bresnan England 0.005 0.515 0.000 0.285 0.000 0.290 15
Bell England 0.287 0.000 0.014 0.000 0.008 0.295 16
Harris Australia 0.010 0.426 0.000 0.235 0.000 0.245 17
Hilfenhaus Australia 0.095 0.192 0.007 0.106 0.004 0.205 18
Collingwood England 0.059 0.075 0.156 0.041 0.086 0.187 19
Africa. First, Amla scored 490 runs in the series at an average of 490 runs per innings and received the maximum batting points (0.288), while Sehwag scored 290 runs in the series at an average of 97 runs per innings and received 0.282 points, nearly as many. There is a large difference between their runs but they received almost the same number of contribution points. This is in part because the contribution points system takes little account of contributions after a point when the win or draw probability of any team is close to unity. Second, in both matches, bowlers stand out in the contribution points table: Steyn in thefirst test (Table 7) and Harbhajan Singh (Table 8) in the second test. Furthermore, there is the fact that negative points can be achieved, and this appears to be more prevalent for batters. To overcome these problems, it may be sensible to use the contributions as one component of a weighted average rating system. The other component might be the raw runs and wickets in the match.
Such a scheme could be developed in a number of ways. Under one such scheme, the batting, bowling andfielding rating points might be calculated in the following way. Let the batting points of player i (i=1, 2,…,22) under a weighted average rating system in a match be
P15 t¼1Ci;t;bat
P22 i¼1
P15 j¼1Ci;t;bat
+ ri
RT
! ´1
2
whereriis total runs (raw) scored by playeriin the match and
RTis the total runs scored by both teams (match total). Note that
tis indexing each of the 15 sessions in a match. Let the wicket-taking (bowling and fielding) points of player i under this weighted average rating system in the match be
P15 t¼1Ci;t;bowl
P22 i¼1
P15 j¼1Ci;t;bowl
+wi
40
! ´1
2
wherewi is total wickets share of player iin the match. To
standardize the contribution scores under this system, we multiply the net player contribution (sum of the batting, bowling andfielding points) by 1038—the average score per match, based on all test matches from 1877 to 2007. In this way, points achieved are put on a‘runs-like’scale. In addition, the maximum batting (runs) and wickets points will be reserved up to 1038 points per match.
[image:10.595.50.544.79.276.2]To illustrate this rating system, Table 10 summarizes the net contributions of the top 26 players in the 104 test matches in 2010, 2011 and 2012 played by the top eight teams. The top two positions are secured by bowlers. DW Steyn, in the number one spot, scored 381 runs and had a wicket share of 109.25. GP Swann secured second place with 593 runs and a wicket share of 102.75. MJ Clarke in third scored 3120 runs. JH Kallis secured the seventh position with his all-round performance.
Table 8 Raw player contributions for 2010 test series between India and South Africa in India, second test match
Batting contribution Wicket-taking contribution Batting contribution Wicket-taking contribution
South Africa Runs Points Wickets
(bowling +fielding)
Points India Runs Points Wickets
(bowling+fielding) Points
Smith 24 0.023 0 0.000 Gambhir 25 0.018 0 0
Petersen 121 0.079 0.5 0.019 Vijay 7 0.005 0 0
Amla 237 0.101 0 0.000 Sehwag 165 0.199 0 0
Kallis 30 0.030 0.5 0.031 Tendulkar 106 0.144 0 0
Prince 24 0.007 0.25 0.018 Bedrinith 1 0.001 0.25 0.023
Duminey 6 0.001 0.75 0.053 Laxman 143 0.048 0.25 0.018
de villiers (+ ) 15 0.026 0.75 0.029 Dhoni ( + ) 132 0.034 1 0.073
Harris 5 0.002 0.75 0.053 Mishra 28 0.023 3.75 0.340
Pernell 34 0.032 0 0.000 H Singh 0 0.000 7.5 1.753
Steyn 6 0.011 1 0.071 Z Khan 0 0.000 4.5 0.273
Morkel 23 0.025 1.5 0.070 Sharma 0 0.000 2.5 0.583
substitute 0 0.000 0 0.000 Karthik (sub) 0 0.000 0.25 0.083
Extras 61 Extras 36
Match total 586 0.338 6 0.344 Match total 643 0.473 20 3.146
India won the match by an innings and 57 runs.
Table 9 Total adjusted player contributions for the 2010 test series
between India and South Africa in India (top 10 players)
Country Player Wickets (bowling+
fielding)
Runs Adjusted contribution
points Rank
India H Singh 9.25 47 0.430 1
South Africa Amla 0 490 0.288 2
India Sehwag 0.75 290 0.282 3
South Africa Steyn 10.25 6 0.240 4
South Africa Kallis 1.5 203 0.209 5
India Tendulkar 0 213 0.167 6
India Sharma 2.5 0 0.143 7
India Mishra 4 28 0.104 8
India Z Khan 7 35 0.101 9
[image:10.595.48.287.343.478.2]The wicket-keeper batsmen MJ Prior and MS Dhoni were in sixteenth and twenty-fifth position, respectively.
Another potential application of our rating system that may be appealing relates to the selection of man of the match, as the choice is often between a batsman or a bowler and occasionally between a player on the winning team or the losing team. Selecting the highest rated player as man of the match has an objective quality. Counting the instances in which the man of the match is on the winning or losing team as opposed to the highest rated player being on the winning or losing team (Table 11), we can see: (a) in only 2 matches (of the 104 matches in 2010–2012) was the man of the match on the losing team; (b) if the man of the match was awarded to the highest rated player (by our method) then there would have been 17 occasions for which the man of the match was on the losing side. Thus, the table suggests that the subjective choice of man of the match is biased towards winners.
Not only would a man-of-the-match award based on max-imum rating points be fairer to losers, but also it brings a better balance between batters, bowlers and all-rounders. Among these 104 matches, the man of the match was a batter, bowler, all-rounder in 51, 44, 5% of occasions, respectively. The corresponding figures for the highest rated player are 41, 48, 11%, respectively. Thus, thesefigures suggest that bowlers play a more decisive role than they are given credit for in man-of-the-match awards.
A drawback of our rating system is that the total number of points achieved is the same for every match. Thus, for matches
in which the advantage often changes between the teams, while contribution points will be increased standardization moderates this effect. Thus, the unadjusted contributions method will give greater rewards to players in tight contests—this would seem to be an advantage of this method. To overcome these drawbacks, different components of a weighted average scheme might be combined once total scores on each component are determined for a series of matches. Thus, suppose in afive-match seriesr runs are scored and w wickets taken, and thus 1 wicket is equivalent tor/wruns. Suppose also that the raw total (over all
[image:11.595.49.544.77.357.2]five matches) contribution points aren for batting and m for wicket taking. Then a possible scheme that equally weights batting and wicket taking, and actual runs scored and wickets
Table 10 Batting, wicket taking and net player contributions (points) for 104 matches in 2010, 2011 and 2012
Player Country Raw Contribution Points Rank
Runs Bowling share Fielding share Batting Bowling Fielding Batting Wicket taking Total
DW Steyn South Africa 381 109.25 3.83 0.52 6.27 0.19 396.46 3628.10 4024.57 1
GP Swann England 593 102.75 11.83 0.79 7.00 0.62 649.85 3247.09 3896.94 2
MJ Clarke Australia 3120 10.75 12.75 3.10 0.80 0.72 3200.41 651.23 3851.64 3
JM Anderson England 276 100.75 7.00 0.27 5.93 0.53 270.26 3008.72 3278.98 4
M Morkel South Africa 277 87.25 2.25 0.36 4.96 0.33 312.72 2894.34 3207.06 5
HM Amla South Africa 2678 0.00 6.33 2.71 0.00 0.39 2859.11 217.43 3076.54 6
JH Kallis South Africa 2148 20.25 11.50 1.67 1.08 0.65 2115.72 939.87 3055.58 7
SCJ Broad England 794 76.75 1.50 0.97 4.77 0.04 878.90 2132.11 3011.00 8
AN Cook England 2664 0.00 8.08 2.83 0.00 0.51 2592.61 218.97 2811.59 9
HMRKB Herath Sri Lanka 442 88.25 3.75 0.93 3.60 0.15 555.51 2189.52 2745.03 10
MEK Hussey Australia 2317 4.00 11.00 2.58 0.32 0.57 2239.66 451.16 2690.82 11
KC Sangakkara Sri Lanka 2336 0.00 2.50 2.42 0.00 0.45 2534.22 150.07 2684.30 12
AB de Villiers South Africa 2073 0.00 14.33 2.00 0.00 0.84 2220.27 461.68 2681.94 13
Saeed Ajmal Pakistan 191 75.00 2.25 0.23 4.75 0.11 241.17 2357.11 2598.29 14
RT Ponting Australia 2234 0.00 9.00 2.80 0.00 0.47 2312.36 239.48 2551.84 15
MJ Prior England 1749 0.00 25.42 2.15 0.00 1.61 1799.75 729.51 2529.26 16
GC Smith South Africa 1815 0.00 11.75 2.10 0.00 0.61 2079.49 443.99 2523.48 17
KP Pietersen England 2383 4.75 5.50 2.48 0.14 0.34 2287.78 224.46 2512.24 18
PM Siddle Australia 328 65.00 3.00 0.44 4.29 0.12 412.50 2082.17 2494.67 19
IJL Trott England 2177 2.00 4.75 1.90 0.52 0.30 2175.08 280.40 2455.48 20
PP Ojha India 80 74.25 2.25 0.06 4.70 0.12 69.32 2329.51 2398.83 21
V Sehwag India 2158 5.75 6.50 2.05 0.36 0.42 2010.56 373.50 2384.06 22
VD Philander South Africa 267 61.75 0.75 0.46 2.68 0.05 289.09 2076.79 2365.88 23
R Ashwin India 567 58.50 0.75 0.54 3.63 0.03 490.39 1717.50 2207.89 24
MS Dhoni India 1629 0.00 24.50 1.52 0.00 1.49 1478.99 695.85 2174.84 25
Harbhajan Singh India 601 48.50 2.25 0.48 4.13 0.15 508.93 1575.95 2084.89 26
Table 11 2 ×2 cross-classification table for 104 test matches in
2010–2012 played by the top eight teams (30 drawn matches are ignored), classified by actual man of the match (MOM)
on winning or losing side and highest rated player on winning or losing side
Actual MOM award
On winning team On losing team Total
Highest rated player
On winning team 57 0 57
On losing team 15 2 17
[image:11.595.306.545.441.529.2]