3192
THE IMPACT OF MANAGEMENT INFORMATION SYSTEMS
ON ORGANISATIONAL PERFORMANCE WITH TOTAL
QUALITY MANAGEMENT AS THE MEDIATOR
REYATH THEA AZEEZ 1 & KAMARUL BAHARI YAAKUB 2
1 Department of Business Administration, Missan University, Iraq
2 Department of Business Management and Entrepreneurship, Universiti Pendidikan Sultan Idris, Malaysia E-mail: [email protected], [email protected]
ABSTRACT
The present study was conducted to bring attention to the importance of Total Quality Management (TQM) in applying Management Information System (MIS) and their effects on organisational performance, particularly in the oil sector. The main objective of this research is an attempt to investigate the relationship of MIS and organisational performance along with the mediating role of TQM at Missan Oil Company in Iraq.
The quantitative method applied the questionnaire-survey and structural equation modeling (SEM). A total of 250 questionnaires were distributed and a high rate of return (87.6%) has been achieved. After initial data screening, 201 responses were utilised to analyse the final data. The results revealed that MIS indicators, namely information quality, user satisfaction and net benefits are directly linked with organisational performance. Meanwhile, TQM mediates the relationship between five of the MIS indicators, namely system quality, information quality, use of system, user satisfaction and net benefits with organisational performance.
The findings of this study will be useful for the Iraqi oil sector as it will enhance their organisational performance through the use of appropriate MIS indicators.
Keywords: Management Information Systems, Mis; Total Quality Management, Tqm, Organisational
Performance, Missan Oil Company, Sem, Iraq.
1. INTRODUCTION
Modern time management relies heavily on information to thrive. Nothing changes without information, and in general, it is believed that information is powerful and that its owner has power [1]. Furthermore, many organisations currently suffer from an excess of information. They need to manage all the information they have acquired in order to face the chaos of the digital era left behind by the rapid technological advances and the widespread knowledge dissemination [2]. In this context, the need for information systems has risen [3]. Therefore, organisations are heavily investing in information systems because they seek to maintain their competitiveness in order to remain in the market [4].
Apart from the accelerated pace of technological developments in the field of production, there has also been an evolution in
the means of communication and the transmission of information. The growing competitive organisations are forced to take quick and effective decisions thus leading to the effectiveness of the organisational performance [5].Therefore, organisations now need tools to aid them to make quick and automated decisions, and to find ways to reduce uncertainty as only an effective management information system (MIS) can mitigate these challenges [6].
3193 organisation's performance [8]. TQM is an ideology which has been described by management as the philosophy of general administration to assist the company to expect high quality in all its operations and processes [9]. In the same context, the study by [10] has
proved that TQM has a positive effect on improving the performance of oil companies as well as the effect of implementation of TQM on organisational performance directly. Furthermore, TQM plays a positive mediation role in improving its performance [11]. The adoption of TQM by organisations has contributed to the formulation of organisation culture to achieve long-term and short-term goals. To achieve the wanted objectives of organisations, firstly it requires the establishment, development and strengthening of organisational culture and ensuring the participation of all its members [12].
Realistically, TQM and information systems (including MIS) have common goals. Some of the main goals of TQM in most organisations are to develop product and process quality to meet the needs of the organisation's members and consumers, and also to increase competitiveness and effectiveness. Whereas the objectives of information systems are to increase production, improve quality, improve services, lower costs, increase the competitiveness of companies [13].
The importance of the variables addressed in the current study is MIS, TQM, and organisational performance. However, the researcher found that limited literature is available for studying these variables in the field of the Iraqi oil industry. Moreover, the researcher believes that dealing with these variables will be important for the Iraqi oil sector because the modern risks associated with the processes of the Iraqi oil industry are enormous. Also, the macroeconomic problems such as the cost of the war on terror, inflation rates, exchange rates, unemployment rates, debt, debt service rates, export and import growth rates, political instability, lack of reliance on MIS in decision making, and poor TQM implementation all negatively affect the performance of the companies operating in the oil field in Iraq [14]. It would be of interest to note that the manager's monitor and evaluate the trends in their business environment through available internal and external channels of information which are made accessible to them by using modern IT [1].
Depending on the above, the current study discusses the impact of MIS on organisational performance in the context of TQM within the organisation. Therefore, the impact of MIS on organisational performance in the context of TQM was assessed by collecting data using a questionnaire that has been filled by sample opinions of managers at Missan Oil Company in Iraq.
2. OBJECTIVES OF THE STUDY
This research has the following objectives: 1. To examine the relationship between
MIS indicators and organisational performance at Missan Oil Company. 2. To examine the relationship between
MIS indicators and TQM at Missan Oil Company.
3. To examine the relationship between TQM and organisational performance at Missan Oil Company.
4. To examine the mediating role of TQM in the relationship between MIS indicators and organisational performance at Missan Oil Company. 5.
3. QUESTIONS OF THE STUDY
The present study attempts to answer the following questions:
1. Is there any relationship between MIS indicators and organizational performance at Missan Oil Company? 2. Is there a relationship between MIS
indicators and TQM at Missan Oil Company?
3. Is there a relationship between TQM and organizational performance? 4. Does TQM mediate the relationship
between the MIS indicators and organizational performance at Missan Oil Company?
5. LITERATURE REVIEW
4.1Relationship Between Mis And
Organizational Performance
3194 and resources to guarantee the valid functioning of a firm [16]. According to [17] an information system is important for controlling the performance. It should provide feedback that can be monitored and evaluated to determine if the system is achieving the established or set standards. A good system is one that is adjustable so that appropriate information is produced and provided to end users. Measures on individual performance should be relevant to the organisation’s objectives. People and systems should work together to ensure that desirable outcomes are achieved. Therefore, information systems form part of an effective performance management [18].
Evidence from many case studies have suggested that MIS increases productivity and performance such as [19] ؛ [20] ؛[22]؛[21]؛ ؛ [23].
4.2 Relationship Between Mis And TQM
The philosophy of TQM principle is that continuous improvement leads to a continuous flow of change by requesting for information systems [24]. The factors that enable the application of TQM to be successful involve management capability of quality information, production rationalisation, and automation. Therefore, organisations have increasingly found that IT and information systems are the main success factors of TQM. Thus, through the application of MIS, organisations should be able to implement TQM better [25].
As a matter of fact, TQM and information systems have common goals. In most companies, some of the basic aims of TQM are increasing competitiveness and effectiveness by improving product quality and processing to fulfill both the needs of the consumer and the firm. On the contrary, the goals of information systems are growing production, developing quality, improving services, declining costs, and increasing the firm's competitiveness [26]. Many researchers have since addressed the relationship between MIS and TQM such as [26] ؛ [27]؛ [28] ؛ [29] ؛ [30].
4.3 Relationship Between TQM And
Organizational Performance
In the past, TQM had helped in managing companies and organisations to develop their whole efficiency and performance on the road to attaining world-class position [31].
Choi and Eboch [32], had described TQM is described as a collective, interlinked system of quality practices that is associated with organisational performance.
Leading quality researchers, such as Deming, Crosby, and Juran, supported the positive association between quality implementation and organisational performance [33]. In the same direction many researchers claimed that TQM is considered as an important quality improvement and performance improvement tool [33] ؛ [34] ؛ [35] ؛ [36] ؛ [37].
4.4 Mediating Role Of TQM
Previously, much research has been conducted to test the direct impact of MIS on organisational performance. However, the said impact remains ambiguous which needs further clarification [38]. In other words, some other variables should be considered to detect the mechanism by which this impact can be better explained. This is why many researchers have urged future researchers to focus more on the subject and try to engage new variables that may affect the affiliation in a positive and significant way [39]. In this regard, TQM has been linked and studied as a way to demonstrate the impact of MIS on organisational performance. Through the use of TQM concepts, MIS may have the ability to achieve predefined goals and improve performance. TQM focuses on some significant domains such as leadership, continuous improvement, innovation, customer focus, strategic planning, benchmarking, service design, etc. The implementation of these techniques and practices in a company can help to achieve the required organisational performance. Logically, firms can benefit from TQM because of the elements of success [33].
3195
Figure 1: The Framework of Research
5. RESEARCH METHOD
The aim of the current research is to examine the role of MIS on organisational performance. In addition, the mediating role of TQM between the relationship of the MIS and organisational performance is also examined. According to [44] "a research design is simply a framework or a study plan which is used as a guide for data collection and analysis. It is a scheme to complete the study. A research design is the blueprint for data collection and analysis". Hence, the descriptive research design is chosen for this study as [45] it depicts that descriptive research has the characteristic to answer the questions relating to where, what, how, when and why. The survey, in the form of mailed questionnaires was, therefore, the chosen research method to be utilised in this study. Attempting to offer "a snapshot of one point of time" [46]. The cross-section is a more suitable design to characterise the current study.
5.1 Population And Sample
The population in this study is made up
of managers of high, middle and low levels at Missan Oil Company. The researchers adopted the probability sampling in order to make generalization of the research findings to the study method using a sample of respondents. A highlighted earlier, there are various types of probability sampling, however, for this study; the researchers chose simple random sampling as a sampling method [47].
According to [48] the sample size for a population of approximately, 298 is 169. Therefore, the sample size for the current study is 250 to be considered as adequate and satisfactory to yield a confidence level of 95% with a 5% sampling error according to the previous opinions.
5.2 Measures
3196 The questionnaire includes four broad types of questions. Section (A) aims to collect the demographic information of the respondents, which includes 7 questions that were supposed to collect some information about the participants. Section (B) includes 24 questions that are related to MIS indicators, and the model by [49] on the success of information systems. But the updated version by [50] is used to measure MIS, which includes six indicators, namely system quality, information quality, service quality, use of system, user satisfaction and net benefits. Each indicator has four items. The preparation of these items are based on [51] ؛ [52] ؛ [53] ؛ [54] ؛ [55] ؛ [56]. Section (C) includes 24 questions that are related to TQM, but the model by Malcolm Baldrige National Quality Award (MBNQA) 1987 is used to measure TQM, which includes six practices, namely the practice of leadership, customer focus, human resource management, strategic planning, process management, and information & analysis. Each practice has four items. The preparation of these items are based on [57]. Lastly, Section (D) includes 16
questions on organisational performance, including the balanced scorecard (BSC) which is used to measure the organisational performance, which covers four perspectives namely, (financial perspective, customer perspective, internal process perspective and learning & growth perspective). Each perspective includes four items. The preparation of these items is based on [58], the exception of the internal processes perspective has been relied upon [58] ؛ [59]. The five-point Likert scale was used from 1 strongly disagrees, 2 disagrees, 3 neutral, 4 agrees, and 5 strongly agrees for measuring the statement of each respective sub-question.
MIS Indicators are divided into six variables to reflect the complex role and relationship on these indicators. The variables related to the MIS include (system quality, information quality, service quality, use of system, user satisfaction and net benefits). Each variable has four items. The variables related to the MIS indicators are described in detail in Table 1.
Table1: Summary Items for MIS Indicators
Variables Items References
System Quality
1. The MIS in my company is easy to use.
2. The functions of the MIS in my company meet my requirements.
3. The MIS in my company is always available.
4. The MIS in my company is safe.
[51]
[55]
[54]
[56]
Information Quality
1. The MIS in my company presents information in a useful format and is understandable.
2. The MIS in my company often presents information at a time suitable for its use.
3. The MIS in my company provides more current (up-to-date) information.
4. The MIS in my company provides the beneficiaries with accurate information.
[55]
[52]
[53]
[56]
Service Quality
1. The response time of the MIS in my company is good.
2. The MIS in my company provides a decent service for users.
3. The service quality of the MIS in my company affects the extent to which the system can be used.
4. My company has specialists in MIS to address technical problems and emergencies if any.
[55]
[53]
[54]
[56]
Use of System
1. I often use the MIS applied in my company.
2. I am very interested in the process of continuing to use the MIS in my company
3197 to accomplish the tasks entrusted to me.
3. The human and material resources supporting the MIS in my company have helped its success.
4. The number of participants in the use of MIS in my company has been constantly increasing since its inception.
[53]
[54]
User Satisfaction
1. Using my company's MIS helps improve productivity.
2. The MIS in my company is very efficient.
3. The MIS in my company is flexible enough.
4. I am satisfied with the accuracy and objectivity of my company's MIS.
[55]
[54]
[53]
[51]
Net Benefits
1. Using the MIS in my company helps reduce the time allotted to accomplish my tasks.
2. Using the MIS in my company will improve my job performance.
3. The application of the MIS in my company helps increase productivity.
4. The MIS in my company enhances the effectiveness of my job.
[56]
[51]
The purpose for the mentioned questions in the questionnaire is to support the hypothesis of the relationship between the basic MIS indicators (system quality, information quality, service quality, use of system, user satisfaction and net benefits) with the organisational performance.
TQM covers six measures, namely the practice of leadership, customer focus, human resource management, strategic planning, process management, and information & analysis. Each variable includes four items. These items on the scale are divided as is shown in Table 2.
Table2: Summary Items for TQM
Variables Items
The Practices of Leadership
1. Senior management in my company has similar beliefs about my company's future direction.
2. Senior management in my company often cares about changes and supports the implementation of a culture of improvement, learning and innovation to achieve "excellence".
3. Employees in my company have the opportunity to participate in the implementation of the change procedures required.
4. My company has a high level of target unit at the individual and department level without any barriers.
Customer Focus
1. My company constantly gets input from customers to identify and meet their needs and expectations.
2. My company has close relationships with its customers and works to create easy channels to communicate with them.
3. My company constantly listens to customer's complaints and works to solve them first hand.
3198 Human Resource
Management
1. My company conducts ongoing training programmes to develop staff capabilities including jobs planning.
2. My company is interested in measuring employee satisfaction periodically and regularly.
3. My company runs two-way communication from "top to bottom" and "bottom to top".
4. My company always cares about maintaining a working environment to ensure the health and safety of all employees.
Strategic Planning
1. My company establishes a clear vision supported by all employees to determine the direction of its future business.
2. My company uses comprehensive planning tools that contribute to the review of short and long-term goals.
3. My company pays great attention to developing its plans, policies and objectives to meet the aspirations of all stakeholders and the community.
4. My company adopts a major strategy with the approval of senior management covering all operations and at all levels.
Process Management
1. My company maintains clear and documented instructions that are understood by all employees about the procedures.
2. My company adopts advanced statistical methods in improving processes and reducing contrast.
3. My company continues to establish strategic partnerships with suppliers.
4. My company has a supplier evaluation guide and rating according to internationally accepted performance standards.
Information & Analysis
1. My company uses an effective performance measurement system to assess overall organisational performance.
2. Data and information about my company's performance are always available to the relevant parties.
3. The senior management of my company meets regularly to determine its performance and use it as a basis for future decisions.
4. My company compares consistently with similar companies in the field of work.
Source: Adapted from D.Prajogo & A.Sohal, 2006 [57].
The purpose of the mentioned questions in the questionnaire is to support the hypothesis on the relationship of TQM which mediates the relationship between MIS indicators and organisational performance.
3199
Table3: Summary Items for Organisational Performance
Variables Items
Financial Perspective
1. My company is prioritising programmes that are very effective in cost containment.
2. My company is very effective in maintaining spending.
3. My company has sufficient funds to provide service programmes.
4. My company has a clear vision of the process of allocating financial resources proportionately across programmes.
Customer Perspective
1. My company is constantly working to meet the expectations of its customers.
2. There has been significant improvement in the quality of my company's products.
3. There has been significant improvement in my company regarding the timing of meeting the needs of its customers.
4. The demand for my company's products is growing significantly.
Internal Process Perspective
1. My company practices improved methods in its planning processes.
2. My company is interested in improving quality control processes.
3. My company takes a broad interest in its policies and procedures.
4. My company seamlessly connects communications across all organisational levels.
Learning & Growth Perspective
1. My job is directly related to my area of speciality.
2. My job gives me a sense of accomplishment.
3. In my company, I received enough information to meet the requirements of my assigned task.
4. My company provides the training I need to meet my job requirements.
Source: Adapted from V.Y. Blackmon, 2008 [58]. And C. Mafini & D.R. Pooe, 2013[59].
The purpose of the questions mentioned in the questionnaire is to support the hypothesis on the relationship of MIS indicators with the organisational performance. Also, this is to support the hypothesis on the relationship of TQM with the organisational performance.
6. RESULTS
This section discusses the findings obtained from the data analysis. The section outlines the process of data preparation and data screening. It also provides a description of the participants. The current study used Structural Equation Modeling (SEM) techniques for further data analysis. Finally, the results of the hypothesis testing are offered.
6.1 Detection Of Missing Data
In the present study, 250 questionnaires were distributed and 219 questionnaires were returned during data collection process. This implies a response rate of 87.6%. According to [60] a response rate less than 50% shows a minority of the response rate which may lead to incorrect generalisation of the study results of the population. For the current study, the response rate is higher than 50%. Thus, it can be considered sufficient for the generalisation of the results for the current study. However, during the initial screening of the data collected, 4 questionnaires were found to contain missing values.
6.2Detection Of Outliers
3200 were detected through Mahalanobis distance statistic using AMOS 21 [45]. The results of the Mahalanobis distance test showed 14 observations out of which 215 were considered as outliers.
The14 observations were considered
outliers and were eliminated from the data before proceeding to the next stage of data analysis. The results of the Mahalanobis distance test are given in Table 4. Thus, 201 questionnaires were subsequently used for final data analysis.
Table4: Observations Farthest From the Centroid (Mahalanobis Distance)
Observation Number Mahalanobis d-squared p1 p2
195 99.770 0.000 0.000
178 89.114 0.000 0.000
189 85.474 0.000 0.000
132 83.694 0.000 0.000
33 82.134 0.000 0.000
187 81.835 0.000 0.000
111 78.845 0.000 0.000
129 77.786 0.000 0.000
88 76.154 0.000 0.000
38 73.438 0.000 0.000
12 71.039 0.000 0.000
185 69.868 0.000 0.000
130 69.612 0.000 0.000
174 69.221 0.000 0.000
6.3 Demographic Of Respondents
The employee profile of the 201 respondents is illustrated in Table 5. It shows that there are more male employees (77.1%) than their female counterparts (22.9%). In terms of age, a majority with 58.2% of the total respondents is below 30 years old followed by (29.4%) aged 31-40 years old. The other age groups are distributed as follows: 41-50 (10.9%), and above 50 (1.5%). Majority of the respondents (60.7%) are Bachelor degree holders, (29.1%) with professional qualification level, Baccalaureate / Diploma holders, (36.3), (3%) Master holders and no one holds a PhD doctorate. In terms of experience, (39.3%) of the
3201
Table 5: Demographic Profile of Respondent
Profile Categories Frequency Percent
Gender Male 155 77.1
Female 46 22.9
Age
Below 30 Years 117 58.2
31-40 Years 59 29.4
41-50 Years 22 10.9
Above 5 0
Years 3 1.5
Education
Baccalaureate / Diploma 73 36.3
Bachelor Degree/Professional Qualification 122 60.7
Master Degree 6 3
PhD Degree 0 0
Experience
Less than 5 Years 79 39.3
6 - 10 Years 55 27.3
11 - 15 Years 40 19.9
61 - 20 Years 19 9.5
Above 2 0 Years
8 4
Level of job position
Manager of Unit or Section 149 74.1
Manager of Department 42 20.9
General Manager/ Deputy General Manager / Manager
of Division 10 5
Length of job position
Less than 2 Years 59 29.3
3 - 5 Years 59 29.3
6 - 10 Years 49 24.4
Above 1 0
Years 34 17
6.4 Reliability Analysis
[image:10.612.87.511.114.352.2]Cronbach's alpha is used to examine the reliability of the internal consistency of the constructs. A cut-off point of 0.70 in the alpha's value which indicates an acceptable degree of reliability of the construct [46].
Table 6 shows the results of the pilot testing and found it to be consistent. The SPSS software version 24 is used for estimating the internal consistency of the instrument. Results indicated that the reliability of each construct is above a threshold value of 0.70. This indicates the internal consistency of the questionnaire for the current study.
Table 6: Result of Reliability Analysis
Sr. Dimension Alpha (α) No. of items
1 System Quality 0.837 4
2 Information Quality 0.847 4
3 Service Quality 0.784 4
4 Use of System 0.890 4
5 User Satisfaction 0.791 4
6 Net Benefits 0.817 4
7 MIS 0.928 24
8 TQM 0.900 24
3202
7. MEASUREMENT MODEL
In this present research, SEM was utilised to test the measurement and structural model using AMOS 21 software. As a prerequisite for testing the relationship of the obvious item with their respective latent constructs, the confirmatory factor analysis (CFA) was performed as recommended by [61]. The findings showed that all the values are within the accepted range [62]. The measurement model was tested in two steps. First, all measurement models were examined individually with the latent constructs of system
quality, information quality, service quality, use of system, user satisfaction, net benefits, TQM and organisational performance.
The results suggested that items SQ31, SQ4, US1, NB4, CF1, HR2, PM1, IA2, CP1, CP4, IP2, IP4 and LG1 were found to have an
unacceptable low factor loading of less than 0.5.
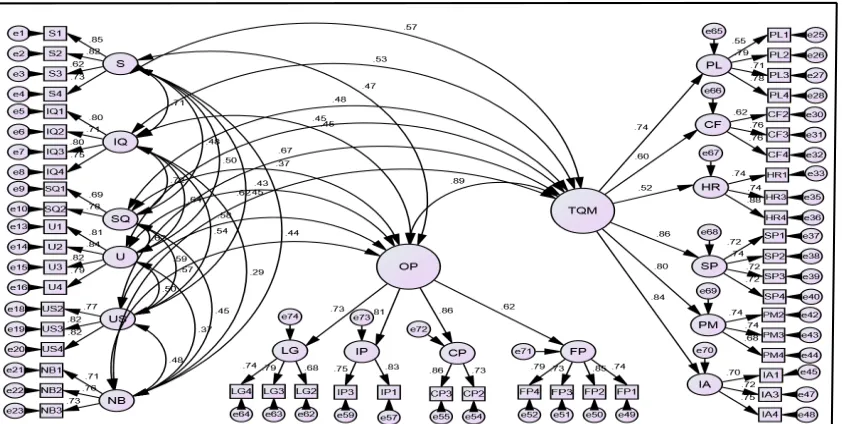
[image:11.612.91.512.290.502.2]Consequently, these factors were also dropped from the analysis. Then, all the measurement models were tested jointly till fruition on the model fitness and validity and reliability issue. Figure 2 shows the results for CFA.
Figure 2: Overall Measurement Models of All Constructs
The results showed there is sufficient improvement in the fit values of the model with df=713. The Chi square for this model is χ2=1646.647, χ2/df=1.388, RMR=0.067,
SRMR=0.0539, CFI=0.909, TLI=0.903 and RMSEA=0.044, which demonstrates the fitness of the model as presented in Table 7.
Table 7: Overall Measurement Model
Statistics Fit Indices Level of Acceptance Obtained Model fitness value
Absolute Fit
χ2 P>0.05 1646.647
DF 1186
CMIN/DF <5 1.388
RMR <0.8 0.067
SRMR <0.8 0.0539
Incremental Fit CFI TLI >0.90 >0.90 0.909 0.903
Parsimony Fit RMSEA <0.8 0.044
[image:11.612.84.514.600.694.2]3203
7.1 Convergent Validity
Convergent validity is described as the level agreed upon by many of the items that measure the same concept [63]. As suggested by [45], the construct convergent validity can be evaluated by using the item loadings, average variance extracted (AVE) and composite reliabilities (CR) of the construct. All the item loadings must be more than 0.50 as recommended by [64]. The AVE of every construct must be above 0.50 based on [65]. In addition, the CR values represent the level to
[image:12.612.84.503.286.384.2]which the construct indicators have discovered the latent variable which must be above 0.70 as recommended by [46]. Table 6 displayed that the values of AVE for all the constructs were larger than 0.50 thus indicating all the constructs have sufficient convergent validity. Also, Table 8 displayed that all the constructs have an acceptable reliability ranging from 0.706 to 0.889 as they are larger than 0.70. Hence, this research does not violate the constructs convergent validity.
Table 8: Convergent Validity Analysis
Constructs AVE CR
System Quality 0.577 0.843
Information Quality 0.583 0.848
Service Quality 0.546 0.706
Use of System 0.667 0.889
User Satisfaction 0.641 0.842
Net Benefits 0.540 0.778
TQM 0.546 0.874
Organisational Performance 0.578 0.843
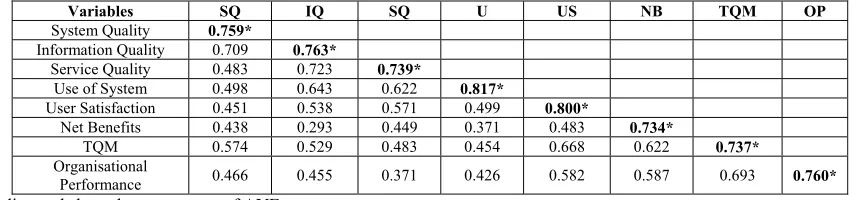
7.2 Discriminant Validity
Discriminant validity is the degree in which the items of the latent construct is really different from all the other latent constructs items [45] ; [66]. There are many ways to establish discriminant validity. The first criterion indicates that the value of inter construct correlation should be less than 0.85 in order to establish the discriminant validity [46]. A second criterion is that the square root of AVE must be larger than all inter-construct correlations of the respective construct [64].
[image:12.612.91.519.574.674.2]Table 9 explains the squared inter-construct correlation of each variable and AVE. The findings denote that all the constructs have sufficient discriminant validity as the square root of AVE is higher than the inter-construct correlation of each variable and the values of inter construct are minus 0.85. This means the findings provide enough evidence of the constructs discriminant validity.
Table 9: Discriminant Validity Analysis
Variables SQ IQ SQ U US NB TQM OP
System Quality 0.759*
Information Quality 0.709 0.763*
Service Quality 0.483 0.723 0.739*
Use of System 0.498 0.643 0.622 0.817*
User Satisfaction 0.451 0.538 0.571 0.499 0.800*
Net Benefits 0.438 0.293 0.449 0.371 0.483 0.734*
TQM 0.574 0.529 0.483 0.454 0.668 0.622 0.737*
Organisational
Performance 0.466 0.455 0.371 0.426 0.582 0.587 0.693 0.760*
3204
7.3 Hypothesis Testing
SEM is utilised to provide a path analysis for exogenous and endogenous variables by AMOS 21. Figure 3 shows the relationship between MIS indicators and TQM to examine whether or not there is a statistically significant relationship. Each path presents a total variation clarified in the endogenous variable with
observance on the exogenous variables. The findings display the significant model fit Chi square for this model which is χ2= 1.818, DF=1, RMR=0.024 it should be near 0, SRMR=0.0235 which should also be near 0, TLI=0.947 which is near to 1, CFI=0.998 is also near to 1 represents a perfect fit, RMSEA=0.064 from 0.05 to 0.08 represents modesty in model.
Figure 3: Results of structural model
First hypothesis states that H1: System quality is positively related to organisational performance. Table 10 shows that path H1: System quality Organisational performance have an unstandardised estimate of -0.086, standardised path coefficient of -0.12, standard error of 0.040, and the critical ratio was
-2.134. The hypothesis was established to test the positive relationship. For this reason the H1 has been rejected and the study establishes a negative relationship between system quality and organisational performance.
Table 10: Hypothesis results
Path Estimate S.E. C.R. P Label
OP <--- S -0.086 0.040 -2.134 0.033 Not Supported
OP <--- IQ 0.090 0.040 2.280 0.023 Supported
OP <--- SQ -0.072 0.036 -1.980 0.048 Not Supported
OP <--- U -0.073 0.037 -2.001 0.045 Not Supported
OP <--- US 0.098 0.048 2.040 0.041 Supported
OP <--- NB 0.175 0.050 3.506 *** Supported
TQM <--- S 0.118 0.035 3.373 *** Supported
TQM <--- IQ 0.073 0.035 2.087 0.037 Supported
TQM <--- SQ -0.073 0.032 -2.292 0.022 Not Supported
TQM <--- U 0.076 0.032 2.372 0.018 Supported
TQM <--- US 0.233 0.039 5.920 *** Supported
TQM <--- NB 0.163 0.043 3.821 *** Supported
OP <--- TQM 0.729 0.079 9.171 *** Supported
Second hypothesis states that H2: Information quality is positively related to organisational performance. Table 10 shows that path H2: Information quality Organisational
3205 0.05. This proves that there is sufficient evidence to agree to the study hypothesis. Consequently, H2 was accepted. The research established a direct relationship between information quality and organisational performance.
Third hypothesis states that H3: Service quality is positively related to organisational performance. Table 10 shows that path H3: Service quality Organisational performance have an unstandardised estimate of -0.072, standardised path coefficient of -0.11, standard error of 0.036, and the critical ratio was -1.980. The hypothesis was established to test the positive relationship. For this reason the H3 has been rejected and the study establishes a negative relationship between service quality and organisational performance.
Fourth hypothesis states that H4: Use of MIS is positively related to organisational performance. Table 10 shows that path H4: Use of system Organisational performance have an unstandardised estimate of - 0.073, standardised path coefficient of -0.11, standard error of 0.037, and the critical ratio was -2.001. The hypothesis was established to test the positive relationship. For this reason the H4 has been rejected and the study established a negative relationship between the use of system and organisational performance.
Fifth hypothesis states that H5: User satisfaction is positively related to organisational performance. Table 10 shows that path H5: User satisfaction Organisational performance have an unstandardised estimate of 0.098, standardised path coefficient of 0.13, standard error of 0.048, and the critical ratio was 2.040 with a p value of 0.041, which is less than 0.05. This proves there is sufficient evidence to agree to the study hypothesis. Consequently, H5 was accepted. The study established a direct relationship between user satisfaction and organisational performance.
Sixth hypothesis states that H6: Net benefits are positively related to organisational performance. Table 10 shows that path H6: Net benefits Organisational performance have an unstandardised estimate of 0.175, standardised path coefficient of 0.20, standard error of 0.050, and the critical ratio was 3.506 with a p value of 0.000, which is less than 0.05.
This proves there is sufficient evidence to agree to the study hypothesis. Consequently, H6 was accepted. The study established a direct relationship between the net benefits and organisational performance.
Seventh hypothesis states that H7: System quality is positively related to TQM. Table 10 shows that path H1: System quality TQM have an unstandardised estimate of 0.118, standardised path coefficient of 0.20, standard error of 0.035, and the critical ratio was 3.373 with a p value of 0.000, which is less than 0.05. This proves there is sufficient evidence to agree to the study hypothesis. Consequently, H7 was accepted. The research established a direct relationship between system quality and TQM.
Eighth hypothesis states that H8: Information quality is positively related to TQM. Table 10 shows that path H8: Information quality TQM have an unstandardised estimate of 0.073, standardised path coefficient of 0.13, standard error of 0.035, and the critical ratio was 2.087 with a p value of 0.037, which is less than 0.05. This proves there is sufficient evidence to agree with the study hypothesis. Consequently, H8 was accepted. The research established a direct relationship between information quality and TQM.
Ninth hypothesis states that H9: Service quality is positively related to TQM. Table 10 shows that path H9: Service quality TQM have an unstandardised estimate of -0.073, standardised path coefficient of -0.13, standard error of 0.032, and the critical ratio was -2.292. The hypothesis was established to test the positive relationship. For this reason, the H9 has been rejected and the research established a negative relationship between service quality and TQM.
3206 Eleventh hypothesis states that H11: User satisfaction is positively related to TQM. Table 10 shows that path H11: User satisfaction TQM have an unstandardised estimate of 0.233, standardised path coefficient of 0.36, standard error of 0.039, and the critical ratio was 5.920 with a p value 0.000, which is less than 0.05. This proves there is sufficient evidence to agree with the study hypothesis. Consequently, H11 was accepted. The research established a direct relationship between user satisfaction and TQM.
Twelveth hypothesis states that H12: Net benefits are positively related to TQM. Table 10 shows that path H12: Net benefits TQM have an unstandardised estimate of 0.163, standardised path coefficient 0.22, standard error of 0.043, and the critical ratio was 3.821 with a p value 0.000, which is less than 0.05. This proves there is sufficient evidence to agree with the study hypothesis. Consequently, H12 was accepted. The research established a direct relationship between net benefits and TQM.
Thirteenth hypothesis states that H13: TQM is positively related to organisational performance. Table 10 shows that path H13: TQM Organisational performance have an unstandardised estimate of 0.729, standardised path coefficient 0.60, standard error of 0.079, and the critical ratio was 9.171 with a p value 0.000, which is less than 0.05. This proves there is sufficient evidence to agree with the study hypothesis. Consequently, H13 was accepted. The study established a direct relationship between TQM and organisational performance.
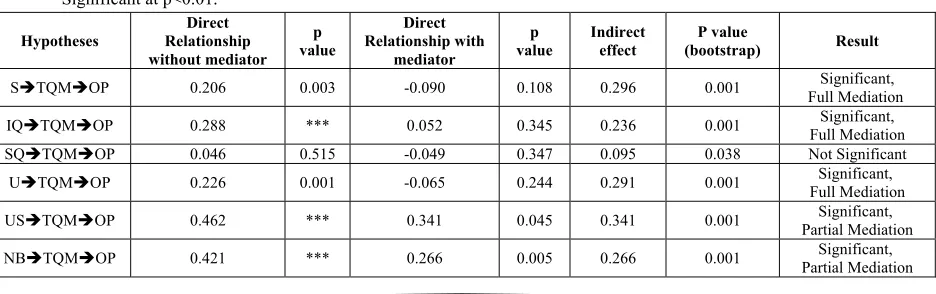
The fourth objective of the current study was to examine the mediating role of TQM in the
relationship between MIS indicators and organisational performance at Missan Oil Company. In this study, all direct effects were investigated by using SEM. In addition, the study calculated indirect effects to test the mediation of TQM between MIS indicators and organisational performance. Therefore, the hypotheses regarding the suggested mediation impacts of TQM in the empirical test were introduced as follows: H14, H15, H16, H17, H18 and H19. TQM mediates the relationship between MIS indicators (system quality, information quality,
service quality, use the system, user satisfaction, and net benefits) and organisational performance.
[image:15.612.71.544.595.739.2]The mediation analysis was done in two stages as prescribed by [67]. In the first stage, direct relationships without mediators were calculated. Thus, the direct relationship of system quality and organisational performance usage was tested during the first stage to test Hypothesis H14. Table 11 shows the results of the mediation analysis. The results indicated that the direct effect of S OP was significant at b = 0. 206 with a p value of 0.003, which is less than 0.05. In the second stage, mediator was entered in the model and indirect effect was calculated. The indirect effect of path STQM OP was 0.296. Furthermore, to test the significance of the indirect path, the study used bootstrapping for the significance of the indirect effects as prescribed by [67]. Results indicated that the indirect path was significant as the p value was 0.001. This p value is less than 0.05. Thus, hypothesis H14 was accepted. Moreover, the mediation is full as the direct effect was significant before mediation but not significant after entering mediation in the model.
Table 11: Mediation Analysis
*** Significant at p<0.01. Hypotheses
Direct Relationship without mediator
p value
Direct Relationship with
mediator
p value
Indirect effect
P value
(bootstrap) Result
STQMOP 0.206 0.003 -0.090 0.108 0.296 0.001 Full MediationSignificant,
IQTQMOP
0.288 *** 0.052 0.345 0.236 0.001 Full MediationSignificant,
SQTQMOP
0.046 0.515 -0.049 0.347 0.095 0.038 Not Significant
UTQMOP
0.226 0.001 -0.065 0.244 0.291 0.001 Full MediationSignificant,
USTQMOP
0.462 *** 0.341 0.045 0.341 0.001 Partial MediationSignificant,
NBTQMOP
3207 Thus, the direct relationship between information quality and organisational performance usage was tested at the first stage to test Hypothesis H15. Table 11 shows the results of the mediation analysis. The results indicated that the direct effect of IQ OP was significant at b = 0.288 with a p value less than 0.05. In the second stage, mediator was entered in the model and indirect effect was calculated. The indirect effect of path IQ TQM OP was 0.236. Furthermore, to test the significance of the indirect path, the study used bootstrapping for the significance of the indirect effects as prescribed by [67]. Results indicated that the indirect path was significant as the p value was 0.001. This p value is less than 0.05. Thus, hypothesis H15 was accepted and arising from there, exists a full mediation of TQM between information quality and organisational performance.
The direct relationship of service quality and organisational performance usage was tested during the first stage to test Hypothesis H16. Table 11 shows the results of the mediation analysis. The results indicated that the direct effect of SQ OP was insignificant at b = 0.046 with a p value 0.515, which is above than 0.05. According to [68] the independent variable SQ must be significantly related to the dependent variable OP. Thus, hypothesis H16 was rejected.
The direct relationship on the use of MIS and organisational performance usage was tested during the first stage to test Hypothesis H17. Table 11 shows the results of the mediation analysis. The results indicated that the direct effect of U OP was significant at b = 0.226
with a p value 0.001, which is less than 0.05. In the second stage, mediator was entered in the model and indirect effect was calculated. The indirect effect of path U TQM OP was 0.291. Furthermore, to test the significance of the indirect path, the study used bootstrapping for the significance of the indirect effects as prescribed by [67]. Results indicated that the indirect path were significant as the p value was 0.001. This p value is less than 0.05. Thus, hypothesis H17 was accepted. Thus, the full mediation of TQM exists between the use of MIS and organisational performance.
Thus, the direct relationship of user satisfaction and organisational performance usage was tested at first stage to test Hypothesis H18. Table 11 shows the results of the mediation analysis. The results indicated that the direct effect of US OP was significant at b = 0.462 with a p value less than 0.05. In the second stage, mediator was entered in the model and indirect effect was calculated. The indirect effect of path US TQM OP was 0.341. Furthermore, to test the significance of the indirect path, the study used bootstrapping for the significance of the indirect effects as prescribed by [67]. Results indicated that the indirect path were significant as the p value was 0.001. This p value is less than 0.05. Thus, hypothesis H18 was accepted. Moreover, the mediation is partial as the direct effect was significant before mediation and after entering mediation in the model.
Thus, the direct relationship of net benefits and organisational performance usage was tested at first stage to test Hypothesis H19. Table 11 shows the results of the mediation analysis. The results indicated that the direct effect of NB OP was significant at b = 0.421
with a p value less than 0.05.
In the second stage, mediator was entered in the model and indirect effect was calculated. The indirect effect of path NB
TQM OP was 0.266. Furthermore, to test the significance of the indirect path, the study used bootstrapping for the significance of the indirect effects as prescribed by [67]. Results indicated that the indirect path were significant as the p value was 0.001. This p value is less than 0.05. Thus, hypothesis H19 was accepted. Moreover, the mediation is partial as the direct effect was significant before mediation and after entering mediation in the model.
7.4 SUMMARY OF HYPOTHESES
FINDINGS
3208 theoretically specified model fits the sample data.
Table 12: Summary of Hypotheses Findings
Hypothesis Results
H1: System quality is positively related to organisational performance. Not Supported
H2: Information quality is positively related to organisational performance. Supported
H3: Service quality is positively related to organisational performance. Not Supported
H4: Use of MIS is positively related to organisational performance. Not Supported
H5: User satisfaction is positively related to organisational Performance. Supported
H6: Net benefits are positively related to organisational performance. Supported
H7: System quality is positively related to TQM. Supported
H8: Information quality is positively related to TQM. Supported
H9: Service quality is positively related to TQM. Not Supported
H10: Use of MIS is positively related to TQM. Supported
H11: User satisfaction is positively related to TQM. Supported
H12: Net benefits are positively related to TQM. Supported
H13: TQM is positively related to organisational performance. Supported
H14: TQM mediates the relationship between system quality and organisational performance. Supported
H15: TQM mediates the relationship between information quality and organisational. Supported
H16: TQM mediates the relationship between Service quality and organisational performance. Not Supported
H17: TQM mediates the relationship between use of MIS and organisational performance. Supported
H18: TQM mediates the relationship between user satisfaction and organisational performance. Supported
H19: TQM mediates the relationship between net benefits and organisational performance. Supported
8. CONCLUSION
Based on research and data processing which has been carried out in accordance with the methods described, it can
be concluded as follows:
1. The results indicated that MIS indicators (information quality, user satisfaction and net benefits) positively influence organizational performance. The result of the research is in line with the findings of the [21] ; [39] ; [69].
2. The results of this study indicated a negative
3209 3. The findings of the current research revealed that MIS indicators (system quality, information quality, use of system, user satisfaction and net benefits) are more relevant to enhance TQM at Missan Oil Company. The result of the research is in line with the findings of the [24] ; [25] ;[30] ; [71].
4. The current study findings indicated that service quality is not related to TQM at Missan Oil Company. Because the MIS at Missan Oil Company provides a low level of service. This result implicitly correlates with the findings of [72] who referred to a significant gap remains between the successes with TQM for the information system in many companies.
5. The current research found that TQM influences on organisational performance. The results are consistent with the existing literature, such as the studies of [33] ; [73] ; [74] ; [75] ; [76] ; [77], which stated that the implementation of TQM practices leads to improved performance and increased competitiveness by the organisations.
6. This study attempt to examine the mediate role of TQM in the relationship between MIS indicators and organisational performance. MIS positively connects to TQM [25] which is positively related to organisational performance [76]. Also the findings revealed that the impact of system quality, information quality, use of system, user satisfaction and net benefits on organisational performance was mediated by TQM while service quality was not mediated by TQM at Missan Oil Company. The findings of this research is in line with the results of [11] ; [40] ; [41] ; [43] which proved the role of mediation for TQM in improving organisational performance.
ACKNOWLEDGEMENT
The authors are thankful to the anonymous reviewers whose constructive suggestions and corrections have improved the quality of this paper. The authors are also grateful to Missan Oil Company. The facilities provided by the Sultan Idris Education University (UPSI), are gratefully acknowledged.
REFERENCES:
[1] S. G. Gonfa, “Management Information Systems Availability and Utilization as Factors Influencing Managers in Decision-Making : The Case of Commercial Banks in Ethiopia,” Addis Ababa University, 2013.
[2] C. Dias, “Corporate portals: A literature review of a new concept in information management,” Int. J. Inf. Manage., vol. 21, no. 4, pp. 269–287, 2001.
[3] M. Franco and M. Garcia, “Drivers of ICT acceptance and implementation in micro-firms in the estate agent sector: influence on organizational performance,” Inf. Technol. Dev., vol. 1102, no. September, pp. 1–23, 2017. [4] P. Thomas, “Information systems
success and technology acceptance within a government organization,” University of North Texas, 2008. [5] A. A. Belkur, R. Mehta, M. S. Shafter,
and A. A. Amar, “The Role of Management Information Systems in Increasing the Effectiveness of Managerial Decision Making . The Case of the General Company for Cement and Building Materials Study in Libya,” Int. J. Eng. Res. Technol., vol. 6, no. 01, pp. 92–105, 2017.
[6] C. L. Obara, “Management Information Systems And Corporate Decision – Making : A Literature Review,” Int. J. Manag., vol. 2, no. 3, pp. 78–82, 2013. [7] M. M. Ahmad and R. Elhuni, “Critical
quality factors for successful TQM implementation in Libyan oil and gas sector,” Benchmarking An Int. J., vol. 21, no. 5, pp. 713–733, 2014.
[8] S. Mahmood, F. Qadeer, and A. Ahmad, “The role of organizational learning in understanding relationship between total quality management and organizational performance.,” Pakistan J. Commer. Soc. Sci., vol. 9, no. 1, pp. 282–302, 2015. [9] B. O. Ehigie and E. B. McAndrew,
“Innovation, diffusion and adoption of total quality management (TQM),” Manag. Decis., vol. 43, no. 6, pp. 925– 940, 2005.
3210 [11] M. Demirbag, L. Koh, E. Tatoglu, and S.
Zaim, “TQM and market orientation’s impact on SMEs’ performance,” Ind. Manag. Data Syst., vol. 106, no. 8, pp. 1206–1228, 2006.
[12] H. S. Al-Dhaafri, A. K. Al-Swidi, and R. Z. Bin Yusoff, “The mediating role of TQM and organizational excellence, and the moderating effect of entrepreneurial organizational culture on the relationship between ERP and organizational performance,” TQM J., vol. 28, no. 6, pp. 991–1011, 2016.
[13] O. E. M. Khalil, “Information Systems and Total Quality Management: Establishing the Link,” in Proceedings of the 1994 computer personnel research conference on Reinventing IS: managing information technology in changing organizations: managing information technology in changing organizations, 1994, no. 1, pp. 173–183.
[14] A. K. Saddam, “A study on the relationship between perceived strategic human resource management and organizational performance with organization behavior as the mediator,” Universiti Teknologi Malaysia, 2017. [15] Y. H. Al-Mamary, A. Shamsuddin, and
N. Aziati, “Factors Affecting Successful Adoption of Management Information Systems in Organizations towards Enhancing Organizational Performance,” Am. J. Syst. Softw., vol. 2, no. 5, pp. 121–126, 2014.
[16] Y. Munirat, I. M. Sanni, and A. O. Kazeem, “The Impact of Management Information System (Mis) on the Performance of Business Organization in Nigeria,” Int. J. Humanit. Soc. Sci. Educ., vol. 1, no. 2, pp. 76–86, 2014. [17] J. A. O’Brien, Introduction to
information systems: An internetworked Enterprise Perspective, 2nd ed. New York: McGraw Hill, 1998.
[18] O. P. Osodo and Beatrice Jemaiyo, “Relationship between the use of management information systems and employee job performance: evidence from kenindia assurance company limited,” Br. J. Mark. Stud., vol. 3, no. 5, pp. 61–70, 2015.
[19] A. O. Kehinde and A. S. Yusuf., “Management information system as a catalyst to organisational performance in
the 21 st century: A study of selected banks in Nigeria,” Am. J. Bus. Manag., vol. 1, no. 1, pp. 12–17, 2012.
[20] N. P. Ndlovu, “The Role of Management Information Systems in Measuring Organisational Performance in the KwaZulu-Natal Department of Arts & Culture,” Stellenbosch University, 2015. [21] Y. H. Al-Mamary, A. Shamsuddin, and
N. Aziati, “The Pilot Test Study of Relationship Between Management Information Systems Success Factors and organizational performance at Sabafon Company in Yemen,” Int. J. U-& E-Service, Sci. Technol., vol. 8, no. 2, pp. 337–346, 2015.
[22] A. Khresat, “The Effect of Management Information System on Organizational Performance : Applied Study on Jordanian Telecommunication Companies,” Inf. Knowl. Manag., vol. 5, no. 6, pp. 45–51, 2015.
[23] D. Agu, Philomena, Ugwu, Joy, Igwegbe, “Effect of Management Information System On Organizational Performance: A Study of 7Up Bottling Company Enugu,” NG-Journal Soc. Dev., vol. 6, no. 1, pp. 1–8, 2017.
[24] M. S. Spencer and L. K. Duclos, “TQM Stress MIS,” Am. J. Bus., vol. 13, no. 1, pp. 59–64, 1998.
[25] C.-C. Lin, H.-M. Chuang, and D.-H. Shih, “Development Stage and Relationship of Mis and Tqm in the E-Business Era,” Int. J. Electron. Bus. Manag., vol. 10, no. 1, pp. 50–60, 2012. [26] L. Y. Fok, W. M. Fok, and S. J.
Hartman, “Exploring the relationship between total quality management and information systems development,” Inf. Manag., vol. 38, no. 6, pp. 355–371, 2001.
[27] F. W. Dewhurst, A. R. Martínez-Lorente, and C. Sánchez-Rodríguez, “An initial assessment of the influence of IT on TQM: a multiple case study,” Int. J. Oper. Prod. Manag., vol. 23, no. 4, pp. 348–374, 2003.
[28] J. Siddiqui and Z. Rahman, “TQM for Information Systems: Are Indian organizations ready?,” Interdiscip. J. Information, Knowledge, Manag., vol. 1, pp. 125–136, 2006.
3211 Systems in Implementing Total Quality Management,” Am. J. Appl. Sci., vol. 9, no. 5, pp. 666–672, 2012.
[30] Z. Almashaqba, “Management Information System and their role in Total Quality Mangement,A Study in qualified industrial zone in Mafraq- Jordan.,” Interdiscip. J. Contemp. Res. Bus., vol. 5, no. 4, pp. 757–776, 2013. [31] S. M. Yusof and E. Aspinwall, “Case
studies on the implementation of TQM in the UK automotive SMEs,” Int. J. Qual. Reliab. Manag., vol. 18, no. 7, pp. 722– 744, 2001.
[32] T. Y. Choi and K. Eboch, “The TQM Paradox: Relations among TQM Practices, Plant Performance, and Customer Satisfaction,” J. Oper. Manag., vol. 17, no. 1, pp. 59–75, 1998. [33] M. Shafiq, F. Lasrado, and K. Hafeez,
“The effect of TQM on organisational performance: empirical evidence from the textile sector of a developing country using SEM,” Total Qual. Manag., vol. 22, no. February, pp. 1–22, 2017. [34] S. Malik, M. Iqbal, R. Shaukat, and J.
Yong, “TQM Practices & Organizational Performance: Evidence From Pakistani SMEs,” Int. J. Eng. Technol., vol. 10, no. 04, pp. 26–31, 2010.
[35] S. Nekoueizadeh and S. Esmaeili, “A study of the impact of TQM on organizational performance of the Telecommunication Industry in Iran,” Eur. Online J. Nat. Soc. Sci., vol. 2, no. 3, pp. 968–978, 2013.
[36] R. Sweis, K. Al Ahmad, G. Al-Dweik, A. Alawneh, and A. A. Hammad, “The relationship between total quality management practices and organisational performance at Jordanian hospitals Ayman Abu Hammad,” Bus. Innov. Res., vol. 10, no. 4, pp. 519–542, 2016. [37] G. Mehralian, J. Nazari, G. Nooriparto,
and R. Hamid, “TQM and organizational performance using the balanced scorecard approach,” Int. J. Product. Perform. Manag., vol. 66, no. 1, pp. 111–125, 2017.
[38] A. Kroll, “Exploring the Link Between Performance Information Use and Organizational Performance: A Contingency Approach,” Public Perform. Manag. Rev., vol. 39, no. 1, pp. 7–32, 2015.
[39] A. Azadeh, V. Salehi, and R. Salehi, “A resilience-based model for performance evaluation of information systems: the case of a gas company,” Enterp. Inf. Syst., vol. 11, no. 9, pp. 1337–1351, 2016.
[40] H. S. Al-Dhaafri, A. K. Al-Swidi, and R. Z. Bin Yusoff, “The mediating role of TQM and organizational excellence, and the moderating effect of entrepreneurial organizational culture on the relationship between ERP and organizational performance,” TQM J., vol. 28, no. 6, pp. 991–1011, 2016.
[41] D. Prajogo and A. Sohal, “The relationship between organization strategy, total quality management (TQM), and organization performance–– the mediating role of TQM,” Eur. J. Oper. Res., vol. 168, pp. 35–50, 2006. [42] M. N. Elham, T. M. Khanjani, and F.
Soltan, “The impact of organizational citizenship behavior on enterprise resource planning success: The mediator role of TQM,” Int. J. Qual. Reliab. Manag., vol. 31, no. 1, pp. 53–65, 2014. [43] G. Mehralian, J. A. Nazari, L. Zarei, and
H. R. Rasekh, “The Effects of Corporate Social Responsibility on Organizational Performance in the Iranian Pharmaceutical Industry: The Mediating Role of TQM,” J. Clean. Prod., vol. 135, no. 1 November, pp. 689–698, 2016. [44] P. Pandey and M. M. Pandey, Research
Methodology: Tools and Techniques. Printed in Romania: Bridge Center, 2015.
[45] J. F. Hair, W. C. Black, B. J. Babin, and R. E. Anderson, Multivariate Data Analysis, 7th ed. New Jersey: Prentice Hall, Upper Saddle River, 2010.
[46] D. Cooper and P. Schindler, Business Research Methods, 12th ed. New York: New Yourk. McGraw-Hill / Irwin, 2013. [47] M. Saunders, P. Lewis, and A. Thornhill,
Research methods for business students, 5th ed. New York: prentice hall, 2009. [48] R. V Krejcie and D. A. Morgan,
“Determining Sample Size for Research Activities,” Educ. Psychol. Meas., vol. 30, no. 0, pp. 607–610, 1970.
3212 1992.
[50] W. H. DeLone and E. R. McLean, “The DeLone and McLean Model of Information Systems Success: A Ten-Year Update,” J. Manag. Inf. Syst., vol. 19, no. 4, pp. 9–30, 2003.
[51] P. B. Seddon and M.-Y. Kiew, “A Partial Test and Development of Delone and Mclean’s Model of IS Success,” Australas. J. Inf. Syst., vol. 4, no. 1, pp. 90–109, 1996.
[52] H. M. F. Almutairi, “Evaluating information system success in public organizations: A theoretical model and empirical validation,” ProQuest Dissertations and Theses. pp. 1–200, 2001.
[53] A. Elmorshidy, “Information Systems (IS) Success in Non-Organizational Contexts: Examining the DeLone & McLean IS Success Model in the Context of an Online Stock Trading Environment,” Claremont Graduate University, 2004.
[54] L. A. Halawi, “Knowledge management systems’ success in knowledge-based organizations: An empirical validation utilizing the DeLone and McLean IS Success Model,” Nova Southeastern University, 2005.
[55] K. F. Allour, “A research study on the relationship between critical success factor management maturity and user satisfaction with ERP implementation projects,” Lawrence Technological University, 2010.
[56] G. H. E. Gay, “A study of technological barriers to Instructor E-Readiness in an online environment,” Nova Southeastern University, 2012.
[57] D. Prajogo and A. Sohal, “The
integration of TQM and
technology/R&D management in determining quality and innovation performance,” Omega, vol. 34, no. 3, pp. 296–312, 2006.
[58] V. Y. Blackmon, “Strategic planning and organizational performance: An investigation using the balanced scorecard in non-profit organizations,” Capella University, 2008.
[59] C. Mafini and D. R. I. Pooe, “Performance measurement in a South African government social services department: A balanced scorecard
approach,” Mediterr. J. Soc. Sci., vol. 4, no. 14, pp. 23–36, 2013.
[60] A. Bryman and E. Bell, Business research methods, 4th editio. Oxford University Press.USA, 2015.
[61] J. Hair, W. Black, B. Babin, and R. Anderson, Multivariate Data Analysis, 7th ed. New Jersey: Prentice Hall, Upper Saddle River, 2010.
[62] B. M. Byrne, “Structural Equation Modeling With AMOS, EQS, and LISREL: Comparative Approaches to Testing for the Factorial Validity of a Measuring Instrument,” Int. J. Test., vol. 1, no. 1, pp. 55–86, 2001.
[63] T. Ramayah, J. W. C. Lee, and J. B. Chyaw, “Network collaboration and performance in the tourism sector,” Serv. Bus., vol. 5, no. 4, pp. 411–428, 2011. [64] C. Fornell and D. F. Larcker, “Structural
Equation Models with Unobservable Variables and Measurement Error: Algebra and Statistics,” J. Mark. Res., vol. 18, no. 3, pp. 382–388, 1981. [65] R. B. Kline, Principles and Practice of
Structural Equation Modeling, 3rd ed. edn Guilford Press. New York. USA.. ISBN, 1965705777, 2010.
[66] J. Arbuckle, IBM SPSS Amos 20 User’s guide. Amos Development Corporation, 2011.
[67] J. F. Hair, C. M. Ringle, and M. Sarstedt, “Partial Least Squares Structural Equation Modeling: Rigorous Applications, Better Results and Higher Acceptance,” Long Range Plann., vol. 46, no. 1–2, pp. 1–12, 2013.
[68] R. M. Baron and D. A. Kenny, “The Moderator-Mediator Variable Distinction in Social Psychological Research: Conceptual, Strategic, and Statistical Considerations,” J. Pers. Soc. Psychol., vol. 51, no. 6, pp. 1173–1182, 1986. [69] M. Salleh, N. Zakaria, and R. Abdullah,
“The influence of system quality characteristics on health care providers’ performance: Empirical evidence from Malaysia,” J. Infect. Public Health, vol. 9, no. 6, pp. 698–707, 2016.
[70] O. G. Ominunu, “Management Information and Accounting System and organizational Performance in Nigeria,” Am. J. Soc. Manag. Sci., vol. 6, no. 1, pp. 1–17, 2015.
3213 Information Systems And Total Quality Management System and their Impact on the Organization performance, Field Study in the General Company for Chemical Industries - Babylon,” Univ. Babylon J., vol. 2, no. 17, pp. 349–372, 2009.
[72] J. J. Dahlgaard, K. Kristensen, G. K. Kanji, H. J. Juhl, and A. S. Sohal, “Quality management practices: A comparative study between East and West,” Int. J. Qual. Reliab. Manag., vol. 15, no. 8, pp. 812–826, 1998.
[73] M. G. Antunes, J. T. Quirós, and M. R. Justino, “Total quality management and quality certification: effects in organisational performance,” Int. J. Serv. Oper. Manag., vol. 29, no. 4, pp. 439– 461, 2018.
[74] R. Jimoh, L. Oyewobi, R. Isa, and I. Waziri, “Total quality management practices and organizational performance: the mediating roles of strategies for continuous improvement,” Int. J. Constr. Manag., vol. 19, no. 2, pp. 162–177, 2019.
[75] V. Singh, A. Kumar, and T. Singh, “Impact of TQM on organisational performance: The case of Indian manufacturing and service industry,” Oper. Res. Perspect., vol. 5, pp. 199– 217, 2018.
[76] E. Sadikoglu and H. Olcay, “The effects of total quality management practices on performance and the reasons of and the barriers to TQM practices in turkey,” Adv. Decis. Sci., vol. 2014, no. 1–17, 2014.