2430
USING FUZZY LOGIC TO ENHANCE THE CLASSIFICATION
AND DIAGNOSING OF HYPERTENSION
SHIRAZ H.E.1,2(*) , NORMA ALIAS1,2
1Ibnu Sina Institute for Scientific and Industrial Research, Universiti Teknologi Malaysia, 81310 Skudai, Johor, Malaysia
2Faculty of Science, Universiti Teknologi Malaysia, 81310 Skudai, Johor, Malaysia
ABSTRACT
High blood pressure, which has a widespread in today's world, is a disease that can cause serious damage to the cardiovascular system. To illustrate, in 1975, 594 million people were diagnosed with hypertension. However, the number has doubled over the last 40 years to become over 1.1 billion in 2015. Moreover, a significant number of patients do not even know they have hypertension due to the inadequate awareness of hypertension symptoms. Because of the difficulty with distinguishing the symptoms of hypertension, fuzzy logic can be utilized as an efficient diagnostic tool. Several research papers have suggested various diagnostic algorithms based on fuzzy logic. Hence, the contribution of this research is to investigate the most recent researches conducted on fuzzy logic for diagnosing hypertension. This will help to enhance the classification, diagnosing method and to overcome the limitations of existing approaches.
Keywords: Fuzzy logic, classification method, diagnosing method, Hypertension, Blood Pressure.
1. INTRODUCTION
Blood pressure (BP) is the force of the blood pushing against walls of the blood vessels (1, 2). Blood pressure is measured in units of millimeters of mercury (mmHg) and characterized always by pair systolic and diastolic readings. The former is the top number of blood pressure reading which is the blood pressure when the heart pumps it around the body (i.e. 128 mmHg) and the latter is the bottom number which is pressure when the heart relaxes and refills with blood (i.e. 83 mmHg). Genetic and environmental factors affect the blood pressure status such as family history, age, gender and race
(3, 4). High blood pressure or hypertension is higher pressure puts extra strain on heart and blood vessels. This happens when the systolic reading is greater than 140 mmHg and the diastolic reading is greater than 90 mmHg. Moreover, hypertension will be classified for three important causes (5):
a. Special Causes happen for special patients such as race, ethnicity and pregnancy.
b. Primary Causes of Hypertension: environmental risk factors, drugs and other substances that impair BP control and genetic and childhood risk factors.
c. Secondary Causes of Hypertension is a cause of other diseases such as kidney disease, tumors or others.
Hypertension poses a serious threat to the human life, with 9.4 million person in the world dying every year as result of the high blood pressure implications (6, 7).
This paper addresses the existing work in the direction of enhancing the hypertension classification and diagnosing methods based on the Fuzzy logic.
2431
Fuzzy logic is based on simulating human thinking and natural activities. It uses all the possible values in the period [0,1] to describe human logic, and it can be used as an effective tool for many control system applications such as transportation, crime investigation, clinical decision support system, improving TV clarity, washing machine among other engineering applications (11, 12).
The contribution of this article is an abbreviated review of fuzzy logic and its application on classification and diagnosis hypertension and to highlight the newest publication on this area.
2. FUZZY LOGIC AND SIMILAR CONCEPTS
This part of this paper highlights some differences between fuzzy logic and similar concepts.
2.1 Fuzzy Logic versus Binary Logic
Binary logic is based on two values, 1 (i.e. true) and 0 (i.e. false). Obviously, these two values do not cover all the possible values in this interval [0, 1]. However, fuzzy logic can encompass all the possible values in the period [0, 1].
Hence, this property better describes all the potential possibilities. For example, when using the binary system to represent the height of people, a specific point is selected as a threshold. Consequently, every person with a height less than this value is considered as short, and any person with a height greater than or equal the agreed upon score is considered tall. The binary system can be written as follows:
𝐼𝑠 𝑆𝑎𝑚 𝑇𝑎𝑙𝑙 ? Yes
No 𝐵𝑖𝑛𝑎𝑟𝑦 𝐵𝑜𝑜𝑙𝑒𝑎𝑛 𝑙𝑜𝑔𝑖𝑐
This assumption includes the threshold value in one of these two groups. However, in real life applications, problems are not that simple. For instance, there are some people with moderate height. Therefore, to describe the height of these people we need another characteristic other than tall or short, such as very tall, tall, average tall, short and very short. So the fuzzy description can be written as follows:
𝐼𝑠 𝑆𝑎𝑚 𝑇𝑎𝑙𝑙 ?
⎩ ⎪ ⎨ ⎪
⎧ Very tall𝑇𝑎𝑙𝑙
𝐴𝑣𝑒𝑟𝑎𝑔𝑒 Short Very Short
⎭ ⎪ ⎪ ⎬ ⎪ ⎪ ⎫
𝐹𝑢𝑧𝑧𝑦 𝐿𝑜𝑔𝑖𝑐
To summarize, the main difference between Binary Logic and fuzzy logic is the definition of their sets. To explain that let X be the universe of discussion and x be an element belonging to this set. In this case:
1. Crisp set A of X is a characteristic function C
of A defined as follows:
C : X → 0,1 where
C x 0,1, if 𝑥 ∈ 𝐴if 𝑥 ∉ 𝐴
2. Fuzzy set A of X is a membership function μ of A defined as follows:
μ : X → 0,1 where
μ x
0, if 𝑥 𝑖𝑠 𝑛𝑜𝑡 𝑖𝑛 𝐴
0 μ x 1, if 𝑥 𝑖𝑠 𝑝𝑎𝑟𝑡ly in A
1, if 𝑥 𝑖𝑠 𝑡𝑜𝑡𝑎𝑙𝑙𝑦 𝑖𝑛 𝐴
The cases show that fuzzy set increases the choices in daily life situations rather than crisp logic which limits the choices to only two (13).
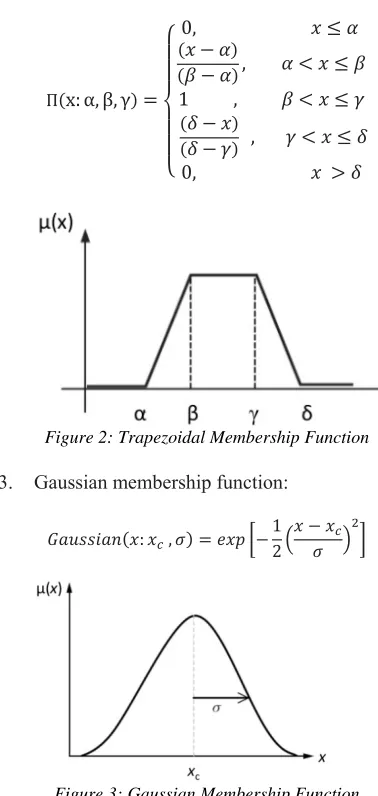
There are many types of membership functions. However, the three common types are Triangular, Trapezoidal and Gaussian membership Functions (14). All these functions are depicted in figure 1, figure 2 and figure 3 respectively.
1. Triangular membership function is representing as follows:
∆ x: α, β, γ, δ
⎩ ⎪ ⎨ ⎪
⎧ 0, 𝑥𝑥 𝛼 𝛼
𝛽 𝛼 , 𝛼 𝑥 𝛽
𝛾 𝑥
𝛾 𝛽 , 𝛽 𝑥 𝛾
2432
Figure 1:Triangular Membership Function
2. Trapezoidal membership function:
Π x: α, β, γ
⎩ ⎪ ⎪ ⎨ ⎪ ⎪
⎧0, 𝑥𝑥 𝛼 𝛼
𝛽 𝛼 , 𝛼 𝑥 𝛽
1 , 𝛽 𝑥 𝛾
𝛿 𝑥
𝛿 𝛾 , 𝛾 𝑥 𝛿
[image:3.612.109.298.248.646.2]0, 𝑥 𝛿
Figure 2:Trapezoidal Membership Function
3. Gaussian membership function:
𝐺𝑎𝑢𝑠𝑠𝑖𝑎𝑛 𝑥: 𝑥 , 𝜎 𝑒𝑥𝑝 1
2
𝑥 𝑥
[image:3.612.319.518.358.407.2]𝜎
Figure 3:Gaussian Membership Function
2.2 Fuzzy Logic versus Probability Theory
Although fuzzy logic and probability theory are based on similar concept, the key difference is based on the meaning. Fuzzy logic is
about the degree of truth, while the probability theory is about estimating the probability of an event.
To elaborate, fuzzy logic quantifies an existing truth or an occurrence that has already happened (i.e. a reality). To illustrate, both can be represented by sets of pairs (a, f(a)), where a is an
element of a subset A from nonempty universal Ω,
while f(a) is an extent to which an event a is likely
to occur in probability theory or it is the degree of truth or membership of a in fuzzy set theory (15).
For example, the score of a student in one exam after papers have been marked can be classified in the degree of success or failure as grade A, B, C, D or F. Similarly, the degree of difficulty for the exam can be described numerically (i.e. 0.7). This means results and discussion can be concluded after having a complete analysis. For instance, according to (16), the membership function for grade A classification is:
μ x
0, if 𝑥 80
x 80
90 80, if 80 𝑥 90
1, if 𝑥 90
On the other hand, the probability theory attempts to describe the uncertainty of the specific event that has yet to took place (i.e. not yet a reality). For example, if we are discussing the grades of a student before the papers have been marked, we will rely only on partial knowledge. For instance, we can say Sam has70% chance to get A in this exam, which is a statement based on partial knowledge (Sam's abilities, speculations etc.)(16).
2.3 Fuzzy Logic vs. Mathematical Modeling
2433
3. MODEL AND METHOD
Fuzzy logic has a noticeable presence in the scientific research. In (17), a considerable effort has been made to enumerate the number of publications in fuzzy logic and its applications. According to (17), the total number of publications related to fuzzy logic was approximately 462 in the 20th century. Nevertheless, this number has almost tripled in 21st century, and the total number of papers in this field has exceeded 1400 different research papers. It is worth mentioning that there are currently several scientific journals dedicated solely to fuzzy logic and its applications.
Moreover, researchers in (18) conducted a systematic literature review using meta-analysis method. Eight different scientific databases have been investigated to identify the research work on
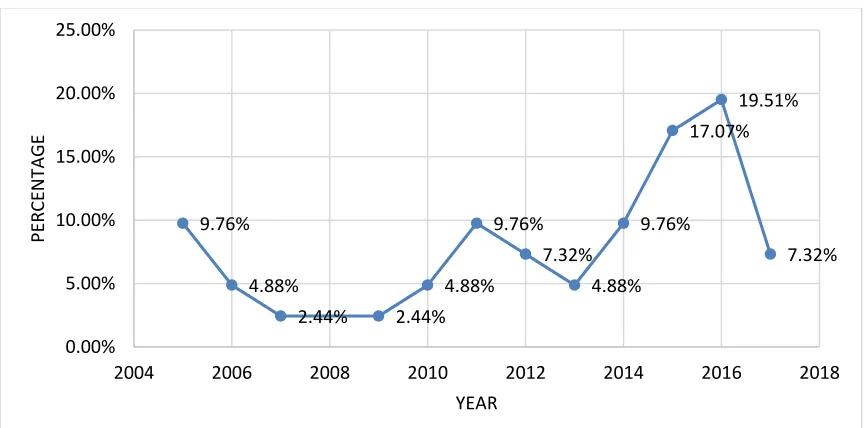
fuzzy methods and its effect on reducing the difficulty of diagnosis. To acquire an accurate result, they included some enclosure and omission criteria discussed thoroughly in their work. Furthermore, they have clustered all qualified articles based on thirteen different factors including author, type of publication, applied fuzzy methods, tools utilized to model the fuzzy system and the impact of applied fuzzy methods to improve diagnosis. Accordingly, Figure 4 demonstrates the percentage of articles about fuzzy logic, according to their criteria, compared to all the articles published in that year in the targeted databases.
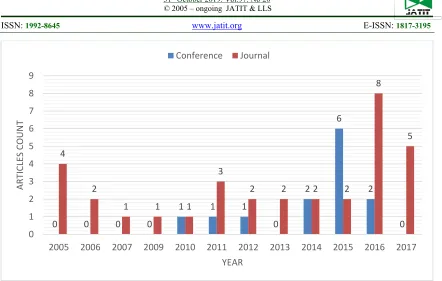
[image:4.612.90.522.331.545.2]Moreover, in Figure 5 they compared the number of papers that have been published in conference proceedings compared to journal articles.
Figure 4:The Percentage Of Published Papers In Fuzzy Logic(18)
9.76%
4.88%
2.44% 2.44%
4.88% 9.76%
7.32% 4.88%
9.76% 17.07%
19.51%
7.32%
0.00% 5.00% 10.00% 15.00% 20.00% 25.00%
2004 2006 2008 2010 2012 2014 2016 2018
PERCENTAGE
2434
[image:5.612.89.531.53.334.2]
Figure 5:Numbers Of Published Papers In Fuzzy Logic (Conference Vs. Journals)(18)
Further research papers have investigated the possibility of utilizing fuzzy logic for diagnosing, forecasting and handling hypertension(19). In the rest of this research, we shall briefly highlight a number of the most relevant work conducted in this area.
3.1 Fuzzy Logic Controller
Proportional Integral and Derivative (PID) controller is widely used in different fields for many years ago. This is because the processes under control used to have simple design with linear
system. In this case the PID has high performance.
However, the PID control system is considered unsatisfactory when the process is complex. Thus, complex problem and nonlinear system need intelligent controller to cope with a wide range of input variations such as fuzzy control system (20).
Fuzzy logic controller is one of the applications of fuzzy logic consists of four conceptual components: knowledge base, fuzzification interface, inference engine, and defuzzification interface
Figure 6:The Percentage Of Published Papers In Fuzzy Logic(20)
As described in (21), fuzzy control system can be used in a variety of medical applications to control injection doses, surgery and physical therapy. Furthermore, it can be used to control the behavior of the cardiovascular system during heart surgery. In relevance to our research focus, it has several applications related to hypertension
management, such as drug administration, and improving the cardiovascular system performance.
3.2 Hypertension Classification
Hypertension is cardiovascular set of symptoms arising from complex and interrelated conditions. The signs of hypertension such as severe
0 0 0 0
1 1 1
0 2
6
2
0 4
2
1 1 1
3
2 2 2 2
8
5
0 1 2 3 4 5 6 7 8 9
2005 2006 2007 2009 2010 2011 2012 2013 2014 2015 2016 2017
ARTICLES
C
OUNT
YEAR
[image:5.612.145.465.540.617.2]2435 headache, fatigue or confusion, vision problems, chest pain, difficulty breathing and so forth often appear before sustainable rise of BP. Therefore, hypertension cannot be classified merely by discrete BP thresholds. Accordingly, the hypertension classification progress must be associated with functional and structural cardiovascular heart defect that damage the heart, kidneys, brain, and other organs (22). This complexity leads to the use fuzzy logic system in hypertension classification.
Fuzzy logic has several applications that attempt to mimic the human thinking and reasoning capabilities. This is generally implemented by defining a set of rules which suggest probable diagnosis according to the elicited symptoms, specifically in classifying the intensity of the hypertension (23). This technique has proven to be effective in providing accurate results without consuming much time. Consequently, it can help the physician to have a better performance, and to decrease human error.
Another approach for hypertension classification using fuzzy logic is to integrate fuzzy logic with neural networks to produce a hybrid neuro-fuzzy model that can help in curtailing the risk of hypertension. Neural networks are a well-known classification schemes that builds strong relations between input and output. Nowadays, Artificial Neural Networks (ANN) is a computing model of the function and structure of biological neural networks that invaded scientific research (24-26). Moreover, fuzzy inference systems are used to classify the blood pressure and the heart rate level. Due to the flexibility in handling uncertainty, fuzzy logic managed to successfully classify all testing cases, whilst traditional system can accurately classify only 53% of the same input, due to the rigid nature of traditional systems rules (27).
Another approach has been introduced by (28). In this research paper, they have used a fuzzy system to classify arterial hypertension. After they have built their model, they took 45 records for 40 patients. These readings have been passed as an input to their introduced fuzzy classifier model. To statistically measure the accuracy of the collected results, T-test has been utilized. After running this test, the T degree was -0.1 for systolic classification, and -0.23 for diastolic classification. Consequently, the introduced classifier provides results that are similar to the real data.
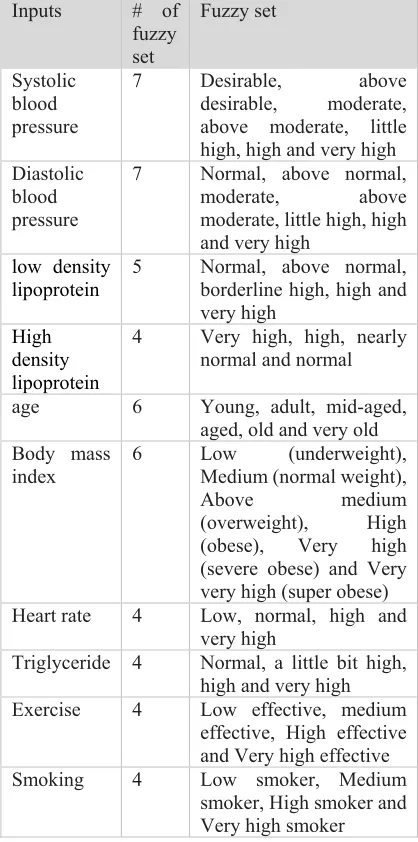
In (29) the researchers have developed a hypertension classification model using 10 inputs.
[image:6.612.313.522.252.673.2]To meet their objective, they assigned different classification fuzzy set to each input and output. To illustrate, the first and second inputs, which are systolic blood pressure and diastolic blood pressure, were classified into 7 fuzzy sets. The output is an estimation of the risk of hypertension. To better describe the risk, it has been classified to five linguistic variables: very low, low, moderate, high, and very high. Table 1 depicts the number and description of classification fuzzy sets:
Table 1: The Number And Description Of Classification
Fuzzy Sets (29)
Inputs # of fuzzy set
Fuzzy set
Systolic blood pressure
7 Desirable, above
desirable, moderate, above moderate, little high, high and very high Diastolic
blood pressure
7 Normal, above normal, moderate, above moderate, little high, high and very high
low density lipoprotein
5 Normal, above normal, borderline high, high and very high
High density lipoprotein
4 Very high, high, nearly normal and normal
age 6 Young, adult, mid-aged, aged, old and very old Body mass
index
6 Low (underweight), Medium (normal weight),
Above medium
(overweight), High (obese), Very high (severe obese) and Very very high (super obese) Heart rate 4 Low, normal, high and
very high
Triglyceride 4 Normal, a little bit high, high and very high Exercise 4 Low effective, medium
effective, High effective and Very high effective Smoking 4 Low smoker, Medium
smoker, High smoker and Very high smoker
2436
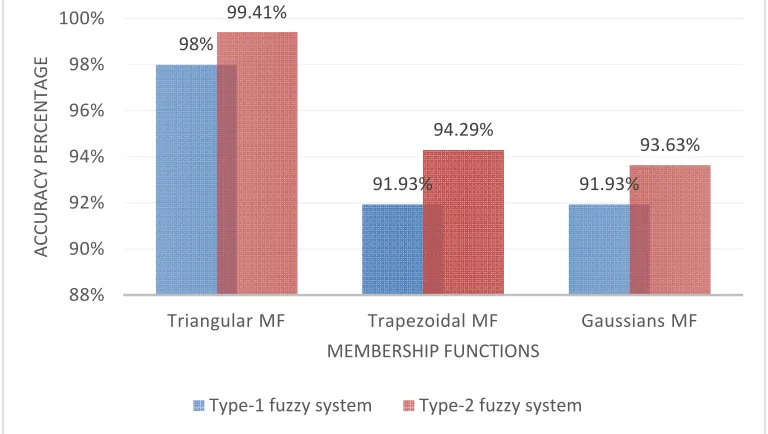
using type-1 fuzzy system as has been suggested in (30), the authors have investigated using interval type-2 fuzzy system for hypertension classification. Consequently, the latter system has proven to provide more accurate results. To elucidate, they have used three different membership functions, triangular, trapezoidal and Gaussian with type-1 and
[image:7.612.114.498.176.393.2]interval type-2 fuzzy system. The results have been compared as depicted in Figure 7. It is clear that the interval type-2 fuzzy system results showed a more accurate classification system.
Figure 7: Correct Classification Percentage Of The Classifier(31)
3.3 Hypertension Diagnosing
Diagnosis of hypertension is a complicated process because blood pressure values vary with age, gender and height (32). Moreover, the tension of the patient when the physician introduces him or her to the difficulties and challenges of hypertension may lead to incorrect diagnosis (33). This can be avoided by using correct methods and systems.
In (34), the authors have designed two systems, namely the Fuzzy Expert System (FES) and Neuro Fuzzy System (NFS). Both systems are used to diagnose the potential risk of high blood pressure. To achieve their objective, they have included several parameters including blood pressure readings, Body Mass Index (BMI), Heart Beats per Second, and the patient’s age. Using these parameters, both systems have been compared to identify which approach is the optimal one. Consequently, they have concluded that NFS are relatively more efficient for accurately forecasting the risk probability. It is worth pointing out that most
[image:7.612.315.523.470.654.2]of existing research work, including (34), depends on the European Hypertension Classification (35). Table 2 summarizes this classification.
Category Systolic Diastolic
Optimal <120 And <80 Normal 120 - 129 And /
or 80 - 84 High Normal 130 - 139 And /
or
85 - 89
Grade 1
Hypertension 140 - 159 And / or 90 - 99
Grade 2
Hypertension 160 - 179 And / or 100 - 109
Grade 3
Hypertension 180 And / or 110 Isolated
Systolic Hypertension
140 And < 90
Table 2: European Blood Pressure Classification (35)
Furthermore, a Neuro-Fuzzy Hybrid technique has been introduced in (30) that can be utilized for diagnosing various diseases including Hypertension. This has been conducted by screening the blood pressure readings for real patients for 24 98%
91.93% 91.93%
99.41%
94.29%
93.63%
88% 90% 92% 94% 96% 98% 100%
Triangular MF Trapezoidal MF Gaussians MF
ACCURACY
P
ERCENTAGE
MEMBERSHIP FUNCTIONS
2437
hours. After that, a simulation has been developed based on the collected data. Using this simulation, a fuzzy system has been developed for data classification. Furthermore, a genetic algorithm has been incorporated to minimize the classification error.
In (36), a fuzzy expert system has been developed to estimate the risk of hypertension using
[image:8.612.126.488.207.423.2]fuzzy inference system (FIS) tool. To illustrate, they have used Mamdani fuzzy methods to apply fuzzification on four inputs (age, blood pressure, BMI and heart rate). The objective was to calculate the hypertension risk percentage. Figure 8 shows the relation between these inputs and the risk of hypertension (the output).
Figure 8:Relationship Between Factors And Risk Of Hypertension(36)
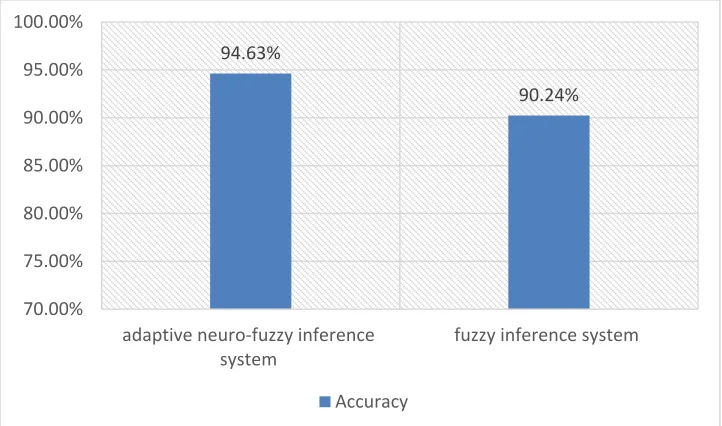
Moreover, in (37) Nohria and Mann have developed an adaptive neuro-fuzzy inference system for hypertension diagnosis and compared it with an existing fuzzy expert system for hypertension
diagnosis. As shown in Figure 9, the results of their system were more accurate.
Figure 9: Comparison Of Systems Accuracy(37)
50 50 50 50 50 50
39 39 39
50
0 20 40 60 80 100 120 140
1 2 3 4 5 6 7 8 9 10
BMI(kg/m²)
Blood
Pressure(mmHg)‐ Systolic
Blood
Pressure(mmHg)‐ Diastolic
Heart Rate (bpm)
Risk(%)
94.63%
90.24%
70.00% 75.00% 80.00% 85.00% 90.00% 95.00% 100.00%
adaptive neuro‐fuzzy inference system
fuzzy inference system
[image:8.612.126.487.491.704.2]2438
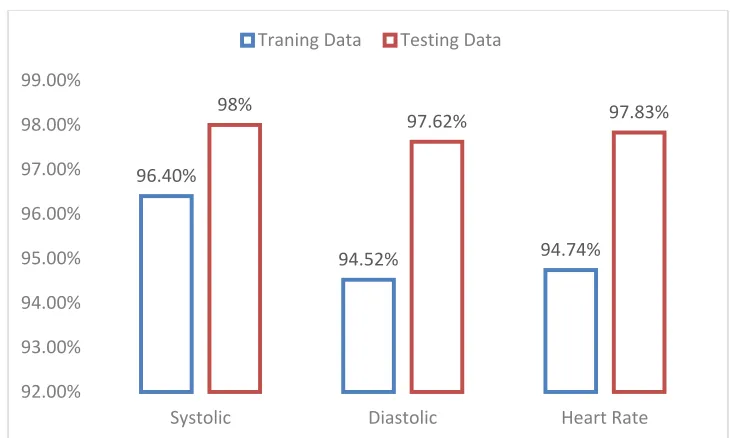
It worth mentioning that the previously discussed neuro-fuzzy hybrid model introduced in (27) has contributed to the hypertension classification as well. To illustrate, several soft computing methods were used to simulate the behavior of the blood pressure for different patients. More specifically, three fuzzy inference systems were used:
A system for classifying Systolic blood pressure.
A second system for classifying Diastolic blood pressure.
A third system used for patient’s night profile classification.
[image:9.612.122.488.228.447.2]70% of the collected data has been used to train the network for the behavior of blood pressure and heart rate of the patients, and the remaining 30% of the data has been used to test the network. The learning accuracy for training and testing is illustrated in Figure 10.
Figure 10: Percentage of Success in Training Vs Training Data(27)
This introduced hybrid provides diagnosis for the patient and the prediction for the hypertension risk in the upcoming four years. Consequently, it can help the patients to improve their health and to adopt a healthy lifestyle to decrease the potential risk.
4. DIRECTIONS FOR FURTHER
INVESTIGATION
According to the above discussion, there are a number of possible directions for further research. For instance, it has been noted that when integrating fuzzy systems with neural networks, the diagnosis and classification results were generally better. Hence, the reader can think of other hybrids that can improve the performance of the bare fuzzy systems.
Furthermore, by incorporating other factors such as diet, work routine, encountered stress and so forth, an algorithm can be developed to proactively predict and diagnose the risk of hypertension. To
illustrate, we can define hypertension risk attributes
as 𝑉 , 𝑉 , … 𝑉with discourse 𝛺 where 1 𝑗 𝑛 to
develop a multidimensional space 𝛺 , 𝛺 , … 𝛺 . Each element in this space is a vector (𝑣 , 𝑣 , … 𝑣
that represents crisp measurements which describe the hypertension risk for the subject. This universal set can be represented as several fuzzy sets with different degrees of hypertension risk. For each attribute 𝑉, we can define a suitable membership function 𝜇 over 𝛺(38). Consequently, instead of considering only two dimensions of attributes, models of 3, 4 and up to n dimensions can be
developed to enhance the accuracy of the classification and diagnosis of hypertension.
5. RESULT
Fuzzy logic can be used to develop an algorithm to identify the hypertension symptoms early enough, which can help in mitigating the risk of hypertension and ensure that the patient blood pressure will stay within normal limits. This is
96.40%
94.52% 94.74%
98%
97.62% 97.83%
92.00% 93.00% 94.00% 95.00% 96.00% 97.00% 98.00% 99.00%
Systolic Diastolic Heart Rate
2439
because blurred blood pressure readings make fuzzy logic an effective tool that can properly handle uncertainty. Various researches have suggested different approaches to utilize fuzzy system for improving the accuracy of classifying and diagnosing hypertension. These techniques include using fuzzy logic with different membership functions in different dimensions, using type-2 fuzzy system instead of type-1 and hybrids of neural network and fuzzy logic. Further research can be conducted in developing a membership function in n
dimensions instead of only 2 dimensions.
6. Conclusion
The main objective of this research paper is to review the existing approaches for using fuzzy expert’s system to deal with complex symptoms of hypertension. It worth noting that the ambiguity of these symptoms forms a serious threat to humans’ life.
It can be concluded that fuzzy expert systems can be integrated with neural network to develop a hybrid model that can provide more accurate classification and diagnosis results. This hybrid can assist physicians in handling complicated and different types of symptoms and provide them with a handy tool for decision making.
REFERENCES
[1] Association AH. What is high blood pressure? South Carolina State Documents Depository. 2017.
[2] Crim MT, Yoon SS, Ortiz E, Wall HK, Schober S, Gillespie C, et al. National surveillance definitions for hypertension prevalence and control among adults. Circulation: Cardiovascular Quality and Outcomes. 2012;5(3):343-51.
[3] Marques FZ, Mackay CR, Kaye DM. Beyond gut feelings: how the gut microbiota regulates blood pressure. Nature Reviews Cardiology. 2018;15(1):20.
[4] James PA, Oparil S, Carter BL, Cushman WC, Dennison-Himmelfarb C, Handler J, et al. 2014 evidence-based guideline for the management of high blood pressure in adults: report from the panel members appointed to the Eighth Joint National Committee (JNC 8). Jama. 2014;311(5):507-20.
[5] Carey RM, Whelton PK. Prevention, detection, evaluation, and management of high blood pressure in adults: synopsis of the 2017 American College of Cardiology/American Heart Association Hypertension Guideline.
Annals of internal medicine. 2018;168(5):351-8.
[6] Hien HA, Tam NM, Tam V, Derese A, Devroey D. Prevalence, awareness, treatment, and control of hypertension and its risk factors in (Central) Vietnam. International journal of hypertension. 2018;2018.
[7] Chobanian AV, Bakris GL, Black HR, Cushman WC, Green LA, Izzo Jr JL, et al. The Seventh Report of the Joint National Committee on Prevention, Detection, Evaluation, and Treatment of High Blood Pressure: The JNC 7 Report. Journal of the American Medical Association. 2003;289(19):2560-72.
[8] Garrido A. A brief history of fuzzy logic. BRAIN Broad Research in Artificial Intelligence and Neuroscience. 2012;3(1):71-7. [9] Dubois D, Esteva F, Godo L, Prade H. Fuzzy-set based logics - an history-oriented presentation of their main developments. Handbook of the History of Logic2007. p. 325-449.
[10]Understanding fuzzy logic: An interview with Lotfi Zadeh {dsp History}. IEEE Signal Processing Magazine. 2007;24(3):102-5. [11]Gupta P. Applications of Fuzzy Logic in Daily
life. International Journal of Advanced Research in Computer Science. 2017;8(5). [12]Mirzabozorg A, Nghiem L, Chen Z, Yang C, Li
H, editors. How does the incorporation of engineering knowledge using fuzzy logic during history matching impact reservoir performance prediction? Society of Petroleum Engineers - SPE Heavy Oil Conference Canada 2014; 2014. [13]Zimmermann H-J. Fuzzy set theory—and its applications: Springer Science & Business Media; 2011.
[14]Ross TJ. Fuzzy Logic with Engineering Applications: Third Edition2010.
[15]Barros L, Esmi E, Vendite LL. Fuzzy versus probability: a discussion. Mathware & soft computing. 2017;24(2):32-42.
[16]Provinský P. Floppy logic-a younger sister of fuzzy logic. Neural Network World. 2017;27(5):479-97.
[17]Patel A, Gupta SK, Rehman Q, Verma M. Application of fuzzy logic in biomedical informatics. Journal of Emerging Trends in Computing and Information Sciences. 2013;4(1):57-62.
2440 [19]Krittanawong C, Bomback AS, Baber U,
Bangalore S, Messerli FH, Tang WW. Future direction for using artificial intelligence to predict and manage hypertension. Current hypertension reports. 2018;20(9):75.
[20]Feng G. A survey on analysis and design of model-based fuzzy control systems. IEEE
Transactions on Fuzzy Systems.
2006;14(5):676-97.
[21]Lasri R, Rojas I, Pomares H. Fuzzy Logic Controllers Improves Human Daily Life. The State-Of-The Art. International Journal of Computer Applications.23(9).
[22]Giles TD, Materson BJ, Cohn JN, Kostis JB. Definition and classification of hypertension: An update. Journal of Clinical Hypertension. 2009;11(11):611-4.
[23]Melin P, Prado-Arechiga G. Fuzzy logic for arterial hypertension classification. New Hybrid Intelligent Systems for Diagnosis and Risk Evaluation of Arterial Hypertension: Springer; 2018. p. 5-13.
[24]Qi LJ, Alias N, editors. Comparison of ANN and SVM for classification of eye movements in EOG signals. Journal of Physics: Conference Series; 2018: IOP Publishing.
[25]Alias N, Mohsin HM, Nadirah M, Mustaffa S, Reyaz R. Parallel Artificial Neural Network Approaches For Detecting The Behaviour Of Eye Movement Using Cuda Software On Heterogeneous CPU-GPU Systems. 2016. [26]Alias N, Farid FNM, Al-Rahmi WM, Yahaya N,
Al-Maatouk Q. A modeling of animal diseases through using artificial neural network. International Journal of Engineering & Technology. 2018;7(4):3255-62.
[27]Melin P, Miramontes I, Prado-Arechiga G. A hybrid model based on modular neural networks and fuzzy systems for classification of blood pressure and hypertension risk diagnosis. Expert Systems with Applications. 2018;107:146-64. [28]Pulido M, Melin P, Prado-Arechiga G. A New
Model Based on a Fuzzy System for Arterial Hypertension Classification. Fuzzy Logic Augmentation of Neural and Optimization Algorithms: Theoretical Aspects and Real Applications: Springer; 2018. p. 319-27. [29]Srivastava P, Srivastava A, Burande A,
Khandelwal A. A note on hypertension classification scheme and soft computing
decision making system. ISRN
Biomathematics. 2013;2013.
[30]Guzman JC, Melin P, Prado-Arechiga G. Design of an optimized fuzzy classifier for the diagnosis of blood pressure with a new
computational method for expert rule optimization. Algorithms. 2017;10(3):79. [31]Guzmán JC, Miramontes I, Melin P,
Prado-Arechiga G. Optimal Genetic Design of Type-1 and Interval Type-2 Fuzzy Systems for Blood Pressure Level Classification. Axioms. 2019;8(1):8.
[32]Lu Q, Ma C, Yin F, Liu B, Lou D, Liu X. How to simplify the diagnostic criteria of hypertension in adolescents. Journal of human hypertension. 2011;25(3):159.
[33]Volpe M, Tocci G. Challenging hypertension: how to diagnose and treat resistant hypertension in daily clinical practice. Expert Review of Cardiovascular Therapy. 2010;8(6):811-20. [34]Das S, Ghosh PK, Kar S, editors. Hypertension
diagnosis: a comparative study using fuzzy expert system and neuro fuzzy system. 2013 IEEE International Conference on Fuzzy Systems (FUZZ-IEEE); 2013: IEEE.
[35]Mancia G, Fagard R, Narkiewicz K, Redon J, Zanchetti A, Boehm M, et al. 2013 ESH/ESC guidelines for the management of arterial hypertension: the Task Force for the Management of Arterial Hypertension of the European Society of Hypertension (ESH) and of the European Society of Cardiology (ESC). Blood pressure. 2013;22(4):193-278.
[36]Abdullah AA, Zakaria Z, Mohamad NF, editors. Design and development of fuzzy expert system for diagnosis of hypertension. 2011 Second International Conference on Intelligent Systems, Modelling and Simulation; 2011: IEEE.
[37]Nohria R, Mann P. Diagnosis of hypertension using adaptive neuro-fuzzy inference system. IJCST. 2015;3:36-40.
[38]Barini GO, Ngoo LM, Mwangi RW. Application of a fuzzy unit hypercube in cardiovascular risk classification. Soft Computing. 2019:1-7.