ISSN: 1992-8645 www.jatit.org E-ISSN: 1817-3195
PREDICTING THE OUTCOMES OF TRAUMATIC BRAIN
INJURY USING ACCURATE AND DYNAMIC PREDICTIVE
MODEL
1, 2HAMDAN O. ALANAZI, 1ABDUL HANAN ABDULLAH, KASHIF NASEER QURESHI1
MOUSSA LARBANI3, MOHAMMED AL JUMAH2
1
Faculty of Computing, Universiti Teknologi Malaysia, Johor Bahru, Malaysia 2
Department of Medical Science Technology, Faculty of Applied Medical Science, Majmaah University,
Kingdom of Saudi Arabia 3
Faculty of Economics, IIUM University, Jalan Gombak, Kuala Lumpur, 53100, Malaysia
Corresponding Author: [email protected]
ABSTRACT
Predictive models have been used widely to predict the diseases outcomes in health sector. These predictive models are emerged with new information and communication technologies. Traumatic brain injury has recognizes as a serious and crucial health problem all over the world. In order to predict brain injuries outcomes, the predictive models are still suffered with predictive performance. In this paper, we propose a new predictive model and traumatic brain injury predictive model to improve the predictive performance to classifying the disease predictions into different categories. These proposed predictive models support to develop the traumatic brain injury predictive model. A primary dataset is constructed which is based on approved set of features by the neurologist. The results of proposed model is indicated that model has achieved the best average ranking in terms of accuracy, sensitivity and specificity.
Keywords: Predictive Model, Traumatic Brain Injury, Outcomes, Sensitivity, Specificity, Accuracy, Multi-Class Prediction
1. INTRODUCTION
Recently, the new Communication and Information Technologies (ICTs) have emerged in all fields such as transportation, agriculture, industries [1-3]. These technologies are also implemented in health sector to predict the diseases outcome through predictive models. Predictive models are used to process and create a model which is capable of predicting disease outcomes [4]. The prediction is about an uncertain event which is capable to identifying the new outcomes from past data [5]. The predictive models play significant role in healthcare, where these models predict the patient’s outcomes based on their features. These predictions are significant for disease future outcomes [6]. In the past, such estimates are typically based on professional (clinician and health provider’s) opinion and their experience. Predictive models are used to determine the eligibility of the patient for new methods of disease treatment. In addition, these models are used as a guideline in health sector to select the
more appropriate therapies for patients. In addition, the predictive and prognostic models are interchangeable in nature. Prediction can be used to solve the binary and multiclass problems. The multiclass prediction problem refers to classifying different instances into one and more than one classes [7]. On the other hand, the binary prediction problem refers to classifying instances into two classes.
ISSN: 1992-8645 www.jatit.org E-ISSN: 1817-3195
Various different types of predictive models have been designed for prediction. However, these models have some limitations and drawbacks. Existing predictive models have not been well established for TBI patients. The existing predictive models have unsatisfactory results due to unavailability of multi-class prediction. Multi-class prediction is very significant to improve the predictive models performance for TBI outcomes. Different types of predictive models are used to provide classifications and predictions such as Artificial Neural Network (ANN), AdaBoost and Support Vector Machine (SVM), Logistic Regression (LR), Bayesian Network (BN), Decision Tree (DT) Discriminant Analysis (DA) [9, 10]. Still, there is a need to develop a new predictive model for improving the existing models predictive performance. Another issue in TBI predictive model is affinity predictive model usage. The affinity is not used in TBI to develop and provide multi-class prediction. Indeed, there is a dire need to develop a new predictive model for improving the predictive model performance. In addition, the features from existing TBI predictive model need to be evaluated and approved by neurology experts for a better predictive performance.
In this context, this paper propose a new TBI predictive model to improve the existing predictive models performance for TBI. The propose model obtains a better prediction of TBI outcomes which is based on Glasgow outcome scale. In paper main objectives are as follows:
• To design a new predictive model to enhance the existing predictive models performance for predicting TBI outcomes.
• To design the Traumatic Brain Injury Predictive Model for predicting outcomes of TBI.
The rest of paper is organized as follows. Section 2 discusses the related work in the field. Section 3 presents the complete model design. The results of proposed model are discuss in Section 4. Finally, we conclude this paper with future work in Section 5.
2. RELATED WORK
Traumas are serious health problems all over the world. According to Zhang, et al. [11], around 10 million people have suffered from
traumatic brain injuries. In order to solve these serious problems, there is a need to use new computer based technologies for accurate predictive method. In this section, we discuss some existing predictive models and their limitations.
Artificial Neural Network (ANN) refers to a computational model inspired by the connectivity of neurons to animate the nervous systems and widely used as a method for classification and prediction. Ding, et al. [12] reported that during the last thirty years, ANN has used widely with remarkable developments. The wide acceptance and usage of ANN are because of its ability in mapping. The Discriminant Analysis (DA) model is a general form of Fisher's linear discriminant. It is usually utilize to search linear combination of features which are separated by two or more than two events or classes of objects. The term LDA (Linear Discriminant Analysis) and Fisher’s linear discriminant are often used interchangeably and considered as well-known classifier to solve the problems [13].
Neuro-fuzzy models are based on combination of fuzzy logic and artificial neural networks. This model hybridization the results in a hybrid intelligent system and synergizes these methods through combining the fuzzy systems (human-like reasoning style) with the learning and connectionist structure of neural networks. One of the main advantage of Neuro-Fuzzy system is its universal ability to approximation and solicit interpretable IF-THEN rules. Basically, these systems are divided into two main areas: linguistic fuzzy and precise fuzzy modeling. In linguistic fuzzy area mainly focused on interpretability and on Mamdani model. On the other hand, the precise fuzzy area focuses on accuracy and mainly depend on Takagi-Sugeno-Kang (TSK) model [14-16].
ISSN: 1992-8645 www.jatit.org E-ISSN: 1817-3195
Support Vector Machines (SVMs) are well known predictive models which contains learning methods and able to explore the dataset to identify the outcomes. This approach is widely used for binary classification and prediction. In fact, the support vector machine is considered as one of the linear binary classifiers but a simple SVM can analyze a group of inputs from the dataset in order to forecast two outputs. Moreover, the support vector machines are capable of using the kernel trick that can map the instances in high dimensional space to provide nonlinear prediction or classification [18]. However, it may requires prohibitively-expensive computing resources to solve real world issues. On the contrary, the “one-to-the others” method is slightly less accurate, but still in demand especially for heavy resources in real-time application.
Affinity approach is used to classifying and prediction. Furthermore, affinity set is also used to investigating the relationship between output and inputs dataset [19]. Agarwal and Chen [20] proposed a predictive model to diagnosis and associated with the accuracy results with SVM, an NN, a rough set (Rosetta), and logistic regression. In addition, the researchers also discussed that affinity set model is accurate than the ANNs. Huang and Chen [21] designed a qualitative data development analysis by affinity set in which affinity predictive model is used to determine the performance of nonprofit organizations. However, in this study the multiclass prediction is not taken into account. Larbani and Chen [22] used affinity set and its application in data-mining in which affinity is used as a set for delayed diagnosis as a predictor or binary classification. The delayed diagnosis refers to a medical errors which are explained delayed diagnosis issues. Such example is those patients who are ignored in emergency room and identified in intensive care unit by doctors. In addition, in this study affinity set is used as a data mining tool through topology concept to categorize the key attributes which are caused for delayed diagnosis. The results of this study indicated that when patients breathe normally but pulse and blood pressure are abnormal, so it shows high probability of delayed diagnosis. Larbani and Chen [22] proposed a fuzzy set based framework for affinity concept without multiclass prediction. Chen, et al. [23] used affinity set to find vital traits of delayed diagnosis. This study provides topology concept for affinity set. This affinity set is used as a data
mining tool to concentrate and categorized the significant traits which are caused for delayed diagnosis. Chen and Larbani [19] was developed the affinity set and its applications mathematical model of affinity set. Alanazi, et al. [24] developed the affinity predictive model to solve the multi-class prediction problem.
The above discussion on existing predictive models clearly indicated that existing predictive models are used for classification and analysis. However, these models are used for binary prediction and classification. These models do not provide a multi-class prediction.
3. PROPOSED ACCURATE AND
DYNAMIC PREDICTIVE MODEL
Accurate and Dynamic Predictive Model (APM) is proposed to improve the predictive performance. In this proposed model, 12 predictive models are combined together to predict the TBI outcomes and the ten-fold cross validation is applied to validate the model. The combined predictive models are Artificial Neural Network (M1), Fuzzy Model (M2), Ensemble Model (M3), Naive Bayes Model (M4), Discriminant Analysis Model (M5), Neuro Fuzzy Model (M6), Decision Tree Model (M7), Affinity Model (M8), KNN model (M9), Multi SVM (M10) and Logistic Regression (M11). These predictive models are used successfully with ten different datasets. These datasets are IRIS, Balance, Thyroid, TEA, JMI, CTG-CMIM, CTG-DISR, TBI-JMI, TBI-CMIM and TBI-DISR.
Three feature selection methods is used with these datasets to contain more than six features. These feature selection methods are used with these datasets to contain more than six features. These methods are Joint Mutual Information Method, Double Input Symmetrical Relevance
Method and Conditional Mutual Info
Maximization Method. The predictive
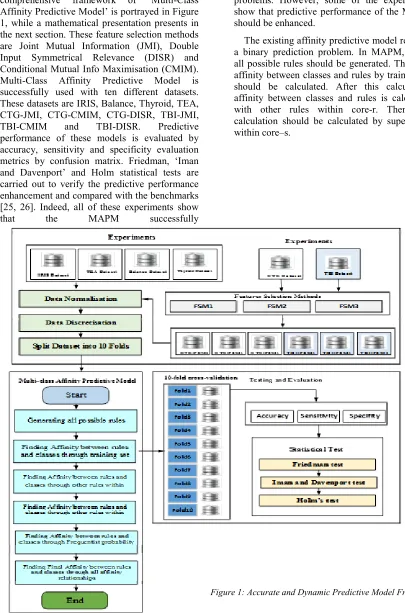
performance of these models evaluate by accuracy, sensitivity and specificity. Evaluation metrics using confusion matrix. Friedman, ‘Iman and Davenport’ and Holm statistical tests are carried out to verify the predictive performance enhancement [25, 26]. Figure 1 shows the APM model prototype.
cross-ISSN: 1992-8645 www.jatit.org E-ISSN: 1817-3195
validation has used to validate the model. A comprehensive framework of ‘Multi-Class Affinity Predictive Model’ is portrayed in Figure 1, while a mathematical presentation presents in the next section. These feature selection methods are Joint Mutual Information (JMI), Double Input Symmetrical Relevance (DISR) and Conditional Mutual Info Maximisation (CMIM). Multi-Class Affinity Predictive Model is successfully used with ten different datasets. These datasets are IRIS, Balance, Thyroid, TEA, CTG-JMI, CTG-CMIM, CTG-DISR, TBI-JMI,
TBI-CMIM and TBI-DISR. Predictive
[image:4.612.90.495.111.724.2]performance of these models is evaluated by accuracy, sensitivity and specificity evaluation metrics by confusion matrix. Friedman, ‘Iman and Davenport’ and Holm statistical tests are carried out to verify the predictive performance enhancement and compared with the benchmarks [25, 26]. Indeed, all of these experiments show
that the MAPM successfully
resolves the different multi-class prediction problems. However, some of the experiments show that predictive performance of the MAPM should be enhanced.
The existing affinity predictive model resolves a binary prediction problem. In MAPM, firstly all possible rules should be generated. Then, the affinity between classes and rules by training set should be calculated. After this calculation, affinity between classes and rules is calculated with other rules within core-r. Then, this calculation should be calculated by super rules within core–s.
ISSN: 1992-8645 www.jatit.org E-ISSN: 1817-3195
Then, the affinity is calculated between rules and super rules. Next, the list of super rules within core–s should be assigned and affinity classes and rules are calculated by super rules within core-s. Next, the affinity between classes and rules are calculated by frequents possibility. Finally, the affinity between classes and rules are calculated by all affinity relationships. Theoretically, the Multi-class predictive affinity model classified problem instance by affinity between entities.
3.1 Model Design
Abstractly, APM (M12) model classifies with a combination of multiples from the eleven most famous predictive models by dynamic weighted multi-criteria decision making method.
Mathematically, APM can be formulate as follows:
= is the predictive models (criteria) where
and is number of predictive
models.
i. Calculating the accuracy of predictive models
Calculating the accuracy of predictive models based on the equation 1:
= +
/ (1
)
ii. Calculating the sensitivity of predictive
models
Calculating the sensitivity of predictive models based on the equation:
(2)
)
iii. Calculating the specificity of predictive
models
Calculating the Specificity of predictive
models based on the equation:
=
(3
)
iv. Calculating the weights of predictive models
Calculating the weights of predictive models based on the equation 4:
(4)
Where = is the weights of predictive models
v. Calculating the adjusted weights of predictive
models
The adjusted weights of predictive models is the weights of predictive
models where maximum weight of has the
decision power and .
vi. Transformation and normalization
ISSN: 1992-8645 www.jatit.org E-ISSN: 1817-3195
where, = (5)
0 < < 1, the value of will be between 0 and 1.
vii. Calculating the most preferred outcome
The most preferred outcome , will be selected such as:
= { |
}
(6)
Where, M j is the predictive models and r* i,j(t) is the outcome of the ith and jth predictive model (criteria) at time (t) while Oi are the scores outcomes for the decision power dp and 1 ≤ dp ≤ m….. … The final value of the decision vote depends on the best predictive performance. The
r*ij (t) can be changed based on the decision
maker
= min
= max
= mean = median
4. EXPERIMENTS AND RESULTS
Different experiments are conducted with different datasets to predict the outcomes and validate with 10-fold cross-validation. The data sets used in experiments are Balance Scale Dataset, Thyroid Dataset, TEA Dataset, Cardiotocography Dataset, CTG-JMI Dataset, CTG- CMIM Dataset, CTG- DISR Dataset and TBI Datasets. These datasets are used to predict a psychological experimental outcomes. For validation the 10-fold cross-validation method is used for experiment. The results of these experiments are indicated that proposed model MAPM is successfully solved the multiclass prediction problem. In addition, these results show that in the fold 4’ the affinity predictive performance predict all the IRIS outcomes successfully while in the fold 8, the accuracy, sensitivity and specificity are at the lowest.
In order to predict the TBI outcomes, 12 predictive models are combined together and the 10-fold cross-validation is used to validate the model. The combined predictive models are Artificial Neural Network, Fuzzy Model, Ensemble Model, Naive Bayes Model,
Discriminant Analysis Model, Neuro Fuzzy Model, Decision Tree Model, Affinity Model, KNN model, Multi SVM and Logistic Regression. These predictive models are used successfully with ten different datasets. These datasets are IRIS, Balance, Thyroid, TEA, CTG-JMI, CTG-CMIM, CTG-DISR, CTG-JMI, TBI-CMIM and TBI-DISR. Table 1 shows the results of all predictive models and their comparison results with different datasets in terms of accuracy and sensitivity of the 10-fold cross-validation based on TBI-CMIM datasets.
4.1 Accuracy Results
The average rankings of each predictive model obtains by the Friedman test. Furthermore, these models are distributed according to F-distribution in Friedman statistic according to chi-square with 11 degrees of freedom 51.676923 and the P-value computed by Friedman test 0. The distribution is according to F-distribution in Iman and Davenport statistic according to F-distribution with 11 and 99 degrees of freedom, which is 7.974413 and P-value computed by Iman and Daveport Test with value 0.000000000872. The proposed predictive models have achieved the best average rank and significantly consider a best predictive model among the whole multiple models based on accuracy with the level of significance (α) < 0.05 and (α) < 0.01. In addition, it is reported that the Multi SVM obtained the worst average rank which is considered significantly as the worst predictive model among other predictive models. As a conclusion, Friedman and ‘Iman and Daveport’ showed that there is a significant difference between the proposed predictive models and the whole multiple predictive models since the p-value of Friedman and ‘Iman and Daveport’ level of significance is (α) < 0.05 and (α) < 0.01. In other words, the Friedman and ‘Iman and Daveport’ tests rejected the null hypothesis (i.e. all the results of the predictive models based on equivalent accuracy).
4.2 Sensitivity Results
ISSN: 1992-8645 www.jatit.org E-ISSN: 1817-3195
J our na l of The or e ti c a l a nd A ppl ie d Inf or m a ti on Te c hnol o gy 3 0 th N o v e m b e r 2 0 1 6 . V o l. 9 3 . N o .2 © 2 0 0 5 2 0 1 6 J A T IT & L L S . A ll ri g h ts r e s e rv e d . IS S N : 1 9 9 2 -8 6 4 5 w w w .j at it .o rg E -I S S N : 1 8 1 5 6 8
Acc Sen Spe Acc Sen Spe Sen Spe Sen Spe Sen Spe Acc Sen Spe Acc Sen Spe Acc Sen Spe
Artificial Neural Network 0.79 0.66 0.88 0.79 0.66 0.88 0.52 0.36 0.68 0.9 0.82 0.95 0.986 0.973 0.993 0.95 0.93 0.98 0.91 0.83 0.95
Fuzzy Model 0.77 0.64 0.87 0.77 0.64 0.87 0.42 0.27 0.59 0.81 0.68 0.89 0.884 0.792 0.938 0.95 0.54 0.82 0.81 0.69 0.9
Ensemble Model 0.79 0.66 0.88 0.79 0.66 0.88 0.42 0.28 0.59 0.9 0.82 0.95 0.984 0.969 0.992 0.95 0.79 0.94 0.9 0.81 0.95
Naive Bayes Model 0.74 0.59 0.85 0.74 0.59 0.85 0.41 0.27 0.57 0.74 0.58 0.85 0.497 0.331 0.663 1 0.94 0.98 0.74 0.58 0.85
Discriminant Analysis
Model 0.77 0.62 0.87 0.77 0.62 0.87 0.54 0.37 0.69 0.84 0.72 0.91 0.913 0.841 0.955 0.91 0.84 0.95 0.85 0.75 0.92
Neuro Fuzzy Model 0.75 0.61 0.86 0.75 0.61 0.86 0.5 0.34 0.65 0.84 0.73 0.91 0.937 0.883 0.968 0.9 0.61 0.86 0.85 0.74 0.92
Decision Tree Model 0.81 0.68 0.89 0.81 0.68 0.89 0.53 0.37 0.69 0.91 0.83 0.95 0.981 0.963 0.99 1 0.9 0.97 0.9 0.83 0.95
Affinity Model 0.81 0.69 0.9 0.81 0.69 0.9 0.46 0.31 0.63 0.78 0.64 0.88 0.868 0.767 0.929 1 0.74 0.91 0.83 0.72 0.91
KNN model 0.67 0.5 0.8 0.67 0.5 0.8 0.42 0.28 0.59 0.89 0.8 0.94 0.909 0.834 0.952 0.95 0.85 0.96 0.89 0.81 0.94
Multi SVM 0.67 0.5 0.8 0.67 0.5 0.8 0.46 0.3 0.62 0.72 0.58 0.83 0.881 0.787 0.937 0.96 0.82 0.95 0.8 0.66 0.89
Logistic Regression 0.79 0.66 0.88 0.79 0.66 0.88 0.42 0.27 0.59 0.46 0.3 0.63 0.874 0.777 0.933 0.68 0.93 0.98 0.33 0.2 0.5
Proposed Model 0.84 0.73 0.91 0.84 0.73 0.91 0.67 0.51 0.8 0.93 0.86 0.96 0.988 0.977 0.994 0.68 0.97 0.99 0.92 0.85 0.96
TBI-CMIM Data Sets
Accuracy/ Sensitivity/ Specificity
M e th o d s
[image:8.612.72.744.139.527.2]IRIS Balance dataset TEA CTG-JMI CTG-DISR Thyroid
ISSN: 1992-8645 www.jatit.org E-ISSN: 1817-3195
In conclusion, Friedman and ‘Iman and Daveport’ showed that there is a significant difference between the proposed predictive models and the whole multiple predictive models since the p-value of Friedman and ‘Iman and Daveport’ level of significance is (α) < 0.05 and (α) < 0.01. In other words, the Friedman and ‘Iman and Daveport’ tests rejected the null hypothesis (i.e. all the results of the predictive models based on sensitivity are equivalent).
4.3 Specificity Results
In this comparison, the accuracy of predictive performance of all predictive models is calculated based on the specificity metrics. The distribution is according to F-distribution in Friedman statistic according to chi-square with 11 degrees of freedom with 332.792692 and the P-value computed by Friedman test is 0. The results are distributed according to F-distribution in Iman and Davenport statistic according to F-distribution with 11 and 1089 degrees of freedom which is 42.943382 and the P-value computed by Iman and Daveport Test is 0. The proposed predictive model achieved the best average ranking which is considered significantly as the best predictive model among the whole multiple models based on specificity with a level of significance of (α) < 0.05 and (α) < 0.01. In addition, it presents that the (M2) obtained the worst average ranking which is considered significantly as the worst predictive model among the whole multiple predictive models based on specificity. As a conclusion, Friedman and ‘Iman and Daveport’ showed that there is a significant difference between the proposed predictive models and the whole multiple predictive models since the p-value of Friedman and ‘Iman and Daveport’ level of significance is (α) < 0.05 and (α) < 0.01. In other words, the Friedman and ‘Iman and Daveport’ tests rejected the null hypothesis (i.e. all the results of the predictive models based on specificity are equivalent).
5. CONCLUSION
A dynamic weighted sum multi criteria decision making method used with multiple predictive models to obtain a better predictive performance for prediction and classification compared to existing benchmarks predictive models. Twelve predictive models are combined to predict the TBI outcomes using a dynamic weighted multi criteria decision making method to improve the predictive
performance of existing predictive models and the 10-fold cross-validation has used to validate the model. The predictive performance of these models is evaluated by accuracy, sensitivity and specificity evaluation metrics using confusion matrix. Friedman, ‘Iman and Davenport tests are carried out to verify the predictive performance enhancement compared with existing models. The proposed predictive models achieved the best average ranking which is considered significantly as the best predictive model among the whole multiple models in terms of accuracy, sensitivity and specificity. The proposed model will help in medical filed to predict the TBI outcomes. In future, we will develop more accurate model for other serious diseases in medical science.
REFERENCES
[1] K. N. Qureshi, A. H. Abdullah, and R. Yusof, "Position-based routing protocols of vehicular Ad hoc networks & applicability in typical road situation," Life Science Journal, vol. 10, pp. 905-913, 2013.
[2] K. N. Qureshi and A. H. Abdullah, "Study of Efficient Topology Based Routing Protocols for Vehicular Ad-Hoc Network Technology," World Applied Sciences Journal, vol. 23, pp. 656-663, 2013. [3] K. N. Qureshi, A. H. Abdullah, J. Lloret,
and A. Altameem, "Road-Aware Routing Strategies for Vehicular Ad Hoc
Networks: Characteristics and
Comparisons," International Journal of Distributed Sensor Networks, vol. 2016, 2016.
[4] G. Ireson and R. Richards, "Developing a Predictive Model for the Enhanced Learning Outcomes by the Use of Technology," Imperial Journal of Interdisciplinary Research, vol. 2, 2016. [5] G. Bottazzi and D. Giachini, "Far from the
Madding Crowd: Collective Wisdom in Prediction Markets," LEM Papers Series,
vol. 14, 2016.
[6] F. R. Vogenberg, "Predictive and prognostic models: implications for healthcare decision-making in a modern recession," American health & drug benefits, vol. 2, p. 218, 2009.
ISSN: 1992-8645 www.jatit.org E-ISSN: 1817-3195
Information Processing & Management,
vol. 45, pp. 427-437, 2009.
[8] C. Ekegren, M. Hart, A. Brown, and B. Gabbe, "Inter-rater agreement on assessment of outcome within a trauma registry," Injury, vol. 47, pp. 130-134, 2016.
[9] P. Perel, P. Edwards, R. Wentz, and I. Roberts, "Systematic review of prognostic models in traumatic brain injury," BMC medical informatics and decision making,
vol. 6, p. 1, 2006.
[10] N. A. Mushkudiani, C. W. Hukkelhoven, A. V. Hernández, G. D. Murray, S. C. Choi, A. I. Maas, et al., "A systematic
review finds methodological
improvements necessary for prognostic models in determining traumatic brain injury outcomes," Journal of clinical epidemiology, vol. 61, pp. 331-343, 2008. [11] Q.-H. Zhang, A.-M. Li, S.-L. He, X.-D.
Yao, J. Zhu, Z.-W. Zhang, et al., "Serum Total Cholinesterase Activity on Admission Is Associated with Disease Severity and Outcome in Patients with Traumatic Brain Injury," PloS one, vol. 10, p. e0129082, 2015.
[12] S. Ding, H. Li, C. Su, J. Yu, and F. Jin, "Evolutionary artificial neural networks: a review," Artificial Intelligence Review,
vol. 39, pp. 251-260, 2013.
[13] Y. Guo, T. Hastie, and R. Tibshirani, "Regularized linear discriminant analysis and its application in microarrays,"
Biostatistics, vol. 8, pp. 86-100, 2007. [14] S. Lakra, T. Prasad, D. K. Sharma, S. H.
Atrey, and A. K. Sharma, "Application of fuzzy mathematics to speech-to-text conversion by elimination of paralinguistic content," arXiv preprint arXiv:1209.4535,
2012.
[15] D. S. Rao, M. Seetha, and M. Prasad, "Comparison of Fuzzy and Neuro Fuzzy Image Fusion Techniques and its Applications," arXiv preprint arXiv:1212.0318, 2012.
[16] H. Singh and V. K. Toora, "Neuro Fuzzy Logic Model for Component Based Software Engineering," International Journal of Engineering Sciences, vol. 1, 2011.
[17] T. Li, C. Zhang, and M. Ogihara, "A comparative study of feature selection and multiclass classification methods for tissue
classification based on gene expression,"
Bioinformatics, vol. 20, pp. 2429-2437, 2004.
[18] K. Q. Weinberger, F. Sha, and L. K. Saul, "Learning a kernel matrix for nonlinear dimensionality reduction," in Proceedings of the twenty-first international conference on Machine learning, 2004, p. 106. [19] Y. Chen and M. Larbani, "Developing the
affinity set and its applications," in
Proceeding of the Distinguished Scholar Workshop by National Science Council, July, 2006, pp. 14-18.
[20] D. Agarwal and B.-C. Chen, "Regression-based latent factor models," in
Proceedings of the 15th ACM SIGKDD international conference on Knowledge discovery and data mining, 2009, pp. 19-28.
[21] W.-T. Huang and Y.-W. Chen,
"Qualitative data envelopment analysis by affinity set: a survey of subjective opinions for NPOs," Quality & Quantity, vol. 47, pp. 3079-3093, 2013.
[22] M. Larbani and Y. Chen, "A Fuzzy Set Based Framework for Concept of Affinity," Applied Mathematical Sciences,
vol. 3, pp. 317-332, 2009.
[23] Y.-W. Chen, M. Larbani, C.-Y. Hsieh, and C.-W. Chen, "Introduction of affinity set and its application in data-mining example of delayed diagnosis," Expert Systems with Applications, vol. 36, pp. 10883-10889, 2009.
[24] H. O. Alanazi, A. H. Abdullah, and M. Larbani, "Mathematical Model of Affinity Predictive Model for Multi-Class Prediction."
[25] M. Friedman, "The use of ranks to avoid the assumption of normality implicit in the analysis of variance," Journal of the american statistical association, vol. 32, pp. 675-701, 1937.