ISSN: 1992-8645 www.jatit.org E-ISSN: 1817-3195
OPTIMIZATION OF COVERAGE AND THE NUMBER
OF BASE TRANSCEIVER STATION TOWERS USING FUZZY
C-MEANS AND GENETIC ALGORITHM
1FAQIH ROFII
, 2M. DIMAS TOSCANNI, 3DIKY SISWANTO3
1,2,3
Department of Electrical Engineering, Universitas Widyagama Malang, Indonesia
E-mail: [email protected], [email protected]
,
3ABSTRACT
The demand for communications services over mobile networks continues to increase, especially in urban areas, encouraging mobile operators to increase the capacity of its services, by contructing new base transceiver stations in all urban areas. BTSs, which continue to grow regardless of the surrounding environment resulting in clutter environment. it is necessary for a study of how to rearrange the existing tower. The aim of this study was to obtain a minimum number of telecommunications towers already existing and is able to cover the city area using the optimization method, the Fuzzy C-Means and Genetic Algorithm. We propose a new method in determining the number of base stations at a minimum, to get the coverage area of the widest service, by selecting the existing base stations, through three stages steps: determination of the number of cells ideal, election position BTS using GA and calculates the coverage area. In this study using two types of bandwidth 10 and 7.5 MHz. Results from this study showed that there are 45 of the 154 existing BTSs selected, with an area of coverage is 72.79% for 10 MHz and 74.07% for 7.5 MHz bandwidth, while areas not covered are areas with few users.
Keywords: Base Stations Tower, Coverage, Fuzzy C-Means, Genetic Algorithm
1. INTRODUCTION
BTS tower construction should be done by mobile operators with the aim to improve service coverage, up to the village level, even up to six towers in the village. Until now there are 12 mobile operators operating in Indonesia where each operator set up its own base stations to meet coverage area. Indonesian Cellular Telecom Association (ATSI) in 2011 has recorded a number of base stations reached 97 thousand and in 2012 was built 15 thousand BTS again [1]. In Malang City Indonesia, has existed for more than 150 base stations. The placement of the tower is too much and without proper planning will result in adverse effects, among others: the emergence of a potential violation of the Spatial Plan and the potential violation of Flight Operations Safety Zone [2].
The Government through the Ministry of Communications and Information of the Republic of Indonesia issued Ministerial Decree on Guidelines for the development and use of telecommunication and tower sharing. Furthermore, based on these regulations, to create a safe space, comfortable, productive and sustainable as mandated by Act 26 of 2007 on the arrangement of
space, it has issued technical guidelines as a reference for local governments city in determining the location of the construction of telecommunication towers in accordance with the spatial plan in order to achieve effectiveness and aesthetics in space utilization [3], by structuring telecomunications tower.
ISSN: 1992-8645 www.jatit.org E-ISSN: 1817-3195 Some of these studies, the optimization is done
only focus on its cellular network planning, where there is only one telecommunications provider. In fact, the existence of the BTS is the sum of several different providers and different characteristics. Under these conditions, then how to get a minimal amount of existing telecommunications tower and capable of covering an area of town by using an optimization method.
2. MOBILE NETWORK AND PLANNING
Mobile network is a radio network distributed over an area called cells, each cell is served by at least one transceiver at a fixed location known as a cell site or a base station. When cells are joined together, it will provide a radio communication coverage in a wide geographic area. General architecture of a mobile telecom network according to Misra [6] consists of: Base Transceiver Station (BTS), Mobile Switching Center (MSC) and the Mobile Station (MS). Base transceiver station is a device that serves customer/mobile station to the mobile switching center and vice versa. Mobile Switching Center is the central co-ordination of all existing cell site and serves as the main connector. While the mobile station is a mobile device that is located on the customer side.
In a cellular radio system, an area that will be given radio communication service is divided into cells that can be hexagonal, square, circular or other irregular shape, although conventionally, the shape is hexagonal cells. Each cell is given multiple frequencies which has a corresponding radio base station. Group certain frequencies can be reused in other cells, provided that the same frequency is not used by cells adjacent neighbors, because it can cause co-channel interference. Cellular network used by mobile operators to achieve the coverage and capacity to customers. A wide geographical area is divided into smaller cells to avoid losing signal line-of-sight and to support a large number of customers that are active in that area. All cell sites connected to the telephone exchange (or switch), which in turn are connected to the public telephone network. In cities, each cell site may have a range of up to about 1.2 KM, while in rural areas, can reach up to 5 KM.
The main objective of cellular network planning according to Misra is to provide cost-effective solutions in radio networks with regard to capacity, coverage and quality. Criteria for the design and network planning process varies from one area to another depending on the dominant factor, whether the capacity or coverage. Network planning process
is not solely related to the network planning process alone, but also relates to other processes such as the transmission network. Network planning process begins with gathering input parameters, such as the requirements of capacity, coverage and quality. The final goal of network planning includes: planning coverage, the estimated capacity, interference, power and frequency calculation [7].
3. OPTIMIZATION PROBLEM OF BTS
PLACEMENT IN CELLULAR NETWORK
Optimization of the mobile telecom network is a process to improve the quality of service (QoS) based on key performance indicators (KPI). According to Misra, optimization process consists of two things, namely statistics and drive test. Statistical process provides an overview of the behavior of a cell at a certain period, while the drive test provides a description of behavior in an area quickly during the call. Drive test produces measurement such as mean opinion score (MOS), frame erasure rate (FER), bit error rate (BER), signal level, quality and information site (cell identity, BCCH, allocations for mobile, neighboring cells, and others. In the process of network planning cellular GSM, BTS is a very important element that should be considered in building a radio network is a media liaison between the user equipment (Mobile Station) via the air interface [8]. Therefore, the problem the largest mobile telecom network planning process lies in the placement of BTS sites appropriate to achieve the objectives of the service provider (operator) in the form maximize capacity, coverage and costs.
Several approaches have been proposed to solve the problem of the placement of base stations; The approach can classified into three categories [9] namely: geometric, mathematical and Spatial Decision Support System (SDSS). Another optimization approach in solving the problem of mobile telecommunications network planning is metaheuristic approaches include Genetic Algirithm (GA) and Tabu Search (TS), which were both very attractive due to its high flexibility in determining the limits and the objective function that can not be easily modeled by the equation algebra.
ISSN: 1992-8645 www.jatit.org E-ISSN: 1817-3195 of base stations in the specified service area can be
reduced while still reaching coverage area of service and total traffic served. GA modification by combining Fuzzy systems are implemented for positioning BTS produces vast increase in the coverage and capacity of traffic.
In [5] and [11] the optimization is done to get the number and placement of base stations in areas that are planned network, whereas in this paper, the optimization is done to get a number and select precisely position the base stations that already exist, based on the number of BTS ideal results planning taking into account its coverage, as well as techniques that we propose in methodology.
4. FUZZY C-MEANS (FCM) AND GENETIC
ALGORITHM (GA)
Fuzzy Clustering is one technique for determining the optimal cluster in a vector space based on normal form for the Euclidian distance vector. Fuzzy Clustering is very useful for modeling fuzzy, especially in identifying the fuzzy rules. There are several clustering algorithms of data, one of which is the Fuzzy C-Means (FCM). FCM is a technique's lawyer-cluster where the existence of data that each data point in a cluster is determined by the degree of membership. FCM basic concept, the first is to determine the center of the cluster, which will mark the average location for each cluster. In the initial condition, the center of the cluster is still not accurate. Each data point has a degree of membership for each cluster. By fixing the center of the cluster and the degree of membership of each data point repeatedly, it will be seen that the center of the cluster will move towards the right location. This loop is based on minimization of the objective function that describes the distance from the given data point to the center of the cluster are weighted by the degrees of membership of data points [12].
A genetic algorithm (GA) is a search heuristic that mimics the process of natural selection in the field of artificial intelligence. This heuristic (also sometimes called a metaheuristic) is routinely used to generate useful solutions to optimization and search problems. Genetic algorithms belong to the larger class of evolutionary algorithms (EA), which generate solutions to optimization problems using techniques inspired by natural evolution, such as inheritance, mutation, selection, and crossover. In a genetic algorithm, a population of candidate solutions to an optimization problem is evolved toward better solutions. Each candidate solution has a set of properties (its chromosomes or genotype)
which can be mutated and altered; traditionally, solutions are represented in binary as strings of 0 and 1, but other encodings are also possible [13].
5. THE PROPOSED METHOD
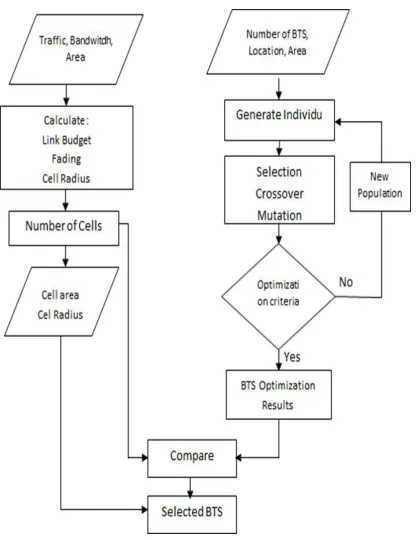
[image:3.612.313.521.383.653.2]In this paper, we propose a new method in determining the number of base stations at a minimum, to get the coverage area of the widest service, by selecting the existing base stations, through three stages steps: determination of the number of cells ideal, election position BTS using GA and calculates the coverage area. The data required in this work are the distribution of the population, the position of BTS and the needs of the user traffic. These data are input parameters to produce the number of base stations and coverage area based mobile telecom network planning as a flowchart in Figure 1. The output planning of the network will be used as a reference to determine the ideal number of base stations. The data related to the existing BTS, such as location, cell area and number of BTS used as input parameters for optimization. Steps are as follows :
ISSN: 1992-8645 www.jatit.org E-ISSN: 1817-3195 231 [14]. In this work, there are three mobile
[image:4.612.317.515.73.245.2]operators, namely: operators A, B and C, each operator has a frequency bandwidth and the number of existing base stations as the table below
Table 1. Frequency Bandwidth and Number of Existing Tower
Operator Bandwidth
The Number of Exisitig BTS
A 10Mhz 55
B 7,5Mhz 52
C 7,5Mhz 47
Figure 2. The Distribution Of The Existing BTS Towers
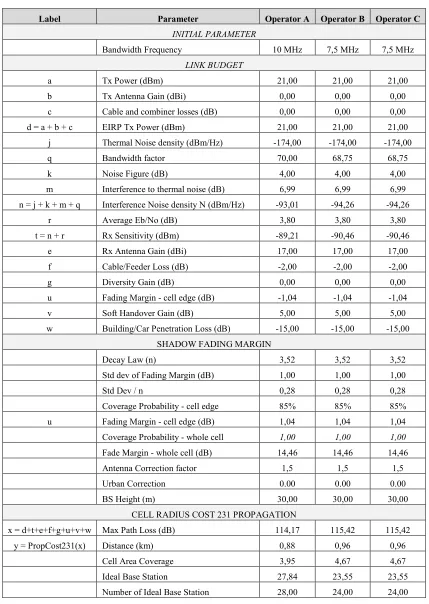
In this work, it is assumed height of each tower is 30 meters, by using link budget calculation [15], then obtained the number and radius of the BTS, as presented in Table 2. It can be seen the number of BTSs, which needed for each operator, namely for the operator A with a width of 10 MHz bandwidth needed 28 BTS, whereas for operator B and C with a width of 7.5 MHz bandwidth needed 24 BTS.
6. RESULTS AND DISCUSSION
6.1. Clustering Existing Tower using FCM
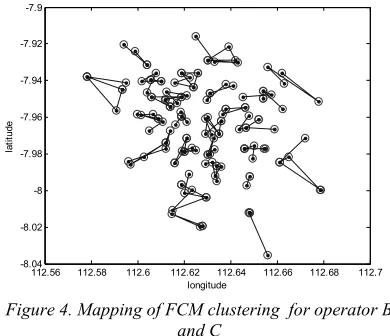
The purpose of Clustering existing tower is to get the point of cluster centers are evenly distributed throughout the deployment area of BTS tower. Clustering towers are based on the location of the tower, while the number of clusters in this work, is determined by the results of the planning cell. The resulting clusters, be the basis of the GA optimization process.
112.56 112.58 112.6 112.62 112.64 112.66 112.68 112.7
-8.04 -8.02 -8 -7.98 -7.96 -7.94 -7.92 -7.9
longitude
la
ti
tu
d
e
Figure 3. Mapping of FCM clustering for operator A
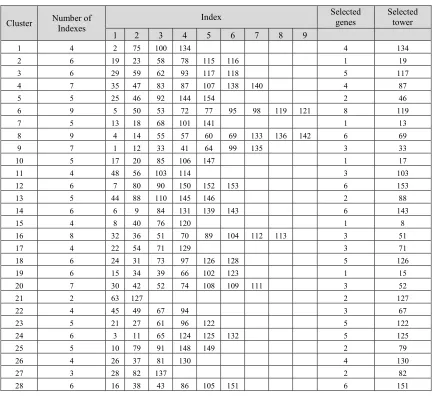
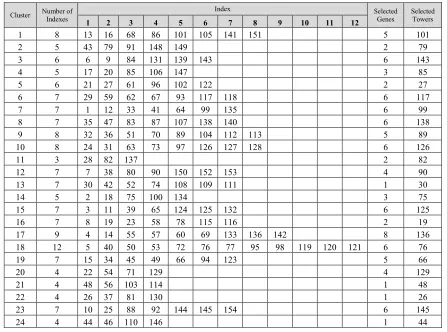
The results of FCM, for the operator A as much as 28 clusters, while for the operator B and C each with 24 clusters, where the number of members of each cluster will vary depending on the density of towers in the area. Tables 3 and 4 represent the members of each cluster.
112.56 112.58 112.6 112.62 112.64 112.66 112.68 112.7
-8.04 -8.02 -8 -7.98 -7.96 -7.94 -7.92 -7.9
longitude
la
ti
tu
d
[image:4.612.93.298.151.406.2]e
Figure 4. Mapping of FCM clustering for operator B and C
6.2. Genetic Algorithm for The Optimization of The Number of BTS Towers
The purpose of this GA optimization is to select the BTS tower of each cluster, so as to produce a number of BTS tower with the widest coverage area. The fitness function of this optimization is the percentage of the covered area to the area planned.
City BTS Total
L L L
area
Coverage ∩
−
= ………... (1)
[image:4.612.318.513.352.520.2]ISSN: 1992-8645 www.jatit.org E-ISSN: 1817-3195 − + < + = = ∩ others 4 D r r D r r D cos r 2r D r r if 0 j i if 0 2 ij j i ij j 1 ij j i ij Tj Ti ij L (2) ij ∩
L is the area of the slice between BTSi to
BTSj, is the radius of BTSj, and is distance BTSi to BTSj. GA input parameters for optimization are as follows:
Table 3. The input parameters for GA Optimization Parameter Values
Number of Towers 154
Number of chromosomes
200
Number of genes/chromosome
28 & 24
Minimum boundary 1
Maximum boundary Number of Tower indexes/cluster Probability of crossover 0.9
Probability of mutation 0.8
The GA optimization steps are as folows : a. Generating initial population
Generate 200 chromosomes, each chromosome consists of a number of genes in the form of random numbers with a size of 1 x number of indexes for each cluster. examples of this chromosome :
Chromosomes with 28 genes = [5 2 7 3 2 3 3 5 4 1 2 1 2 2 2 6 2 5 2 6 1 2 4 6 2 1 1 5]
b.Selection with elitist methods
200 chromosomes that have been generated, then be selected as much as 90 percent based on the order of fitness starting from the best to the worst
c. Crossover with methods of N-Point Crossover Crossover chromosome result of selection to get the parents, by generating random numbers [0.1] for each chromosome with probability 0.9. Chromosome with a random value less than or equal to 0.9 used as a parent, where the number of chromosomes as much as half of the initial population. The method of crossover using N-point crossover with 12 N-points.
Illustration of N-Point Crossover is as follows: 1. At couple-1, parents-1 is the chromosome-125
and parent-2 is chromosome 96
Parent-1 : [4 1 3 5 3 1 2 2 7 3 1 4 1 6 3 6 2 3 6 7 2 2 2 1 4 4 2 2]
Parent-2 : [3 1 1 1 4 9 4 4 6 1 1 4 2 2 3 8 1 4 3 3 1 1 3 5 2 3 3 1]
2. Generate a random number as many as 12 points with a minimum limit is 1 and the
maximum limit is the number of genes on a chromosome, which is 28.
Point Crossover : [2 2 5 6 9 16 17 18 19 20 22 25] 3. Then genes that will be crossover is:
a. Gen 2 until to Gen 2 b. Gen 5th to 6th Gen c. Gen 9th to 16th Gen d. Gen 17th to 18th Gen e. Gen 19th to 20th Gen f. Gen 22scnd to 25th Gen
4. Crossover produce two offspring chromosomes (chromosome as a result of crossover and mutation)
Crossover applies to all couples (100 couples) who produce 200 offspring, to be the new population and then carried the mutation.
a. Mutations by using inverse mutation
Probability of mutation is 0.8, this modificated iverse mutation method as follows:
1. Suppose one were elected to do chromosome mutation process is as follows:
Parent-1 : [4 1 3 5 4 9 2 2 6 1 1 4 2 2 3 8 1 4 3 3 2 1 3 5 2 4 2 2]
2. If the gene selected is the gene 17 (or cluster 17th, see table 3), the cluster has an index cluster of 4, in which the gene which has an index the same cluster is gene-1, 11, 15, 17, 22 and 26. Then:
b. Establishment of a new generation
The formation of the new generation is produced from 10% chromosomal mutation, plus 10% of the best chromosome in the initial population and 80% of the population of the new generation. The composition is obtained after repeated testing, to avoid local optima so as to achieve value converges.
ISSN: 1992-8645 www.jatit.org E-ISSN: 1817-3195
0 20 40 60 80 100 120 140 160 180 200
56 58 60 62 64 66 68 70 72 74
iteration
fi
tn
e
s
s
[image:6.612.97.523.70.253.2]Figure 5. Result of optimization for operator A
[image:6.612.92.295.360.512.2]Figure 5 shows the value of fitness in the 110th iteration converges with the value reaching 72.79, which means that the iteration has produced the best chromosome as the composition of the selected BTS with an area of coverage is 72.79% of the planned area.
Figure 6. BTS Plotting of Operator A
0 20 40 60 80 100 120 140 160 180 200
56 58 60 62 64 66 68 70 72 74 76
iteration
fi
tn
e
s
s
Figure 7. Result of optimization for operator B and C
Figure 8. BTS Plotting for operator B and C
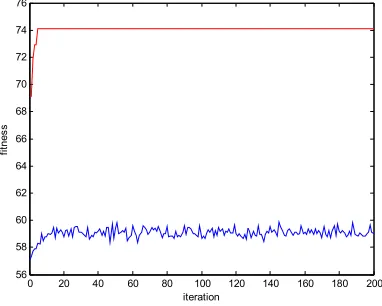
Figure 7 shows the value of fitness in the 6th iteration converges with the value reaching 74.0721, which means that the iteration has produced the best chromosome as the composition of the selected BTS with an area of coverage is 74.0721% of the planned area. Table 6. shows the composition of the selected BTS, optimization results for operator A, B and C. There were 7 BTSs, which are used together the results of optimization of the three operators, namely the tower to 19, 79, 82, 117 , 125, 126 and 143. Thus, of the 154 towers in the city of Malang, the three operators are quite occupies 45 existing towers, with the ability coverage for the operator A 68.55% and 74.07% for operator B and C. the results ploting BTS placement of the three operators are presented in the figure below.
* operator A = Yellow, Operator B and C = Red.
Figure 8. Plotting Results Optimization Operator A, B and C
5. CONCLUSION
[image:6.612.316.520.470.628.2] [image:6.612.104.295.544.697.2]ISSN: 1992-8645 www.jatit.org E-ISSN: 1817-3195 the cell tower, while the number of clusters based
on the number of BTS generated by the planning cell. Results of clustering can be used as input parameters of the proposed method, as the chromosomes of the initial population. We have tested the method proposed by various chromosomal composition of the new population to produce the best fitness of GA optimization. The results of the chromosomal arrangement that we formulated as the establishment of new populations, able to avoid being trapped in a local optimum.
In this paper, we have worked to optimize existing number of BTS towers in the city of Malang based on considerations of coverage, so there are 45 towers selected from 154 towers. Area coverage for the operator A is 72.79% while the operators A and B is 74.07% of the total area planned. The results of the optimization is plotted into a digital map shows that there are blank spots on the planned area, but the area is suburban blank spot with a few users.
ACKNOWLEDGMENT
This research was supported by Lembaga Penelitian dan Pengabdian Masyrakat – Universitas Widyagama Malang, and the Ministry of Research, Technology and Higher Education of the Republic of Indonesia. My thanks to both institutions that have supported this research activity.
REFERENCES
[1] A. Qustoniah and others, “Analisis Colocation Site Sebagai Acuan Dalam Penataan Menara
Ekomunikasi Seluler Di Wilayah Kota
Malang,” WIDYA Tek., vol. 22, no. 1, 2014. [2] W. A. Prijono, “Penataan Menara BTS (Cell
Planning),” J. EECCIS, vol. 4, no. 1, p. pp–50, 2012.
[3] D. P. Umum, “Undang-Undang No. 26 Tahun 2007 Tentang Penataan Ruang,” Dinas Pekerj. Umum Jkt., 2007.
[4] B. Haider, M. Zafrullah, and M. K. Islam, “Radio frequency optimization & QoS evaluation in operational GSM network,” in Proceedings of the world Congress on Engineering and Computer Science, 2009, vol. 1, pp. 393–398.
[5] C. O. Alenoghena, J. O. Emagbetere, and F. O. Edeko, “Application of Genetic Algorithm in Radio Network Coverage Optimization–A
Review,” Int. J. Comput. Appl., vol. 66, no. 12, 2013.
[6] A. R. Mishra, Fundamentals of cellular network planning and optimisation: 2G/2.5 G/3G... evolution to 4G. John Wiley & Sons, 2004.
[7] A. R. Mishra, Advanced cellular network planning and optimisation: 2G/2.5 G/3G... evolution to 4G. John Wiley & Sons, 2007. [8] S. Hurley, “Planning effective cellular mobile
radio networks,” Veh. Technol. IEEE Trans. On, vol. 51, no. 2, pp. 243–253, 2002.
[9] O. Kariv and S. L. Hakimi, “An algorithmic approach to network location problems. II: The p-medians,” SIAM J. Appl. Math., vol. 37, no. 3, pp. 539–560, 1979.
[10] J. Munyaneza, A. Kurien, and B. Van Wyk, “Optimization of antenna placement in 3G networks using genetic algorithms,” in Broadband Communications, Information Technology & Biomedical Applications, 2008 Third International Conference on, 2008, pp. 30–37.
[11] M. Fachrie, S. Widowati, and A. T. Hanuranto, “Implementasi Fuzzy Evolutionary Algorithms Untuk Penentuan Posisi Base Transceiver Station (BTS),” in Seminar Nasional Aplikasi Teknologi Informasi (SNATI), 2012.
[12] J. C. Bezdek, R. Ehrlich, and W. Full, “FCM: The fuzzy c-means clustering algorithm,” Comput. Geosci., vol. 10, no. 2, pp. 191–203, 1984.
[13] D. Whitley, “A genetic algorithm tutorial,” Stat. Comput., vol. 4, no. 2, pp. 65–85, 1994. [14] J. B. Andersen, T. S. Rappaport, and S.
Yoshida, “Propagation measurements and models for wireless communications channels,” Commun. Mag. IEEE, vol. 33, no. 1, pp. 42–49, 1995.
[15] P. K. Sharma and R. K. Singh, “Cell coverage area and link budget calculations in GSM system,” Int. J. Mod. Eng. Res. IJMER Vol, vol. 2, pp. 170–176, 2012.
ISSN: 1992-8645 www.jatit.org E-ISSN: 1817-3195
[image:8.612.92.521.106.710.2]171
Table 2. Results of Planning the Number of BTS
Label Parameter Operator A Operator B Operator C
INITIAL PARAMETER
Bandwidth Frequency 10 MHz 7,5 MHz 7,5 MHz
LINK BUDGET
a Tx Power (dBm) 21,00 21,00 21,00
b Tx Antenna Gain (dBi) 0,00 0,00 0,00
c Cable and combiner losses (dB) 0,00 0,00 0,00
d = a + b + c EIRP Tx Power (dBm) 21,00 21,00 21,00
j Thermal Noise density (dBm/Hz) -174,00 -174,00 -174,00
q Bandwidth factor 70,00 68,75 68,75
k Noise Figure (dB) 4,00 4,00 4,00
m Interference to thermal noise (dB) 6,99 6,99 6,99
n = j + k + m + q Interference Noise density N (dBm/Hz) -93,01 -94,26 -94,26
r Average Eb/No (dB) 3,80 3,80 3,80
t = n + r Rx Sensitivity (dBm) -89,21 -90,46 -90,46
e Rx Antenna Gain (dBi) 17,00 17,00 17,00
f Cable/Feeder Loss (dB) -2,00 -2,00 -2,00
g Diversity Gain (dB) 0,00 0,00 0,00
u Fading Margin - cell edge (dB) -1,04 -1,04 -1,04
v Soft Handover Gain (dB) 5,00 5,00 5,00
w Building/Car Penetration Loss (dB) -15,00 -15,00 -15,00
SHADOW FADING MARGIN
Decay Law (n) 3,52 3,52 3,52
Std dev of Fading Margin (dB) 1,00 1,00 1,00
Std Dev / n 0,28 0,28 0,28
Coverage Probability - cell edge 85% 85% 85%
u Fading Margin - cell edge (dB) 1,04 1,04 1,04
Coverage Probability - whole cell 1,00 1,00 1,00
Fade Margin - whole cell (dB) 14,46 14,46 14,46
Antenna Correction factor 1,5 1,5 1,5
Urban Correction 0.00 0.00 0.00
BS Height (m) 30,00 30,00 30,00
CELL RADIUS COST 231 PROPAGATION
x = d+t+e+f+g+u+v+w Max Path Loss (dB) 114,17 115,42 115,42
y = PropCost231(x) Distance (km) 0,88 0,96 0,96
Cell Area Coverage 3,95 4,67 4,67
Ideal Base Station 27,84 23,55 23,55
ISSN: 1992-8645 www.jatit.org E-ISSN: 1817-3195
Table 3. Results of Clustering the Tower of Operator A and Selected Tower
Cluster Number of Indexes
Index Selected
genes
Selected tower
1 2 3 4 5 6 7 8 9
1 4 2 75 100 134 4 134
2 6 19 23 58 78 115 116 1 19
3 6 29 59 62 93 117 118 5 117
4 7 35 47 83 87 107 138 140 4 87
5 5 25 46 92 144 154 2 46
6 9 5 50 53 72 77 95 98 119 121 8 119
7 5 13 18 68 101 141 1 13
8 9 4 14 55 57 60 69 133 136 142 6 69
9 7 1 12 33 41 64 99 135 3 33
10 5 17 20 85 106 147 1 17
11 4 48 56 103 114 3 103
12 6 7 80 90 150 152 153 6 153
13 5 44 88 110 145 146 2 88
14 6 6 9 84 131 139 143 6 143
15 4 8 40 76 120 1 8
16 8 32 36 51 70 89 104 112 113 3 51
17 4 22 54 71 129 3 71
18 6 24 31 73 97 126 128 5 126
19 6 15 34 39 66 102 123 1 15
20 7 30 42 52 74 108 109 111 3 52
21 2 63 127 2 127
22 4 45 49 67 94 3 67
23 5 21 27 61 96 122 5 122
24 6 3 11 65 124 125 132 5 125
25 5 10 79 91 148 149 2 79
26 4 26 37 81 130 4 130
27 3 28 82 137 2 82
ISSN: 1992-8645 www.jatit.org E-ISSN: 1817-3195
Table 4. Results of Clustering the Tower of Operator B and C and Selected Tower
Cluster Number of
Indexes
Index Selected
Genes
Selected Towers
1 2 3 4 5 6 7 8 9 10 11 12
1 8 13 16 68 86 101 105 141 151 5 101
2 5 43 79 91 148 149 2 79
3 6 6 9 84 131 139 143 6 143
4 5 17 20 85 106 147 3 85
5 6 21 27 61 96 102 122 2 27
6 7 29 59 62 67 93 117 118 6 117
7 7 1 12 33 41 64 99 135 6 99
8 7 35 47 83 87 107 138 140 6 138
9 8 32 36 51 70 89 104 112 113 5 89
10 8 24 31 63 73 97 126 127 128 6 126
11 3 28 82 137 2 82
12 7 7 38 80 90 150 152 153 4 90
13 7 30 42 52 74 108 109 111 1 30
14 5 2 18 75 100 134 3 75
15 7 3 11 39 65 124 125 132 6 125
16 7 8 19 23 58 78 115 116 2 19
17 9 4 14 55 57 60 69 133 136 142 8 136
18 12 5 40 50 53 72 76 77 95 98 119 120 121 6 76
19 7 15 34 45 49 66 94 123 5 66
20 4 22 54 71 129 4 129
21 4 48 56 103 114 1 48
22 4 26 37 81 130 1 26
23 7 10 25 88 92 144 145 154 6 145
24 4 44 46 110 146 1 44
Table 6. Composition of selected BTS Tower as the Result of Optimization
No. 1 2 3 4 5 6 7 8 9 10 11 12 13 14 15 16 17 18 19 20 21 22 23 24 25 26 27 28
Opetator A 8 13 15 17 19 33 46 51 52 67 69 71 79 82 87 88 103 117 119 122 125 126 127 130 134 143 151 153
[image:10.612.88.523.480.534.2]