Identification of Sepsis-Causing Bacteria in Spiked Blood Culture
Sung H. Lim,aSamantha Mix,bZeyu Xu,bBrian Taba,aIndre Budvytiene,bAnders N. Berliner,aNuria Queralto,aYair S. Churi,a Richard S. Huang,aMichael Eiden,aRaymond A. Martino,aPaul Rhodes,aNiaz Banaeib,c,d
Specific Technologies, Mountain View, California, USAa
; Departments of Pathologyb
and Medicine,c
Division of Infectious Diseases Geographic Medicine, Stanford University School of Medicine, Stanford, California, USA; Clinical Microbiology Laboratory, Stanford University Medical Center, Palo Alto, California, USAd
Sepsis is a medical emergency demanding early diagnosis and tailored antimicrobial therapy. Every hour of delay in initiating effective therapy measurably increases patient mortality. Blood culture is currently the reference standard for detecting blood-stream infection, a multistep process which may take one to several days. Here, we report a novel paradigm for earlier detection and the simultaneous identification of pathogens in spiked blood cultures by means of a metabolomic “fingerprint” of the vola-tile mixture outgassed by the organisms. The colorimetric sensor array provided significantly faster detection of positive blood cultures than a conventional blood culture system (12.1 h versus 14.9 h,P<0.001) while allowing for the identification of 18 bacterial species with 91.9% overall accuracy within 2 h of growth detection. The colorimetric sensor array also allowed for dis-crimination between unrelated strains of methicillin-resistantStaphylococcus aureus, indicating that the metabolomic finger-print has the potential to track nosocomial transmissions. Altogether, the colorimetric sensor array is a promising tool that of-fers a new paradigm for diagnosing bloodstream infections.
B
loodstream infection (BSI) due to bacteria and fungi is amed-ical emergency demanding early diagnosis and tailored
anti-microbial therapy (1). Every hour of delay in the diagnosis of
sepsis increases patient mortality (2). A definitive diagnosis of BSI
is achieved through the recovery of the organisms from blood (3).
Currently, clinical laboratories employ a two-step strategy: the first step involves the use of an automated blood culture system to detect the presence of growing organisms in blood culture. This is achieved through sensing a change in the pH or headspace pres-sure. In the second step, positive cultures are processed for species identification using phenotypic and genotypic assays. Phenotypic methods include a coagulase tube test for staphylococci, biochem-ical arrays in automated identification systems, and most recently, matrix-assisted laser desorption ionization–time of flight mass
spectrometry (MALDI-TOF MS) (4,5). Genotypic identification
methods include fluorescencein situhybridization (FISH) with
peptide nucleic acid (PNA) probes for a limited number of species and several commercially available multiplex nucleic acid ampli-fication tests (NAATs) for a broad range of species recovered from
blood cultures (3,5–8). With the existing blood culture systems,
the time to positive result typically ranges from 1 to 3 days, and an additional 1 to 2 days is needed for species identification with conventional methods, although MALDI-TOF MS and genotypic methods have shortened this time to hours instead of days. Mean-while, patients are treated empirically with broad-spectrum anti-biotics until the etiologic agent is identified and its susceptibility to
antibiotics is determined (3). This approach puts the patient at
risk for ineffective antimicrobial therapy and selection for antibi-otic-resistant organisms.
Other assays used to speed up the diagnosis of BSI include NAATs for organisms and enzyme immunoassays for
inflamma-tory biomarkers in whole blood and serum, respectively (3).
How-ever, NAATs do not have sufficient sensitivity and specificity to
replace microbial cultures (9), while biomarkers are nonspecific
and unable to identify the etiology (10, 11). Thus, novel
ap-proaches are needed to reduce time to diagnosis of BSI.
The colorimetric sensor array (CSA) is an artificial olfaction technology used for rapid and accurate discrimination of complex
mixtures or volatile organic compounds (VOCs) (12, 13). The
CSA consists of a high-dimensional array of diverse chemically responsive indicators embedded in a nanoporous matrix. Each indicator has distinct chemical reactivity with volatiles and changes different colors upon exposure to VOCs at concentra-tions as low as parts-per-billion. The resulting pattern of color changes comprises a high-dimensional signature that is unique for each volatile mixture. Moreover, the CSA includes rapidly revers-ible indicators that allow the sensor to track temporal fluctuations in headspace VOCs. When placed in bacterial cultures growing on agar, the CSA can distinguish between bacterial species with
98.8% accuracy (14). In this report, we describe the application of
the CSA for early detection and the simultaneous identification of blood cultures inoculated with sepsis-causing bacteria. We also describe the potential application of the CSA for discriminating
different strains of methicillin-resistant Staphylococcus aureus
(MRSA).
MATERIALS AND METHODS
Blood culture preparation.Bacterial species and strains were obtained from the Stanford University Medical Center clinical microbiology labo-ratory strain collection. Eighteen species of bacteria commonly recovered
Received28 August 2013 Returned for modification3 October 2013
Accepted3 December 2013
Published ahead of print11 December 2013
Editor:G. A. Land
Address correspondence to Niaz Banaei, [email protected], or Sung H. Lim, [email protected].
Supplemental material for this article may be found athttp://dx.doi.org/10.1128 /JCM.02377-13.
Copyright © 2014, American Society for Microbiology. All Rights Reserved.
doi:10.1128/JCM.02377-13
on May 16, 2020 by guest
http://jcm.asm.org/
from blood cultures (15) were selected for building species-specific CSA signatures (see Table S1 in the supplemental material). Each species was represented by one type strain from the American Type Culture Collec-tion (ATCC) and two clinical strains, except forS. aureus, which had 11 clinical strains, and forEnterobacter cloacae, which had only one clinical strain. For inoculum preparation, colonies from sheep blood agar (Difco) were suspended in sterile saline, and the turbidity was adjusted to a 0.5 McFarland standard. Each suspension was then serially diluted and plated to confirm the concentration. A bacterial suspension of 0.5 ml from the appropriate dilution (see below) was injected into a BacT/Alert standard aerobic bottle (bioMérieux, Inc.), along with 10 ml of whole blood pur-chased from Stanford University Blood Center. For initial experiments, the content of blood culture bottles was aseptically transferred to a petri dish. For subsequent experiments, the inoculated bottle was tested using either the BacT/Alert system or the CSA system. For the CSA system, the bottle septum was replaced with the CSA adaptor prior to incubation (Fig. 1). The inoculum concentration was 10 CFU/ml in blood culture bottle trials and ranged from 2.5 to 1,000 CFU/ml of blood in the petri dish trials. Blood culture bottles inoculated with blood without organisms were in-cluded as negative controls. Upon the completion of each trial, the blood culture medium was plated onto sheep blood agar to confirm purity. The detailed list of all trials, including the technical and biological repetitions, is shown in Table S1 in the supplemental material.
CSA blood culture prototype instrument.The CSA system has two major components: a disposable sensor and an optical scanner (Fig. 1). The manufacturing procedures of the CSA have been described previously (12,16). A cap was custom designed to fit bioMérieux’s standard aerobic bottle due to availability of the BacT/Alert 3D automated blood culture system in our laboratory. The sensor array was mounted inside the trans-parent cap or placed on a petri dish cover with a sufficient air gap to ensure adequate diffusion of the headspace gases.
Detection time.The CSA was imaged every 20 min after inoculation using a flatbed scanner. For each image, red, green, and blue (RGB) color values were extracted to create a time series of color changes. Using this time series, bacterial growth was detected by one of three trigger indicators in the sensor array. To identify each trigger indica-tor, the time series for each trial in the targeted species was reduced to the minimum and maximum slopes of the RGB color changes for each indicator during that trial. Each feature was ranked using Welch’s two-tailedt test with false-discovery-rate correction, and a logistic regression analysis was used to fit a detection threshold for the feature with the lowest correctedPvalue. The detection time was defined as the earliest time that any of the three trigger indicator slopes crossed its detection threshold.
Species classifier.To create a CSA signature for each species, the slopes of the RGB color changes were sampled for each indicator at 1-h intervals, starting 3 h before the detection time and up to 9 h after detec-tion. A species classifier was constructed by training a support vector machine (SVM) on the time series of color changes using theC-support vector classification (C-SVC) implementation in LibSVM (17). Ten rep-etitions of 10-fold stratified cross-validation were used to evaluate classi-fier performance on a test set that did not include the training set used to build the classifier. One-versus-all classification performance for individual classes was constructed using sensitivity, specificity, and predictive values (18). Feature selection and classification were
per-formed in R using the stats and e1071 packages as well as the data mining framework RapidMiner (19). Exact binomial confidence inter-vals were computed with the binom package (20).
Strain typing.Pulsed-field gel electrophoresis (PFGE) genotyping was performed as previously described (21). The PFGE dendrogram was gen-erated by BioNumerics (22). The similarity between the patterns was cal-culated using the Dice coefficient with settings at 1.25% optimization, 1.25% tolerance, and a “change toward the end of the fingerprint” value of 0.5%. The cluster analysis was done using the unweighted pair group method with arithmetic averages. CSA strain typing was performed by inoculating 9 different strains of MRSA at 10 CFU/ml in our standard blood culture bottle and collecting the sensor responses. For the CSA analysis, principal component analysis was performed, and the resulting 10 most important principal components were used for hierarchical clus-ter analysis using the minimum variance method.
RESULTS
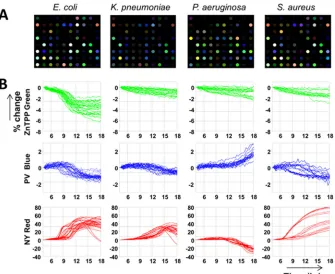
Species-specific CSA signatures in blood culture.To establish that the CSA can detect species-specific VOC signatures in blood culture, we inoculated petri dishes with the BacT/Alert aerobic blood culture medium, human whole blood, and various
concen-trations (2.5 to 1,000 CFU/ml) ofS. aureus,Escherichia coli,
Kleb-siella pneumoniae, andPseudomonas aeruginosaand monitored the CSA response over time. After an initial equilibration to the VOCs released by the growth medium itself, bacterial growth trig-gered a species-specific pattern of color changes. The CSA kinetic profile showed a highly dynamic pattern, which is reflective of the
changes in the headspace VOC composition over time (Fig. 2).
Using the kinetic profiles, the CSA was able to discriminate the four bacterial species with 96.8% accuracy (95% confidence inter-val [CI], 87.6 to 100%; see Table S2 in the supplemental material). The detection times at lower bacterial concentrations lagged be-hind the detection times at higher bacterial concentrations. How-ever, the species-specific responses of key colorimetric indicators were independent of inoculum concentration.
Library construction of bacterial CSA signatures. Encour-aged by the result in the petri dishes, we constructed a library of CSA signatures for 18 bacterial species in the BacT/Alert blood culture bottles using the CSA blood culture prototype instrument (Fig. 1). In total, we assembled a data set of 1,192 blood culture trials. Out of 73 different indicators in the sensor array, 53 had a very strong response to bacterial volatiles. Most indicators re-sponded with dynamic patterns, while a few indicators, such as Nile red, showed no response to any bacteria. Furthermore, one
indicator, 5,10,15,20-tetrakis(4-methoxyphenyl)-21H,23H
-por-phine cobalt(II), was particularly important, as it consistently
de-tectedAcinetobacter baumannii, which generally had a weaker
re-sponse than most other bacteria. A heat map used to visualize the average rates of color change with the CSA revealed unique
signa-tures for the 18 species (Fig. 3). An accompanying dendrogram
revealed the relationship between 18 bacterial species based on
their VOC signatures (Fig. 3) (23).
Detection time and identification accuracy.The CSA de-tected the presence of bacteria in the blood culture bottles (10 CFU/ml of blood) with 99.9% sensitivity. Most bacteria were
de-tected within 13 h, but some species, such asStaphylococcus
epi-dermidisandStaphylococcus lugdunensis, required longer
incuba-tion periods. Furthermore, certain species, such asEnterococcus
faecium, had a larger standard deviation for detection time due to
strain variability (strain ATCC 27270, 10.4 h⫾0.3 h; strain IS-09,
20.1 h⫾0.6 h; strain IS-23, 12.61 h⫾0.6 h) and had an average
FIG 1Shown are the CSA with 73 indicators and 3 black fiducial markers (A), cross-section of the sensor cap adaptor (B), CSA embedded blood culture bottle (C), and the CSA prototype shaker and scanner (D).
Colorimetric Sensor Array for Blood Culture Workup
on May 16, 2020 by guest
http://jcm.asm.org/
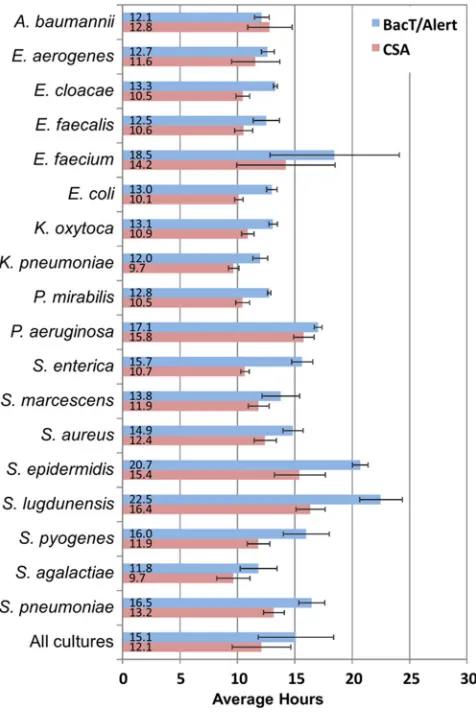
[image:2.585.42.286.66.120.2]detection time of 14.2 h with a standard deviation of⫾4.3 h. Overall, the CSA provided significantly faster detection with the blood cultures when directly compared to the bioMérieux BacT/
Alert system (12.1 h versus 14.9 h;P⬍0.001) (Fig. 4).
To evaluate the accuracy of the CSA for species identification, the sensitivity and specificity of the CSA were determined for each of the 18 species at the time of culture positivity and each
subse-quent hour, for a total of 9 h (Fig. 5). Several species, such asP.
aeruginosa,S. lugdunensis, andA. baumannii, were identified with
⬎90% sensitivity at the time of blood culture detection, while
other species had moderate sensitivities with an overall sensitivity of 82.5%. However, within 2 h after culture detection, sensitivity on average reached 91.9% (95% CI, 90.2 to 93.4%). With each additional hour, the identification sensitivity improved, and after 9 h, it reached an overall sensitivity and specificity of 95.3% (95% CI, 94.0 to 96.5%) and 99.7% (95% CI, 99.7 to 99.8%),
respec-tively (Fig. 5; see also Tables S3 and S4 in the supplemental
material).
Reproducibility of CSA signature.Certain experimental pa-rameters were not uniformly distributed for each species in our
FIG 2Bacterial VOC signatures with CSA. (A) Color difference maps of four bacterial species cultivated in blood. Each color represents the difference between the indicator color intensity measured before and after culture positivity. (B) Selected indicator time response at various concentrations (2.5 to 1,000 CFU/ml). Each line represents an independent trial. ZnTPP, 5,10,15,20-tetraphenyl-21H,23H-porphine zinc; PV, pyrocatechol violet; NY, nitrazine yellow.
FIG 3Heat map of average CSA sensor patterns for 18 species of bacteria and an uninoculated blood sample. For each trial, a 213-feature vector of the 73 indicators was created using RGB-color-change slopes at 6 h after the detection time. Each feature was standardized to have zero mean and unit variance across all trials and was assigned a column in the heat map. A cluster dendrogram to the left of the heat map displays the relationships between the patterns.
on May 16, 2020 by guest
http://jcm.asm.org/
[image:3.585.126.461.65.339.2] [image:3.585.134.454.540.694.2]data sets, including blood source (due to donor variability), blood storage type (fresh versus banked), inoculum concentra-tion (for petri dish trials only), and sensor manufacturing lot. To check that the high classification accuracy of the CSA was not due to spurious correlations with these potential
con-founders, we constructed principal component plots ofE. coli
andS. aureusand confirmed that varied blood source, inoculum concentrations, and array manufacturing lots did not affect the ability of the CSA to separate species (see Fig. S1 in the supple-mental material).
Strain classification.We investigated the ability of the CSA to discriminate between individual strains within a species. We used pulsed-field gel electrophoresis (PFGE) genotyping as a reference standard to classify the degree of genetic relatedness for 9 clinical
strains of MRSA comprising 3 genotypes (Fig. 6). Remarkably, the
two unrelated strains (genotypes B and C) separated completely from the cluster of seven related strains in a principal component space and hierarchical cluster analysis dendrogram, while the
ge-netically related strains (genotypes A and A1) overlapped
substan-tially, indicating that the metabolomic fingerprint can discrimi-nate between bacterial strains. However, further studies with more strains and species must be done to validate these prelimi-nary results.
DISCUSSION
We have demonstrated that the CSA system simultaneously detects and identifies bacterial species significantly faster than existing standard methods that only detect the presence or ab-sence of positive culture. We report the classification of all 18 clinically relevant species with 91.9% overall accuracy within 2 h of detection, which is approximately 1 h before the BacT/ Alert system reports the mere presence of bacteria. The CSA system combines incubation, detection, and identification into a single step, thus both speeding the time to positivity and furnishing a highly accurate system for species determination. The CSA also provides strain-specific data which may assist hospital epidemiologists in the identification and disruption of nosocomial outbreaks in real-time, which is not presently possible
FIG 4Comparison of time to detection by the CSA system (n⫽1,017) and the bioMérieux BacT/Alert system (n⫽92). The detection time for the CSA sys-tem is based on the average of a minimum of 33 trials per species versus 3 to 14 trials with the BacT/Alert system. The error bars represent the standard devi-ations of the detection time.
Sensitivity of CSA for Species Identification
Species n 0 hr +1 hr +2 hr +3 hr +4 hr +5 hr +6 hr +7 hr +8 hr +9 hr
uninoculated 103 99.1 100.0 100.0 100.0 100.0 100.0 100.0 100.0 100.0 100.0
P. aeruginosa 47 100.0 100.0 100.0 100.0 100.0 100.0 100.0 100.0 100.0 100.0
A. baumannii 50 91.6 96.2 99.8 99.8 100.0 100.0 100.0 100.0 98.8 98.0
S. lugdunensis 48 94.0 95.4 93.8 95.4 95.4 95.8 97.5 99.4 99.6 99.6
P. mirabilis 52 88.7 98.1 97.5 97.7 98.5 99.2 99.4 98.9 98.7 98.3
S. pneumoniae 79 89.2 92.4 94.7 94.9 93.9 93.8 94.9 94.9 95.7 96.6
S. marcescens 46 85.7 91.1 95.7 95.9 98.7 98.5 98.5 99.1 98.3 98.3
S. epidermidis 55 84.4 89.1 95.1 96.2 98.0 99.6 98.9 97.5 97.8 97.6
S. aureus 126 85.2 88.6 94.2 95.9 96.4 97.5 97.1 96.8 96.8 96.8
K. pneumoniae 68 81.9 87.8 93.2 96.3 96.5 96.6 96.8 97.4 97.4 96.6
S. pyogenes 68 74.1 90.9 89.0 89.0 89.1 89.0 90.2 90.0 90.3 91.0
E. faecium 70 84.7 87.4 88.7 89.3 89.4 88.7 90.9 92.7 93.3 93.9
E. coli 67 78.4 87.6 88.2 90.0 92.2 91.9 92.1 93.4 93.6 93.6
E. aerogenes 45 70.2 82.2 86.9 87.6 84.7 86.7 87.3 88.2 89.3 88.7
S. agalactiae 56 78.6 80.2 86.6 87.5 87.9 88.2 89.6 93.0 92.9 92.5
S. enterica 54 75.9 86.9 85.6 92.8 93.9 94.1 94.1 94.3 94.3 94.3
K. oxytoca 49 78.6 78.8 84.1 87.8 86.5 86.9 85.7 86.3 89.4 91.2
E. faecalis 76 78.3 82 83.3 87.8 83.2 84.2 86.7 89.5 88.6 90.3
E. cloacae 33 49.7 62.7 81.2 84.2 83.6 82.4 83.0 86.4 88.5 88.8
Total 1192 82.5 88.3 91.4 93.1 93.0 93.3 93.8 94.6 94.9 95.1
FIG 5Sensitivity of CSA for species identification as a function of time following culture detection. At each hour after blood cultures were detected by CSA, the sensitivity of CSA for culture identification was calculated. The color map is based on sensitivity value, in which red and green represent minimum (49.7%) and maximum (⬎93%) sensitivities, respectively.
Colorimetric Sensor Array for Blood Culture Workup
on May 16, 2020 by guest
http://jcm.asm.org/
[image:4.585.44.282.67.423.2] [image:4.585.135.450.510.694.2](24). The CSA method is intrinsically simple, safe, robustly repeat-able, and inexpensive, and thus offers an alternative platform for the characterization of blood cultures, particularly in resource-poor settings, where technical expertise is limited. Most impor-tantly, the CSA facilitates earlier treatment with species-specific antibiotics, leading to reduced utilization of unnecessary otics and improved outcome in patients receiving tailored antibi-otic regimens.
In recent years, MALDI-TOF MS has been developed for rapid and accurate identification of pathogens in blood
cul-tures (25). Although MALDI-TOF MS reduces the time to
identification when performed on blood cultures, it is not per-formed until a positive blood culture signal has been obtained, and therefore it registers a result hours after the methods re-ported here. It also requires blood culture handling and pro-cessing, which takes time, incurs labor costs, raises the possi-bility of human error in sample preparation, and can pose a biohazard risk to the operator. At present, successful identifi-cation rates for MALDI-TOF MS are good for Gram-negative species, for which adequate CFU/ml are present, but for Gram-positive species or comparatively dilute Gram-positive cultures, only
67% to 80% reached acceptable confidence score results (4).
Most recently, on-demand multiplex NAATs have been devel-oped and commercialized for the identification of up to 92% of
positive blood cultures (3,6). However, these tests also require
minor sample handling and processing of 1 to 4 h, which adds additional time to the laboratory diagnosis of BSI.
Sources of error that must be assessed as this system is
devel-oped for clinical use include the potential misclassification of sam-ples that contain bacterial species novel to the library, as well as mixed cultures and phenotypically distinct species that have very similar VOC patterns. The database in this study consisted of 1,192 entries of bacterial signatures derived from 18 different spe-cies, with an average of three different strains per spespe-cies, and we believe that the system will become increasingly accurate with the inclusion of more strains per species to account for the diversity that exists between strains in the population at large. Other diag-nostic databases, such as MALDI-TOF MS, address this issue by including at least 15 to 20 different isolates of one species to create
a reference spectrum for each species (26). It is likely that the
clinical introduction of the CSA system will require the generation of a pattern library built up with a similarly broad range of strains for each species classified.
Prior studies indicated that the bacterial concentrations in the blood of adult patients with BSI typically range from 1 to 30
CFU/ml (27–29). In this study, blood culture bottles were
spiked with bacterial species at a clinically relevant inoculum concentration of 10 CFU/ml of blood. As demonstrated with four species, the classification ability of the CSA is fairly robust with respect to variations in inoculum concentrations. Some
patients, however, may have⬍1 CFU/ml (30), which is outside
the boundary of the conditions evaluated here; future assess-ment is needed to assess the ability of the CSA to classify patho-gens in lower bacterial concentrations.
Although the results of this study are very promising, there is considerable room to improve CSA technology to achieve
FIG 6Strain-specific CSA signatures of methicillin-resistantS. aureusisolates. (A) Genotype data derived using pulsed-field gel electrophoresis typing. Genotype A consists of definitely related strains (sequence type 43 [ST-43], ST-44, ST-45, and ST-64); genotype A1(ST-47, ST-48, and ST-54) comprises strains closely
related to genotype A; genotype B (ST-49) and C (ST-65) strains are unrelated to genotype A. The similarity value at the root of the dendrogram is 40.09%. The similarity value at the node for the A and A1genotypes is 95.65%. The similarity value at the node for the B and C genotypes is 45.46%. (B and C) Principal
component analysis score plot (B) and hierarchical cluster analysis dendrogram (C) showing the separation of VOC signatures among the different strains of methicillin-resistantS. aureus. MWM, molecular weight marker.
on May 16, 2020 by guest
http://jcm.asm.org/
even shorter time to positivity of blood cultures. For example, the set of colorimetric indicators can be tuned to maximize the sensitivity to the volatiles released by sepsis-causing bacteria, and the growth medium can be optimized so that bacterial VOC production during growth includes the classes of volatiles to which the CSAs are most sensitive. Importantly, the BacT/ Alert bottles used in this study contain activated charcoal to absorb antibiotics, but charcoal is also well known to absorb VOCs. This may have limited the ability of our sensor to detect low concentrations of VOCs at the early stage of the bacterial growth cycle. Replacing activated charcoal with polymer beads
that are more selective for antibiotics (31) might enhance CSA
sensitivity and result in even faster detection and characteriza-tion of BSI.
In conclusion, the analysis of volatile metabolic biomarkers in the headspace of blood culture bottles using the CSA allowed for faster detection and the simultaneous identification of sep-sis-causing bacteria, and with great accuracy. This technology also demonstrated the ability to discriminate between bacterial strains. Altogether, the CSA holds promise for shortening the time to diagnosis of sepsis, thereby improving clinical out-comes.
ACKNOWLEDGMENTS
We thank Kenneth S. Suslick and Benjamin Pinsky for their helpful dis-cussion and Terry Weber for constructing a phylogenetic tree.
This work was supported by the National Institute of Allergy and Infectious Diseases grant 2R44AI094781.
S.H.L., B.T., A.N.B., N.Q., Y.S.C., R.S.H., M.E., R.A.M., and P.R. have an interest in Specific Technologies, which engineers and supplies CSAs.
REFERENCES
1.O’Grady NP, Barie PS, Bartlett JG, Bleck T, Carroll K, Kalil AC, Linden P, Maki DG, Nierman D, Pasculle W, Masur H, American College of Critical Care Medicine, Infectious Diseases Society of America.2008. Guidelines for evaluation of new fever in critically ill adult patients: 2008 update from the American College of Critical Care Medicine and the In-fectious Diseases Society of America. Crit. Care Med.36:1330 –1349.http: //dx.doi.org/10.1097/CCM.0b013e318169eda9.
2.Gaieski DF, Mikkelsen ME, Band RA, Pines JM, Massone R, Furia FF, Shofer FS, Goyal M.2010. Impact of time to antibiotics on survival in patients with severe sepsis or septic shock in whom early goal-directed therapy was initiated in the emergency department. Crit. Care Med.38: 1045–1053.http://dx.doi.org/10.1097/CCM.0b013e3181cc4824. 3.Mancini N, Carletti S, Ghidoli N, Cichero P, Burioni R, Clementi M.
2010. The era of molecular and other non-culture-based methods in di-agnosis of sepsis. Clin. Microbiol. Rev.23:235–251.http://dx.doi.org/10 .1128/CMR.00043-09.
4.Clark AE, Kaleta EJ, Arora A, Wolk DM. 2013. Matrix-assisted laser desorption ionization–time of flight mass spectrometry: a fundamental shift in the routine practice of clinical microbiology. Clin. Microbiol. Rev. 26:547– 603.http://dx.doi.org/10.1128/CMR.00072-12.
5.Versalovic J, Carroll KC, Funke G, Jorgensen JH, Landry ML, Warnock DW (ed).2011. Manual of clinical microbiology, 10th ed. ASM Press, Washington, DC.
6.Altun O, Almuhayawi M, Ullberg M, O¨ zenci V.2 October 2013. Clinical evaluation of FilmArray blood culture ID panel in identification of bacte-ria and yeast from positive blood culture bottles. J. Clin. Microbiol.http: //dx.doi.org/10.1128/JCM.01835-13.
7.Carretto E, Bardaro M, Russello G, Mirra M, Zuelli C, Barbarini D. 2013. Comparison of theStaphylococcusQuickFISH BC test with the tube coagulase test performed on positive blood cultures for evaluation and application in a clinical routine setting. J. Clin. Microbiol.51:131–135. http://dx.doi.org/10.1128/JCM.02103-12.
8.Deck MK, Anderson ES, Buckner RJ, Colasante G, Coull JM, Crystal B, Della Latta P, Fuchs M, Fuller D, Harris W, Hazen K, Klimas LL,
Lindao D, Meltzer MC, Morgan M, Shepard J, Stevens S, Wu F, Fiandaca MJ.2012. Multicenter evaluation of theStaphylococcus Quick-FISH method for simultaneous identification ofStaphylococcus aureusand coagulase-negative staphylococci directly from blood culture bottles in less than 30 minutes. J. Clin. Microbiol.50:1994 –1998.http://dx.doi.org /10.1128/JCM.00225-12.
9.Pammi M, Flores A, Leeflang M, Versalovic J.2011. Molecular assays in the diagnosis of neonatal sepsis: a systematic review and meta-analysis. Pediatrics128:E973–E985.http://dx.doi.org/10.1542/peds.2011-1208. 10. Marshall JC, Reinhart K, International Sepsis Forum.2009. Biomarkers
of sepsis. Crit. Care Med.37:2290 –2298.http://dx.doi.org/10.1097/CCM .0b013e3181a02afc.
11. Schuetz P, Christ-Crain M, Müller B.2007. Biomarkers to improve diagnostic and prognostic accuracy in systemic infections. Curr. Opin. Crit. Care13:578– 585.http://dx.doi.org/10.1097/MCC.0b013e3282c9ac2a.
12. Lim SH, Feng L, Kemling JW, Musto CJ, Suslick KS.2009. An opto-electronic nose for the detection of toxic gases. Nat. Chem.1:562–567. http://dx.doi.org/10.1038/nchem.360.
13. Suslick KS.2012. Synesthesia in science and technology: more than mak-ing the unseen visible. Curr. Opin. Chem. Biol.16:557–563.http://dx.doi .org/10.1016/j.cbpa.2012.10.030.
14. Carey JR, Suslick KS, Hulkower KI, Imlay JA, Imlay KRC, Ingison CK, Ponder JB, Sen A, Wittrig AE.2011. Rapid identification of bacteria with a disposable colorimetric sensing array. J. Am. Chem. Soc.133:7571–7576. http://dx.doi.org/10.1021/ja201634d.
15. Weinstein MP, Reller LB, Murphy JR, Lichtenstein KA. 1983. The clinical-significance of positive blood cultures: a comprehensive analysis of 500 episodes of bacteremia and fungemia in adults. I. Laboratory and epidemiologic observations. Rev. Infect. Dis.5:35–53.http://dx.doi.org /10.1093/clinids/5.1.35.
16. Lonsdale CL, Taba B, Queralto N, Lukaszewski RA, Martino RA, Rhodes PA, Lim SH. 2013. The use of colorimetric sensor arrays to discriminate between pathogenic bacteria. PLoS One8:e62726.http://dx .doi.org/10.1371/journal.pone.0062726.
17. Chih-Chung C, Chih-Jen L.2011. LIBSVM: a library for support vector machines. ACM Trans. Intell. Syst. Technol.2:27.http://dx.doi.org/10 .1145/1961189.1961199.
18. Brodersen KH, Ong CS, Stephan KE, Buhmann JM.2010. The balanced accuracy and its posterior distribution, p 3121–3124. Proceedings of the 20th International Conference on Pattern Recognition IEEE Computer Society, Washington, DC.
19. Mierswa I, Wurst M, Klinkenberg R, Scholz M, Euler T.2006. Rapid prototyping for complex data mining tasks, p 935–940. Proceedings of the 12th ACM SIGKDD International Conference on Knowledge Dis-covery and Data Mining (KDD-06). New York, NY, August 2006. 20. Dorai-Raj S.2009. binom: binomial confidence intervals for several
pa-rameterizations. R package version 1.0 –5. http://CRAN.R-project.org /package⫽binom.
21. Tenover FC, Arbeit RD, Goering RV, Mickelsen PA, Murray BE, Persing DH, Swaminathan B.1995. Interpreting chromosomal DNA restriction patterns produced by pulsed-field gel electrophoresis: criteria for bacterial strain typing. J. Clin. Microbiol.33:2233–2239.
22. McDougal LK, Steward CD, Killgore GE, Chaitram JM, McAllister SK, Tenover FC.2003. Pulsed-field gel electrophoresis typing of oxacillin-resistantStaphylococcus aureusisolates from the United States: establish-ing a national database. J. Clin. Microbiol.41:5113–5120.http://dx.doi .org/10.1128/JCM.41.11.5113-5120.2003.
23. Kolde R.2012. pheatmap: pretty heatmaps. R package version 0.7.7.http: //CRAN.R-project.org/package⫽pheatmap.
24. Snitkin ES, Zelazny AM, Thomas PJ, Stock F, Henderson DK, Palmore TN, Segre JA, NISC Comparative Sequencing Program.2012. Tracking a hospital outbreak of carbapenem-resistantKlebsiella pneumoniaewith whole-genome sequencing. Sci. Transl. Med. 4:148ra116.http://dx.doi .org/10.1126/scitranslmed.3004129.
25. Wimmer JL, Long SW, Cernoch P, Land GA, Davis JR, Musser JM, Olsen RJ.2012. Strategy for rapid identification and antibiotic suscepti-bility testing of Gram-negative bacteria directly recovered from positive blood cultures using the Bruker MALDI Biotyper and the BD Phoenix system. J. Clin. Microbiol.50:2452–2454.http://dx.doi.org/10.1128/JCM .00409-12.
26. Havlicek V, Lemr K, Schug KA. 2013. Current trends in microbial diagnostics based on mass spectrometry. Anal. Chem.85:790 –797.http: //dx.doi.org/10.1021/ac3031866.
Colorimetric Sensor Array for Blood Culture Workup
on May 16, 2020 by guest
http://jcm.asm.org/
27. Henry NK, McLimans CA, Wright AJ, Thompson RL, Wilson WR, Washington JA, Jr.1983. Microbiological and clinical evaluation of the isolator lysis-centrifugation blood culture tube. J. Clin. Microbiol.17: 864 – 869.
28. Kreger BE, Craven DE, Carling PC, McCabe WR.1980. Gram-negative bacteremia. III. Reassessment of etiology, epidemiology and ecology in 612 patients. Am. J. Med.68:332–343.http://dx.doi.org/10.1016/0002 -9343(80)90101-1.
29. Werner AS, Cobbs CG, Kaye D, Hook EW.1967. Studies on bacteremia
of bacterial endocarditis. JAMA202:199 –203.http://dx.doi.org/10.1001 /jama.202.3.199.
30. Dorn GL, Burson GG, Haynes JR.1976. Blood culture technique based on centrifugation: clinical evaluation. J. Clin. Microbiol.3:258 –263. 31. Zadroga R, Williams DN, Gottschall R, Hanson KE, Nordberg V, Deike
M, Kuskowski M, Carlson L, Nicolau DP, Sutherland C, Hansen GT. 2013. Comparison of 2 blood culture media shows significant differences in bacterial recovery for patients on antimicrobial therapy. Clin. Infect. Dis.56:790 –797.http://dx.doi.org/10.1093/cid/cis1021.