Multi-detector, Multi-modal Tracking Framework
Yiqi Zhong1, Suya You2, and Ulrich Neumann1 1
University of Southern California, Los Angeles CA 90007, USA
{yiqizhon,uneumann}@usc.edu 2
US Army Research Laboratory, Playa Vista CA 90094 [email protected]
Abstract. Different modalities have their own advantages and disadvantages. In a tracking-by-detection framework, fusing data from multiple modalities would ideally improve tracking performance than using a single modality, but this has been a challenge. This study builds upon previous research in this area. We propose a deep-learning based tracking-by-detection pipeline that uses multi-ple detectors and multimulti-ple sensors. For the input, we associate object proposals from 2D and 3D detectors. Through a cross-modal attention module, we opti-mize interaction between the 2D RGB and 3D point clouds features of each pro-posal. This helps to generate 2D features with suppressed irrelevant information for boosting performance. Through experiments on a published benchmark, we prove the value and ability of our design in introducing a multi-modal tracking solution to the current research on Multi-Object Tracking (MOT).
1
Introduction
Multi-object tracking (MOT) is a crucial task in many fields including robotics and autonomous driving. As different sensors (e.g., RGB camera, LiDAR, radar) get increasingly used together, the multi-modal MOT starts to attract research attention. The introduction of multi-modal solutions helps to better accomplish MOT tasks in a lot of ways. One benefit is that multiple sensors increase the diversity of object repre-sentations, which provides higher association reliability across objects from different timestamps.
In this study, we focus on the combined use of LiDAR and RGB camera sensors in MOT. Prior works on modal MOT have explored better strategies of multi-modal feature fusion for boosting tracking performance. They, however, overlook the interaction between features of different modality, which could have provided rich in-formation. For example, the 2D representation of a partially occluded vehicle would inevitably contain a certain amount of irrelevant information of other objects in the scene; however, the 3D representation is able to easily distinguish the vehicle from other objects. In this situation, we may introduce 3D features to interact with 2D fea-tures to suppress irrelevant signals. Following this thread, we propose a new feature fusion strategy. In our proposed method, features of different modalities are extracted separately before they fully interact with each other through a cross-modal attention
Fig. 1: Possible failure cases of single-detector methods for tracking. Scenario 1 shows three consecutive frames from the KITTI dataset. Even on the same object, a detector would make inconsistent detection decisions across frames. Hence, tracking failure may occur if only one detector is used. Scenario 2 demonstrates some typical limita-tions of 2D/3D detectors: the 2D detector failed to detect the partially visible object (a); the 3D detector failed to detect the small object (b).
module which is described in Sec. 3.3. The interaction-aware features are then used for inter-frame proposals association.
Tracking often relies on detection. Multi-modal trackers in previous research usu-ally require a detector to offer object proposals. The detector can be either 2D, 3D, or multi-modal. Different types of detectors have their own advantages and disadvan-tages: 2D detector has a higher precision but is sensitive to lighting conditions and occlusion; whereas 3D detector excels at handling occlusions but has high false alarm rates. Fig.1 shows two scenarios where the tracker may fail if we only use one type of detector. Intuitively, a multi-modal detectors should enable 2D and 3D features to complement each other’s weaknesses. However, recent multi-modal detectors like [1, 2] surprisingly do not outperform current SOTA 3D detector such as PointPillar [3] or PV-RCNN [4]. It appears that the community is still exploring an appropriate way to adopt the multi-modal setting in detection tasks. Hence, we propose the present study, which may be the first to associate multiple single-modal detectors in one tracking task. The cardinal challenge of our pipeline is how to reorganize proposals from mul-tiple detectors in order to simultaneously retain merits and suppress demerits of each
modality. To tackle this challenge, we design a classification module to re-classify raw proposals. We provide detailed explanations in Sec. 3.2.
Our work contributes to the current literature on MOT in three aspects.
1. Propose a novel cross-modal attention module to explicitly embed interaction be-tween different modalities in feature fusion process;
2. Yield more robust tracking performance by associating object proposals from mul-tiple single-modal detectors;
3. Conduct experiments to compare with published benchmarks, proving the value and potential of our proposed framework.
2
Related work
2.1 Multi-object TrackingAs we stated above, tracking often relies on detection. This type of tracking method is known as the tracking-by-detection paradigm [5]. It takes object proposals from out-of-shell detectors as the input, and then associates the proposals to produce trajectories of each object of interest. The performance of this type of tracker, hence, is highly associated with the quality of detection results. In this section, we review seminal works on the tracking-by-detection paradigm.
A tracking-by-detection paradigm breaks down into two steps, feature extraction and data association. Feature extraction usually refers to the procedure of extract-ing features from each object proposal. Data association is correlatextract-ing the features of proposals from different timestamps in order to discover proposals that belong to the same object. Based on proposals of the same object, the trajectory of each object is then generated.
Image based trackers (e.g. [6–8]) extract features from cropped image patches, which are defined by the 2D bounding boxes that the detectors produce. For LiDAR based methods [9, 10], the LiDAR points inside every proposed 3D bounding box also take part in the feature extraction procedure. More recently, a few works [11, 12] have raised the concept of 2D and 3D based multi-modal trackers. Trackers of this kind fuse the features from two modalities using different strategies. For instance, [12] directly concatenates the 2D and 3D features for later use to maintain the information from each modality. In comparison, [11] sums up features from two modalities and inputs them to a self-attention fusion module to generate the final feature. Similar to [11], we adopt an attention mechanism for feature fusion. However, instead of self-attention, we introduce a cross-modal attention module that allows 3D features to help generate attention masks for corresponding 2D features. In this way, our module makes use of the interaction-aware features from multiple modalities.
In addition to the data extraction step, the data association step has also been widely explored. Many strategies are almost equally popular as of today, including Hungarian assignments [13], particle filtering [14], and min-cost flow [15, 16]. More recently, [17] explained a simpler method that exploits the regression head of a de-tector to perform temporal realignment of object bounding boxes, and their method achieved SOTA performance. In this paper, we follow [16] to apply adjacency matrix learning within the min-cost flow framework.
2.2 Cross-modal Attention Mechanism
In this work, we propose a cross-modal attention mechanism that involves 2D im-age and 3D LiDAR information. As the usim-age of multi-modal information becomes increasingly popular, the attention mechanism starts to be used for matching and/or fusing features from different modalities, e.g, 2D image and text, videos and audios. We survey the existing cross-modal attention module designs in this subsection.
Several recent works [18, 19] have introduced attention-based methods to fuse cross-modal information such as depth and color image, and they show promising results in the object detection task. Research to date has tested the adaptivity of these attention mechanisms in fusing 2D and 2.5D domains. Nevertheless, to the best of our knowledge, few works have explored cross-modal attention mechanisms that handle 2D and real 3D (e.g. point cloud) domains.
Besides the works mentioned above, we also notice that the concept of cross-modal attention has become well-liked in the community of image-text matching. For exam-ple, [20–22] propose several solutions to bridge the gap between different modalities. Among these three papers, [20, 21] divide the image into different regions and then relate each region to the work in a text. Through this method, two-dimensional data is reduced to one-dimensional data which aligns with text modality. By comparison, [22] directly embeds both modalities into one-dimensional features, and then it applies attention mechanism at the feature level.
Apart from image-text matching, research also covers other tasks and different combinations of modalities. [23] comes up with a multi-level self-attention based method capturing the long-range dependencies between linguistic and visual contexts for im-age segmentation; [24] designs a hierarchical attention-based architecture to align au-dio and video information.
Among all works discussed so far, we are especially inspired by [20–22] from the image-text matching community. Thus, we adopt the idea of dimension reduction. We project 3D to 2D, generating a sparse depth map that not only maintains the 3D infor-mation but also naturally correlates to the image by spatial correspondence.
3
Approach
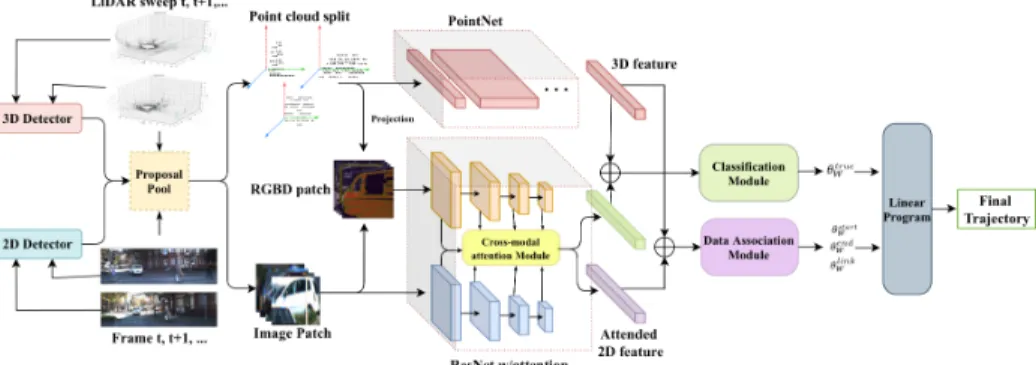
In this paper, we design a deep-learning based Multi-detector, multi-modal track-ing framework. The whole pipeline is shown in Fig.2. The framework follows a tracktrack-ing- tracking-by-detection paradigm. It solves data association as a min-cost flow problem. The goal of this framework is to collaborate the information from multiple sensors and multiple different types of detectors in such a paradigm.
3.1 Pipeline Overview
Following the tracking-by-detection paradigm, our pipeline takes the detector-produced object proposals as the input. Then we extract the 2D image patch and the 3D point cloud split from their respective sensor data based on the localization infor-mation in the proposals. Afterwards, we use PointNet [25] to extract the proposals’ 3D
Fig. 2: Pipeline overview
features from their corresponding point cloud splits and ResNet to extract 2D features from each image patch. The differences between our work and the previous works are (1) we collect object proposals from different types of object detectors; and (2) during 2D feature extraction, the 3D information gets involved to generate an attention mask as the guidance. We explain the details about how we operate these two novel ideas in Sec. 3.2 and Sec. 3.3. After feature extraction, we concatenate 3D features with the attended 2D features to yield the final feature for each proposal. Once all proposals obtain their final features, the classification module re-evaluates each proposal’s score of being an object of interest. This module is especially important because when pro-posals are collected from multiple detectors, the false positive rate would inflate as the number of the total proposals increases. The classification module helps validate the input proposals for a better tracking performance. Besides the classification module, the data association module infers the affinity matrix, the start and end scores in the min-cost flow graph. This partition of the pipeline is similar to the previous work [11, 26, 27]. We skip the module details here and introduce its functionality in Sec. 3.4.
The whole framework is trained in an end-to-end manner using a multi-task loss. We use cross entropy loss for the classification module and the L2 loss for the data association module. The overall loss function is as follows:
L=αLcls+βLds, (1)
whereαandβ are hyper-parameters to balance two losses.αis set to 2 andβ is 1 in our experiments.
3.2 Multi-detector Proposal Collection
In this subsection, we define a proposal pool to collect results from multiple detec-tors, and we provide details about how we fetch corresponding raw data of proposals from multi-modal signals.
Proposal Pool.A proposal poolPis defined as the collection of all object propos-als oft consecutive frames. We run every detector on the sequence of frames one at a time, and we collect the object proposals of each frame in the proposal poolP. In
practice, we lett=2. The proposal pool is denoted asP={p1,p2, ...,pN}, whereNis the size ofPand piis theithproposal inP. We parameterizepiaspi= (xi,yi,wi,hi), wherexi andyirepresent the coordinates of the 2D bounding box’s center whilewi andhirepresent its width and height. Meanwhile, proposals from different detectors may occasionally overlap. To tackle this challenge, we conduct a non-maximum sup-pression procedure to re-organizePto avoid redundant proposals inPduring its later use. In our experiment, we define two proposals as identical when their intersection over union (IoU) is larger than 0.5.
Preparation for Feature extraction.Object proposals in the present study, in the form of 2D bounding boxes inP, enable us to extract 2D modality data from RGB cameras and 3D modality data from LiDAR sensors. For the RGB camera data, we crop their corresponding image patches from each image frame which will be used for the later 2D feature extraction. We use ResNet101 [28] as the backbone in 2D feature extraction.
As for the LiDAR data, since we use mixed types of detectors, the detector output does not necessarily contain the 3D bounding box information of a proposal. With-out 3D bounding boxes, we would be unable to extract the precise point cloud split of each proposal. In response to this challenge, [29] makes a valuable attempt where they predict 3D bounding boxes according to 2D bounding boxes. However, we decide not to incorporate their system into our existing pipeline in consideration of optimal efficiency. In lieu of 3D bounding boxes, we use frustums projected from 2D bounding boxes, as inspired by [11]. [11] shows that the point cloud split in frustums can have comparable performance to that cropped from 3D bounding boxes in tracking tasks. In our framework, we project frustums from 2D bounding boxes with the help of cali-bration information. We use frustums to fetch the corresponding 3D point cloud split from LiDAR data of each proposal for later 3D feature extraction. After we fetch the point cloud split, we use PointNet [25] for 3D point cloud feature extraction.
3.3 Cross-modal Attention Module
In this work, we propose a cross-modal attention module where 3D features inter-act with 2D features to guide the refinement of the latter.
Motivation.The attention mechanism [30] helps machine learning procedures to focus on certain aspects of data specific to a given task context. In a tracking task, attention should aim at the most discriminative sub-regions. If the attention mech-anism can successfully tell the system ”where to look at”, the system can overcome the distraction from irrelevant information that is especially cumbersome to handle in 2D tracking application. Without extra information, however, it is not straightforward for 2D features to figure out a solution by themselves to distinguish objects of interest from noises, despite some attempts of a self-attention design such as [31]. Hence, we consider using 3D features to help guide the generation of attended 2D features.
Challenge and Solution.There is a dimensional gap between 3D and 2D infor-mation. In previous works that have explored the cross-modal attention module design [20, 22], when the feature dimensions are different for different modalities, researchers usually choose to reduce the dimension of the higher-dimensional modality to make the cross-modal interaction more natural. Inspired by [20, 22], we consider to reduce
the dimension of LiDAR information to sparse depth maps by projecting 3D point cloud to 2D. Given a point cloud pointv, the transformation matrix between LiDAR device and the cameraTcam, the rotation matrixRand the translationT of the cam-era as well as the corresponding 2D image coordinates with the depth valueocan be calculated as:
o=T RTcamvT (2)
In this way, we are able to transform a point cloud split to a 2D sparse depth map. To suppress the negative impact from this sparsity, we perform the following two steps. First, we assign the neighbors of every projected pointothe same depth value as o. The neighboring area is defined as aσkernel centering aroundo. We chooseσ=10 pixel width in this work. Second, we concatenate the projected sparse depth map with its corresponding RGB image patch. In practice, we extract the proposal’s point cloud split using generated frustum for all proposals regardless of their sources being 2D or 3D detectors. Fig.3 shows several example pairs of image patch and its corresponding masked version, where the yellow mask signals that depth values is available in that area. The figure also shows that the areas with depth values are highly correlated with the exact location of the object of interests in the image patch.
Fig. 3: Samples of image patch with its corresponding projected point cloud. One yellow small patch in the second row represents a projected 3D point and its neighbors.
Implementation.We denote the input image patch of proposaliasIiand the cor-responding RGB with sparse depth patch asDi. We adopt ResNet [28] as the backbone for our feature extractors and add cross-model attention heads after every pooling op-eration. In our experiment, we use different feature extractors forIi andDito avoid the extracted features getting too similar so that it will not hurt the performance of the attention heads. We denote the extracted feature at scalelas fIl and fDl respectively. The attention operation is expressed as:
Attl(fIl) =so f tmax(Q(fDl)K(fDl)T)V(fIl), (3) whereQ,K, andVare implemented as linear projection. The visual demonstration is Fig.4. We concatenate the attended featureAttl(fIl)at all scales and use the concate-nated features in the classification and data association module. However, we posit that
the attention of the input features should be different for different tasks. To confirm our hunch, we conduct ablation studies to see if by generating task-aware attended features, we can improve the module’s final performance. Please see details in Sec. 4.4.
Fig. 4: Cross-modal attention head visual demonstration
3.4 Linear programming formulation
Based on the detection results from two consecutive framestandt+1, we obtain
a set of object proposalsP={p1,p2, ...,pN}. We follow the model formulation that [16] proposes to introduce four types of binary variables: for eachpj,xtruej indicates if proposalpj is a true positive;xstartj andxendj encode if pjis the start node or the end node of the link;xlinkj
,k represents if there is a link between
pjandpk. In our pipeline,xtrue
j is relatively more important among these four binary vari-ables, as well as more important in our study than in previous works wherextruej only functions as a validation for the detection results. This is because previous works are based on a single detector; hence,xtruej in previous works acts similarly to each pro-posal’s classification score that is already decided by the detector. Without drawing upon additional information, there is limited room for single-detector based tracking frameworks to correct the decisions made by the detector. In our pipeline, in com-parison, the proposals are from different detectors of different data modalities. This setting adds a large amount of extra information to the classification module. A multi-detector and multi-modality approach is especially promising if we consider this: cases that a single-modality detector finds confusing may not be as confusing for another single-modality detector. When information from different detectors and modalities are jointly used for classification, we are able to optimize task performance.
We obtainxtrue
j through the classification module. Other threes variables are esti-mated by data association module. For notation convenience, the four variables for-mulate a vectorx= (xtrue
,x start
,x
tracking problem as a linear program: maximize x ΘW(P)x subject to Ax≤0 ,x∈ {0,1} |x| (4)
In the above equation,ΘW(P)is the cost of assigning each random variables and Ax=0is the constraints of the assignment. The constraints here can be described in
natural languages as: (1) a proposal cannot be linked to a detection belonging to the same frame; and (2) if a proposal is a true positive, it has to be either linked to another detection in the previous frame or the start of a new trajectory.
4
Experiment
4.1 DatasetWe conducted experiments on the KITTI tracking benchmark [32] which consists of 21 training sequences and 29 test sequences. In our experiments, we further split the 21 training sequences into 10 and 11 sequences, respectively for the purposes of train-ing and validation followtrain-ing the setttrain-ing of [11]. The traintrain-ing set has 3,975 total frames and the validation set 3,945 frames. KITTI contains data collected by both 2D and 3D sensors and sensor calibration information. Hence, we were able to crop correspond-ing multi-modal data for each proposal given its boundcorrespond-ing box location. Followcorrespond-ing the KITTI benchmark setting, we computed the Intersection over Union (IoU) between ev-ery output proposal and the entire ground truth bounding boxes. In occasions where a proposal identifies a ground truth bounding box as having yielded the largest IoU among all and where the IoU is greater than 0.5, we assigned the GT box ID to this proposal. We used the same IoU threshold of 0.5 during non-maximum suppression when we re-organized the proposal pool.
4.2 Metrics
Besides the precision and recall that evaluate the detection results, we evaluated our tracking performance using tracking metrics CLEARMOT, MTPTML, identity swit-ches, and fragmentations following the KITTI benchmark [33, 34]. The metrics are ex-plained as below.
MOTA:The Multiple Object Tracking AccuracyMOTA=1−Σtmt−fpt+mmt
Σtgt , where
mt, fpt, andmmt are respectively the number of misses, of false positives, and of
mismatches for timet.
MOTP:MOTP is the total position error for matched object hypothesis pairs over all frames, averaged by the total number of matches made. It shows the abil-ity of the tracker to estimate precise object positions, independent of its skills at recognizing object configurations, keeping consistent trajectories, etc.
MT:Mostly tracked. Percentage of GT trajectories which are covered by tracker output for more than 80% in length.
ML:Mostly lost. Percentage of GT trajectories which are covered by tracker out-put for less than 20% in length. The smaller the value the better.
Fragments:The total number of times that a ground truth trajectory is inter-rupted in the tracking result. The smaller the value the better.
ID switches:The total number of times that a tracked trajectory changes its matched GT identity. The smaller the value the better.
4.3 Implementation detail
We used two detectors in our experiments: the 3D detector PointPillar [3] and the 2D detector RRC [35]. Please see Table 1 for the performance of the two detectors. We trained the whole pipeline in an end-to-end manner. As stated in Sec. 3.2, we used PointNet [25] as the backbone of our 3D feature extractor and ResNet101 [28] with batch normalization as the backbone of the 2D feature extractor. The input image patch was resized to112×112. The classification module was implemented as a three-layer
MLP (i.e. Multi-layer Perceptron). We adapted the architecture of the data association module from [11]. We used Adam optimizer with the learning rate of 3e-4.
Table 1: Statistics of detection results on KITTI validation subset. This table demon-strates the statics of detector performance for both the 2D [35] and 3D [3] detectors on our KITTI validation dataset. The third row lists statistics about the overlapped output proposals between the two detectors. The fourth row shows the statics of combined detection results from both detectors after the non-maximum suppression step.
Detector Type Proposal number True Positive False Positive
2D 12090 11528 562 3D 12642 10788 1854 Overlapped 10533 10308 225 Combination 14199 12008 2191 Ground Truth 12363 - -4.4 Ablation Study
Cross-modal Attention Module.The first of the two ablation studies was on our cross-modal attention module. We stacked the sparse depth map with RGB image patch for attention mask generation. This treatment, as introduced in Sec. 3.3, was to overcome the inefficient feature extraction resulting from the depth sparsity. To es-tablish the value of the stacked RGB-D input in the attention module, we designed an experiment to compare the tracking performance of three attention modules: one using the stacked RGB-D input, the second using pure RGB images, and the third using pure sparse depth maps. In addition, we had all three attention modules to com-pare performance with another architecture without any attention module. Table 4 demonstrated the evaluation results in comparisons. It indicated that our cross-modal
Table 2: Ablation study on attention type.
MOTA MOTP Recall Precision FP Rate W/o attention 83.03% 85.75% 94.76% 92.11% 26.04% W/ Depth attention 82.70% 84.56% 94.75% 91.88% 31.25% W/ RGB attention 83.76% 84.53% 94.68% 92.91% 26.98% Cross-modal attention 84.20% 85.43% 93.53% 93.74% 19.87%
attention module (the last line on Table 4) had the best performance among all four settings.
Task-specific Attention Module. As Sec. 3.3 mentioned, different tasks may have different requirements on the attended features. Therefore, we designed a sec-ond ablation study to compare three solutions: (1) a solution without any attention modules, (2) a solution with the association attention module only, and (3) a solution with both the association attention module and the classification attention module. A comparison between (1) and (2) revealed a performance boosting due to an attention module. A comparison between (2) and (3) further proved the value of using classifi-cation attention module in conjunction with an association attention module. Please see table 3 for specific statistics of performance evaluation.
Fig. 5 and Fig. 6 visualized the attention masks generated respectively for data association and classification.
Table 3: The ablation study 2 on using or not using task specific attention module for classification and association.
Association Att Cls Att MOTA MOTP Recall Precision FP Rate
× × 83.03% 85.75% 94.76% 92.11% 26.04%
X × 84.09% 85.33% 94.39% 93.04% 22.61%
X X 84.20% 85.43% 93.53% 93.74% 19.87%
Fig. 5: Attention mask generated for data association module. The left four and the right four pictures respectively represent two different objects in different timestamps.
Fig. 6: Attention mask generated for the classification module.
4.5 Analysis on Multiple Detectors Performance
As Sec. 3.4 discussed, the classification module would be more important and more challenging in our multi-detector system than in prior single-detector tracking sys-tems since we have more false positive proposals in our proposal pool. To prove our hypothesis and the strength of our framework in overcoming this challenge, we de-signed another set of experiments.
First of all, we compared the performance of several detectors on the dataset de-scribed in Sec. 4.1. We argue that the recall of a detector is the most important metric to consider when we evaluate a detector used in a tracking task. A higher recall indi-cates more true positive proposals. Since a tracking-by-detection framework cannot produce additional positive proposals by itself - in addition to those provided by the detector, the number of true positive proposals that the detector provides may be re-garded as the upper bound of what a tracking-by-detection system can achieve. The first three rows of Table 4 show that regarding the KITTI dataset, the 2D detector we used in the experiment performed better than the 3D detector judging their recalls, but the combined use of 2D and 3D detectors outperformed the 2D detector alone, yielding a recall about 4% higher than that of the 2D detector. We thus proved the superiority of a multiple-detector solution over single-detector solutions in incurring input of better quality for a tracking-by-detection system.
Secondly, the second three rows of Table 4 showed the results of the multi-modal tracking method [11], which is reproduced by using its official code and data. For comparison convenience, we replaced the original VGG-16 encoder by ResNet101 and adjusted the image patch to112×112. The results demonstrated that when using a
single detector, [11] was able to control the false positive rate while for a multiple detector setting, the false positive rate became much larger than the raw detection re-sults. Namely, the classification module had problems in distinguishing true positives and false positives with too many distractions in a multiple detector setting.
A comparison between the second three rows and the last three rows of Table 4 demonstrated contribution of our framework. Our pipeline not only improved the performance of a multi-detector based tracking system but also single-detector based
tracking systems with 2D or 3D detectors alone. This finding was supported by the higher MOTA statistics and lower false positive rates of our framework compared to [11]. Specially, in the multi-detector setting, our framework had a false positive rate that was 24% lower than that from [11]. This proved the ability of our proposed framework in successfully suppressing the false positive rate in tracking-by-detection systems even when the inputs come from multiple detectors.
Table 4: Results of experiments using different types of detectors.
Detector type Model Type MOTA MOTP Recall Precision FP Rate FP Number
2D - - - 93.24% 95.35% 4.64% 562 3D - - - 87.26% 85.33% 14.66% 1854 Multi-Detector - - - 97.12% 84.56% 15.43% 2191 2D [11] 89.49% 85.85% 92.84% 98.09% 6.94% 222 3D [11] 75.90% 85.29% 85.06% 93.12% 19.67% 791 Multi-Detector [11] 83.03% 85.75% 94.76% 92.11% 26.04% 1007 2D Ours 89.66% 85.83% 93.05% 98.07% 5.59% 211 3D Ours 76.31% 85.20% 85.31% 93.63% 18.25% 734 Multi-Detector Ours 84.20% 85.43% 93.53% 93.74% 19.87% 799 4.6 Benchmark Evaluation
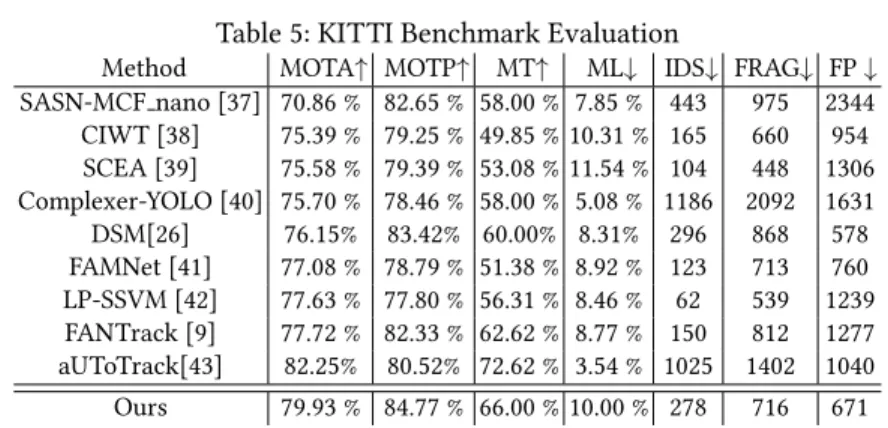
Lastly, we evaluated our framework on the KITTI tracking benchmark test split [36]. The authors of KITTI did not reveal their ground truth. We submitted to the benchmark our results on test split that were generated by the last model in our ab-lation study (see the last three columns of Table 3 for the model). The model used pure 2D detection results. We then compared our results to the other methods on the leader board. Without any fine-tuning, our model demonstrated promising results among the state-of-the-art methods in the benchmark. Table 5 listed our evaluation results in comparison with other methods on the KITTI tracking benchmark.
5
Conclusion
In this paper, we propose a tracking-by-detection pipeline that uses multiple de-tectors and multiple sensors. Our pipeline successfully associates the proposals from different detectors and thereafter offers the tracking task a better starting point with more true positive proposals. To the best of our knowledge, our work is the first one that attempts to explore the potentials of a multi-detector setting in a tracking-by-detection system.
In the meantime, we propose a novel cross-modal attention module. It leverages the interaction between 3D features and 2D features to help extract 2D features with fewer distractions. The attended features, consequentially, help the classification module to suppress the high false positive rate brought by the multi-detector setting. With fewer
Table 5: KITTI Benchmark Evaluation
Method MOTA↑ MOTP↑ MT↑ ML↓ IDS↓ FRAG↓ FP↓
SASN-MCF nano [37] 70.86 % 82.65 % 58.00 % 7.85 % 443 975 2344 CIWT [38] 75.39 % 79.25 % 49.85 % 10.31 % 165 660 954 SCEA [39] 75.58 % 79.39 % 53.08 % 11.54 % 104 448 1306 Complexer-YOLO [40] 75.70 % 78.46 % 58.00 % 5.08 % 1186 2092 1631 DSM[26] 76.15% 83.42% 60.00% 8.31% 296 868 578 FAMNet [41] 77.08 % 78.79 % 51.38 % 8.92 % 123 713 760 LP-SSVM [42] 77.63 % 77.80 % 56.31 % 8.46 % 62 539 1239 FANTrack [9] 77.72 % 82.33 % 62.62 % 8.77 % 150 812 1277 aUToTrack[43] 82.25% 80.52% 72.62 % 3.54 % 1025 1402 1040 Ours 79.93 % 84.77 % 66.00 % 10.00 % 278 716 671
distractions, the attended features are also more discriminative to better serve the data association module and to boost the performance of the framework.
The evaluation of our framework on the public benchmark proves the value and potential of our ideas as presented in the current study. Admittedly, though, there is still room for improvement regarding multi-detector settings (see Table 4 in the earlier passage). In future research, we will explore the possibilities of completing the sparse depth map generated by the LiDAR sensor to make the interaction between 2D and 3D features more natural.
References
1. Yoo, J.H., Kim, Y., Kim, J.S., Choi, J.W.: 3d-cvf: Generating joint camera and lidar features using cross-view spatial feature fusion for 3d object detection (2020)
2. Liang, M., Yang, B., Chen, Y., Hu, R., Urtasun, R.: Multi-task multi-sensor fusion for 3d object detection. In: Proceedings of the IEEE Conference on Computer Vision and Pattern Recognition. (2019) 7345–7353
3. Lang, A.H., Vora, S., Caesar, H., Zhou, L., Yang, J., Beijbom, O.: Pointpillars: Fast encoders for object detection from point clouds. In: Proceedings of the IEEE Conference on Computer Vision and Pattern Recognition. (2019) 12697–12705
4. Shi, S., Guo, C., Jiang, L., Wang, Z., Shi, J., Wang, X., Li, H.: Pv-rcnn: Point-voxel feature set abstraction for 3d object detection. In: Proceedings of the IEEE/CVF Conference on Computer Vision and Pattern Recognition. (2020) 10529–10538
5. Yilmaz, A., Javed, O., Shah, M.: Object tracking: A survey. Acm computing surveys (CSUR)
38(2006) 13–es
6. Voigtlaender, P., Krause, M., Osep, A., Luiten, J., Sekar, B.B.G., Geiger, A., Leibe, B.: Mots: Multi-object tracking and segmentation. In: The IEEE Conference on Computer Vision and Pattern Recognition (CVPR). (2019)
7. Chu, Q., Ouyang, W., Liu, B., Zhu, F., Yu, N.: Dasot: A unified framework integrating data association and single object tracking for online multi-object tracking. In: AAAI. (2020) 10672–10679
8. Xu, J., Cao, Y., Zhang, Z., Hu, H.: Spatial-temporal relation networks for multi-object track-ing. In: Proceedings of the IEEE International Conference on Computer Vision. (2019) 3988– 3998
9. Baser, E., Balasubramanian, V., Bhattacharyya, P., Czarnecki, K.: Fantrack: 3d multi-object tracking with feature association network. ArXivabs/1905.02843(2019)
10. Weng, X., Kitani, K.: A baseline for 3d multi-object tracking (2019)
11. Zhang, W., Zhou, H., Sun, S., Wang, Z., Shi, J., Loy, C.C.: Robust multi-modality multi-object tracking. In: Proceedings of the IEEE International Conference on Computer Vision. (2019) 2365–2374
12. Weng, X., Wang, Y., Man, Y., Kitani, K.: Gnn3dmot: Graph neural network for 3d multi-object tracking with multi-feature learning (2020)
13. Kuhn, H.W.: The hungarian method for the assignment problem. Naval research logistics quarterly2(1955) 83–97
14. Ristic, B., Arulampalam, S., Gordon, N.: Beyond the Kalman filter: Particle filters for tracking applications. Volume 685. Artech house Boston (2004)
15. Zhang, L., Li, Y., Nevatia, R.: Global data association for multi-object tracking using network flows. In: 2008 IEEE Conference on Computer Vision and Pattern Recognition, IEEE (2008) 1–8
16. Frossard, D., Urtasun, R.: End-to-end learning of multi-sensor 3d tracking by detection. In: 2018 IEEE International Conference on Robotics and Automation (ICRA), IEEE (2018) 635–642
17. Bergmann, P., Meinhardt, T., Leal-Taixe, L.: Tracking without bells and whistles. In: Pro-ceedings of the IEEE international conference on computer vision. (2019) 941–951 18. Li, G., Gan, Y., Wu, H., Xiao, N., Lin, L.: Cross-modal attentional context learning for rgb-d
object detection. IEEE Transactions on Image Processing28(2018) 1591–1601
19. Chen, H., Li, Y.F., Su, D.: Attention-aware cross-modal cross-level fusion network for rgb-d salient object detection. In: 2018 IEEE/RSJ International Conference on Intelligent Robots and Systems (IROS), IEEE (2018) 6821–6826
20. Lee, K.H., Chen, X., Hua, G., Hu, H., He, X.: Stacked cross attention for image-text matching. Lecture Notes in Computer Science (2018) 212ˆa228
21. Huang, Y., Wang, W., Wang, L.: Instance-aware image and sentence matching with selec-tive multimodal lstm. 2017 IEEE Conference on Computer Vision and Pattern Recognition (CVPR) (2017)
22. Nam, H., Ha, J.W., Kim, J.: Dual attention networks for multimodal reasoning and matching. In: Proceedings of the IEEE Conference on Computer Vision and Pattern Recognition. (2017) 299–307
23. Ye, L., Rochan, M., Liu, Z., Wang, Y.: Cross-modal self-attention network for referring image segmentation. In: Proceedings of the IEEE Conference on Computer Vision and Pattern Recognition. (2019) 10502–10511
24. Wang, X., Wang, Y.F., Wang, W.Y.: Watch, listen, and describe: Globally and locally aligned cross-modal attentions for video captioning. arXiv preprint arXiv:1804.05448 (2018) 25. Qi, C.R., Su, H., Mo, K., Guibas, L.J.: Pointnet: Deep learning on point sets for 3d classification
and segmentation. In: Proceedings of the IEEE conference on computer vision and pattern recognition. (2017) 652–660
26. Frossard, D., Urtasun, R.: End-to-end learning of multi-sensor 3d tracking by detection. In: ICRA, IEEE (2018)
27. Schulter, S., Vernaza, P., Choi, W., Chandraker, M.: Deep network flow for multi-object tracking. In: Proceedings of the IEEE Conference on Computer Vision and Pattern Recog-nition. (2017) 6951–6960
28. He, K., Zhang, X., Ren, S., Sun, J.: Deep residual learning for image recognition. In: Proceed-ings of the IEEE conference on computer vision and pattern recognition. (2016) 770–778 29. Qi, C.R., Liu, W., Wu, C., Su, H., Guibas, L.J.: Frustum pointnets for 3d object detection
from rgb-d data. In: Proceedings of the IEEE Conference on Computer Vision and Pattern Recognition. (2018) 918–927
30. Vaswani, A., Shazeer, N., Parmar, N., Uszkoreit, J., Jones, L., Gomez, A.N., Kaiser, L., Polo-sukhin, I.: Attention is all you need (2017)
31. Guan, Q., Huang, Y., Zhong, Z., Zheng, Z., Zheng, L., Yang, Y.: Diagnose like a radiologist: Attention guided convolutional neural network for thorax disease classification (2018) 32. Geiger, A., Lenz, P., Urtasun, R.: Are we ready for autonomous driving? the kitti vision
benchmark suite. In: 2012 IEEE Conference on Computer Vision and Pattern Recognition, IEEE (2012) 3354–3361
33. Li, Y., Huang, C., Nevatia, R.: Learning to associate: Hybridboosted multi-target tracker for crowded scene. In: 2009 IEEE Conference on Computer Vision and Pattern Recognition, IEEE (2009) 2953–2960
34. Bernardin, K., Stiefelhagen, R.: Evaluating multiple object tracking performance: the clear mot metrics. EURASIP Journal on Image and Video Processing2008(2008) 1–10
35. Ren, J., Chen, X., Liu, J., Sun, W., Pang, J., Yan, Q., Tai, Y.W., Xu, L.: Accurate single stage detector using recurrent rolling convolution. 2017 IEEE Conference on Computer Vision and Pattern Recognition (CVPR) (2017)
36. Geiger, A., Lenz, P., Urtasun, R.: Are we ready for autonomous driving? the kitti vision benchmark suite. In: Conference on Computer Vision and Pattern Recognition (CVPR). (2012)
37. Gunduz, G., Acarman, T.: Efficient multi-object tracking by strong associations on temporal window. IEEE Transactions on Intelligent Vehicles (2019)
38. Osep, A., Mehner, W., Mathias, M., Leibe, B.: Combined image- and world-space tracking in traffic scenes. In: ICRA. (2017)
39. Yoon, J.H., Lee, C.R., Yang, M.H., Yoon, K.J.: Online multi-object tracking via structural constraint event aggregation. In: IEEE International Conference on Computer Vision and Pattern Recognition (CVPR). (2016)
40. Simon, M., Amende, K., Kraus, A., Honer, J., Samann, T., Kaulbersch, H., Milz, S., Michael Gross, H.: Complexer-yolo: Real-time 3d object detection and tracking on semantic point clouds. In: The IEEE Conference on Computer Vision and Pattern Recognition (CVPR) Workshops. (2019)
41. Chu, P., Ling, H.: Famnet: Joint learning of feature, affinity and multi-dimensional assign-ment for online multiple object tracking. In: ICCV. (2019)
42. Wang, S., Fowlkes, C.: Learning optimal parameters for multi-target tracking with contex-tual interactions. International Journal of Computer Vision (2016)
43. Burnett, K., Samavi, S., Waslander, S., Barfoot, T., Schoellig, A.: autotrack: A lightweight object detection and tracking system for the sae autodrive challenge. 2019 16th Conference on Computer and Robot Vision (CRV) (2019)


![Table 1: Statistics of detection results on KITTI validation subset. This table demon- demon-strates the statics of detector performance for both the 2D [35] and 3D [3] detectors on our KITTI validation dataset](https://thumb-us.123doks.com/thumbv2/123dok_us/9544833.2830700/10.918.211.710.601.726/statistics-detection-results-validation-detector-performance-detectors-validation.webp)