QUICK SCAN
CONTENTS:
3
SITUATION OF THE POLISH DAIRY SECTOR
12
STRUCTURE OF THE POLISH DAIRY SECTOR
15
SITUATION OF DAIRY INDUSTRY IN POLAND
16
THE LARGEST DAIRY COMPANIES IN POLAND
19
SWOT ANALYSIS OF POLISH DAIRY INDUSTRY
GENERAL PRESENTATION
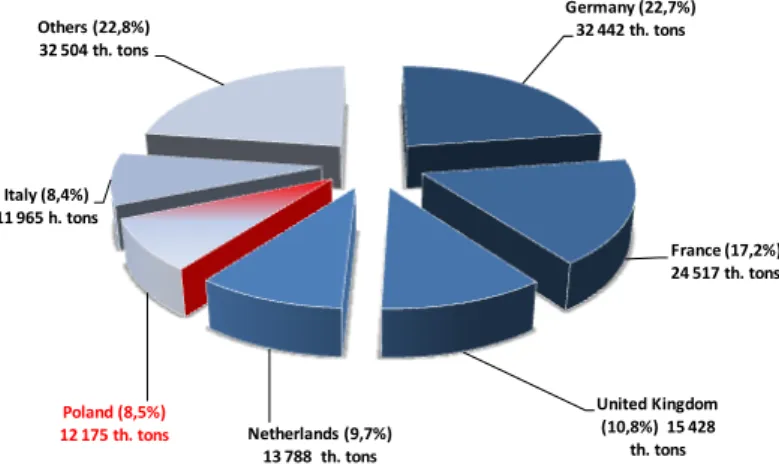
Poland is the 5th largest dairy producer and has the 3rd largest dairy cow herd size in the European Union. In 2019 milk output in Poland expanded by 2.3% compared to 2018 and amounted to 14.5 million tons, while milk deliveries to the dairy industry reached 12.2 million tons, an increase of almost 2% compared to 2018. In 2019 Poland was responsible for 1.7% of global milk production and 8.5% of total EU-28 milk deliveries.
FIGURE 1: Milk supplies EU-28 in 2019 (thousand tons) Germany (22,7%) 32 442 th. tons France (17,2%) 24 517 th. tons United Kingdom (10,8%) 15 428 th. tons Netherlands (9,7%) 13 788 th. tons Poland (8,5%) 12 175 th. tons Italy (8,4%) 11 965 h. tons Others (22,8%) 32 504 th. tons
Source: Based on Eurostat data
The Polish dairy industry underwent a transformation after the accession of Poland to the EU (2004). The production of milk and dairy products became concentrated, which translated into economies of scale.
Purchasing of milk in Poland after 2004 increased by 3 billion liters, i.e. by 30%, and the average growth rate of milk deliveries in Poland at that time was two times faster than that observed in the EU.
The increase in purchasing of milk resulted from the higher demand for raw material from the developing processing industry. In the years 2005-2019, the revenues of companies involved in milk processing rose by more than 90%.
FIGURE 2: Indicators of change in milk production and processing 2004-2019 (%) 28,43% 34,67% 74,70% 131,82% 155,45% 157,73% 194,77% 0,00% 50,00% 100,00% 150,00% 200,00%
Number of dairy farms Number of dairies Number of milk cows Milk production Milk yield Milk procurement Income from sales
Source: Based on unpublished Central Statistic Office (CSO) data Polish dairy exports have increased almost fourfold since Poland’s EU accession.
Poland is a giant in the world cheese market. Only the United States, Germany, France, the Netherlands and Italy make more cheese. Polish dairy products are sold mainly to EU countries. However, due to growing demand for dairy products in Asia, the Middle East and Africa, Poland has recently substantially increased its exports of milk powder to Algeria and whey to China, Indonesia and Malaysia and exports of Polish cheese to Ukraine. In 2018, compared to 2017, Poland doubled export of
packed milk to China and confirmed its main position
among the players for this product.
SITUATION OF THE POLISH
DAIRY SECTOR
MILK PRODUCTION IN POLAND
TABLE 1: Total milk production in Poland and the Netherlands
Total milk production Poland The Netherlands
2019 14.5 million tons or14.1 billion liter 15.1 million tons or14.6 billion liter
Source: Based on the CSO and Eurostat data
In 2019 an upward trend in the production of milk was observed in Poland due to increased milk yield which compensated the decreased population od dairy cows. In December 2019, the total number of dairy cows was 2 164 thousand head and was 2.3% lower than the year before. The progressive concentration and modernization
of the production of milk on large farms compensated for smaller resources and worse quality of livestock feed. As a result, the average milk yield of dairy cows increased by 2.3% to 6 402 l/head and the production of raw milk increased also by 2.3% to 14.1 billion liters (14.5 million tons).
TABLE 2: Milk balance in thousand tons1
Specification 2014 2015 2016 2017 2018 2019
Total production 13003 13262 13271 13790 14215 14500
including cow milk 12986 13236 13244 13721 14170 14485
Import a) 1737 1630 1825 1820 1910 1900 Available in total 14740 14892 15096 15610 16125 16400 Eksport a) 4032 4035 3880 4210 4650 4595 For feed 594 566 515 565 630 720 For consumption 10114 10291 10701 10835 10845 11085 Total expenditure 14740 14892 15096 15610 16125 16400 Self-sufficiency b) (%) 121,4 122,2 118,3 121 123,9 122,8
a) Export and import volume has been calculated using the coefficients of dry weight content b) Calculated as the total production to internal consumption ratio (consumption plus consumption of feed) Source: Processed by Institute of Agricultural and Food Economics (IAFE) based on CSO and Ministry of Finance (MF) data
MILK DELIVERIES, PRICES AND PRODUCTION OF MILK PRODUCTS
In 2019, deliveries of raw milk to the dairy industry increased by 1.9% to 12 175 thousand tons and accounted for 84.1% of the total milk production.
The relatively good economic situation in the international market and the growing domestic demand resulted
in the slight rise in the milk procurement prices. In 2019 the average price paid to Polish farmers for milk grew by 0.5% to 135 PLN/100 liters (31.48 EUR/100 liters) compared to 2018.
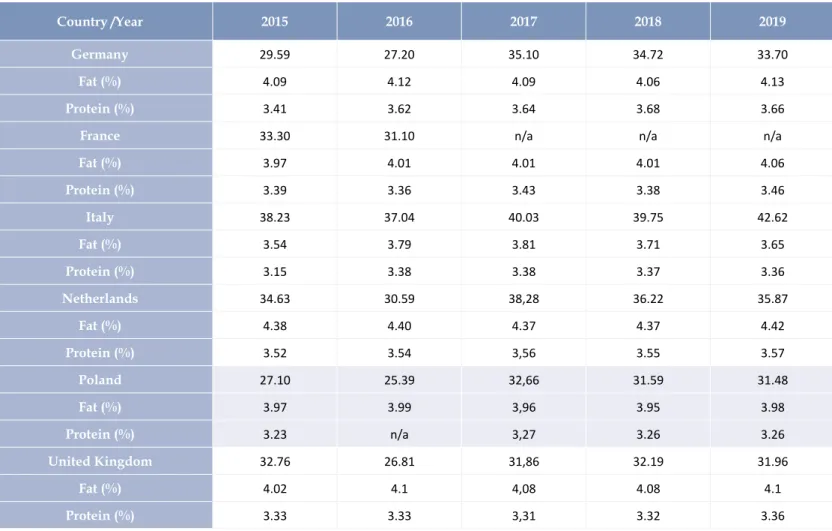
TABLE 3. Average raw cows’ milk actual price in EUR per 100 kg; fat and protein content in % of product weight
Country /Year 2015 2016 2017 2018 2019
Germany 29.59 27.20 35.10 34.72 33.70
Fat (%) 4.09 4.12 4.09 4.06 4.13
Protein (%) 3.41 3.62 3.64 3.68 3.66
France 33.30 31.10 n/a n/a n/a
Fat (%) 3.97 4.01 4.01 4.01 4.06 Protein (%) 3.39 3.36 3.43 3.38 3.46 Italy 38.23 37.04 40.03 39.75 42.62 Fat (%) 3.54 3.79 3.81 3.71 3.65 Protein (%) 3.15 3.38 3.38 3.37 3.36 Netherlands 34.63 30.59 38,28 36.22 35.87 Fat (%) 4.38 4.40 4.37 4.37 4.42 Protein (%) 3.52 3.54 3,56 3.55 3.57 Poland 27.10 25.39 32,66 31.59 31.48 Fat (%) 3.97 3.99 3,96 3.95 3.98 Protein (%) 3.23 n/a 3,27 3.26 3.26 United Kingdom 32.76 26.81 31,86 32.19 31.96 Fat (%) 4.02 4.1 4,08 4.08 4.1 Protein (%) 3.33 3.33 3,31 3.32 3.36
Source: Based on Eurostat data
Increased raw milk supplies to the dairy sector and relatively high trading prices were the main causes for the growth in production of dairy products in 2019.
According to Eurostat and Central Statistic Office (CSO),
the production of most products grew, with the exception of skimmed milk powder, processed cheese, as well as whey powder.
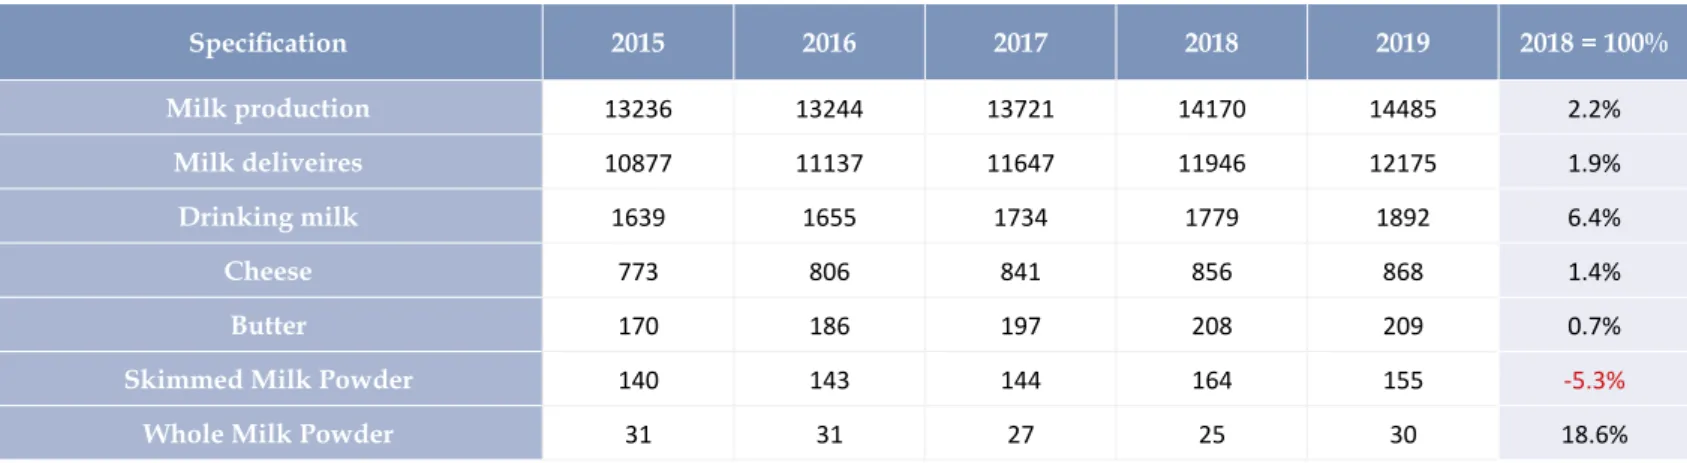
In 2019 the production of liquid milk, which includes drinking milk and milk for further processing (spot milk), increased by 2.2% to 3,529.5 thousand tons. According to Eurostat information, production of drinking milk amounted to 1,892.1 thousand tons by 6.4% more than last year.
One of the reasons for that increase was increasing exports of packed drinking milk, especially to China. The production of condensed milk and cream decreased by 7.5% due to the growing demand for milk fat for the production of butter, ripening cheese and whole milk powder.
The production of skimmed milk powder decreased by 5.3%, but the production of whole milk powder was 18.6% higher than in the previous year. The production of SMP decreased due to lower export opportunities,
although there has been a significant increase in prices
In 2018-2019, the EU exported respectively 834 and 857 thousand tons of SMP, (including the large amounts from EU intervention stocks). In the same period
significant exports of SMP was noticed also from New
Zealand and the USA, resulting in the saturation of import demand. In addition, in 2019, dairy plants increased
the demand for protein to produce more profitable
dairy products, such as dairy drinks or various types of fresh cheese.
The production of butter in 2019 increased by 8.7%. The increase in butter production was determined by the growing demand on the domestic market. World butter prices fell by almost 23% over the year and contributed
to a significant reduction in domestic prices.
The total production of cheese increased by 1.4% over the last year. The production of processed cheese was lower by 5.6% due to lower demand in the domestic market, which is close to the saturation limits.
The growing production of cheese and curd resulted in higher output of liquid whey, which in 2019 increased by 5.4%. Despite the rising prices of protein products on the world market and the increasing demand for protein products in food processing and feed production, the production of whey powder decreased by 4.2%. This may be the result of an increased demand for concentrated whey, which is a by-product in biogas plants in dairies.
TABLE 4: Production of milk and milk products Poland (thousand ton)
Specification 2015 2016 2017 2018 2019 2018 = 100% Milk production 13236 13244 13721 14170 14485 2.2% Milk deliveires 10877 11137 11647 11946 12175 1.9% Drinking milk 1639 1655 1734 1779 1892 6.4% Cheese 773 806 841 856 868 1.4% Butter 170 186 197 208 209 0.7%
Skimmed Milk Powder 140 143 144 164 155 -5.3%
Whole Milk Powder 31 31 27 25 30 18.6%
POLISH FOREIGN TRADE IN DAIRY PRODUCTS
Raw milk production in Poland exceeds balance consumption by approx. 20% and a large part of it is sold as dairy products on external markets.
FIGURE 3: Polish foreign trade in dairy products in million EUR 0 300 600 900 1200 1500 1800 2100 2400 2700 2006 2007 2008 2009 2010 2011 2012 2013 2014 2015 2016 2017 2018 2019 m ill io n E UR
export import balans
Source: Based on unpublished MF data
In 2019, compared to 2018, there was a deterioration in the results of foreign trade in dairy products. The positive balance of trade, expressed in the raw milk equivalent, decreased by 1.6% to 2 695 thousand tons and in value terms by 3.9% to 1,139.6 million EUR. The export in milk equivalent decreased by 1.2% to 4 595 thousand tons and import by 0,5% to 1.900 thousand tons. In value terms, the export increased by 0.5% to 2,090.8 million EUR and import by 6.3% to 951.1 million EUR. The higher rate of trade in terms of value than volume was a consequence of higher transaction prices.
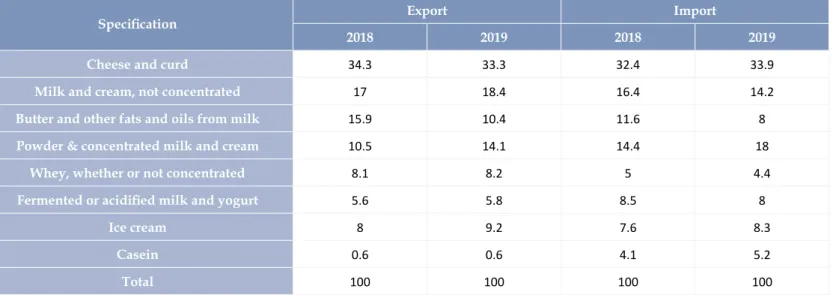
TABLE 5: Polish export and import of selected dairy products – commodity structure in % of value
Specification Export Import
2018 2019 2018 2019
Cheese and curd 34.3 33.3 32.4 33.9
Milk and cream, not concentrated 17 18.4 16.4 14.2
Butter and other fats and oils from milk 15.9 10.4 11.6 8
Powder & concentrated milk and cream 10.5 14.1 14.4 18
Whey, whether or not concentrated 8.1 8.2 5 4.4
Fermented or acidified milk and yogurt 5.6 5.8 8.5 8
Ice cream 8 9.2 7.6 8.3
Casein 0.6 0.6 4.1 5.2
Total 100 100 100 100
Source: Processed by IAFE based on MF data In 2019, the exports of cheese and curd, concentrated
and powdered milk, butter and whey decreased. The exports of the remaining groups of dairy products increased.
The share of final consumer products in the commodity
structure of exports decreased to 58.0%, compared to 61.7% in 2018.
The main export items are cheeses and quarks, liquid milk and cream as well as powdered milk and whey powder also had a large share in the export structure.
TABLE 6: Polish export and import of selected dairy products – geographic structure in % of value
Specification Export Import
2018 2019 2018 2019
EU-15 52 48.1 74 73.9
EU-13 27.1 27.3 22,2 20.8
CIS; Central and Eastern Europe 1.9 2.8 3.1 3.2
Developing countires 16.7 19 0.2 0.1
Other developed countries 2.3 2.8 0.5 2
Total 100 100 100 100
Source: Processed by IAFE based on MF data
There were no significant changes in the geographic
structure of exports, the main markets for sale were the EU countries (74.2%), and the economically developing countries (19.4%).
FIGURE 4: Polish export – destination countries
China 3% Algieria 2% Saudi Arabia 2% CIS 3% Other 16% Germany 21% Czech Republik 8% Italy 5% Netherlands 5% Great Britain 5% Slovakia 4% Rumunia 4% Hungary 4% Lithuania 4% Spain 2% France 2% Bulgaria 2% Other EU 8% EU-28 74%
Source: Based on unpublished MF data
In 2019 the revenues from exports to the EU amounted to 1.7 billion EUR. The main recipients of dairy products were: Germany (21% of the value - 488 million EUR), Czech Republic (8% - 176 million EUR), Italy (5.5% - 125 million EUR), the Netherlands and the United Kingdom (5% each - 113 million EUR and 111 million EUR, respectively) as well as Slovakia, Romania, Hungary and Lithuania (4%). The share of dairy exports to the CIS countries in 2019 it amounted to 2.7%. However, the total value of exported products to this group was almost twice as high as in 2018 and amounted to 62.5 million EUR. The share of non-EU countries (not belonging to the CIS) in the export of dairy products was by 3% higher than the one recorded a year earlier and amounted to 23%. Among these countries, the largest share in exports had: China (3.5% of the export value - 80 million EUR), as well as Algeria and Saudi Arabia (approx. 2% each - 50 million EUR and 48 million EUR respectively).
TABLE 7: Polish export of dairy products
Specification 2017 2018 2019
thousand tons
Milk and cream, not concentrated 662.2 678.5 780
Powder milk and cream 125 165.6 195
Fermented or acidified milk and yogurt 99.3 105.7 110
Whey, whether or not concentrated 218.2 219 200
Butter and other fats and oils from milk 61.2 68.4 60
Cheese and curd 246.4 260.7 260
Ice cream 63.2 74.2 85
Casein 3.9 2.9 2.5
million EUR
Milk and cream, not concentrated 410.8 397.2 425
Powder milk and cream 252.4 261.3 345
Fermented or acidified milk and yogurt 119.6 129.2 130
Whey, whether or not concentrated 217.6 185.8 195
Butter and other fats and oils from milk 285.5 322.4 255
Cheese and curd 747 785.2 790
Ice cream 125.5 152.7 185
Casein 20.9 14.9 14
Source: Based on unpublished MF and IAFE data
The good results in the foreign trade indicates a high competitiveness of Polish dairy products on the international market, mainly on the EU market. Poland ranked fourth among EU countries in the export of whey powder.
TABLE 8: Polish import of dairy products
Specification 2017 2018 2019
thousand tons
Milk and cream, not concentrated 205.8 225.6 205
Powder milk and cream 98.5 102.2 110
Fermented or acidified milk and yogurt 73 74 75
Whey, whether or not concentrated 89.7 97.9 80
Butter and other fats and oils from milk 20.7 20.7 15
Cheese and curd 95.1 94.1 105
Ice cream 22.4 27.3 30
Casein 8.3 9.9 10
million EUR
Milk and cream, not concentrated 162 165.6 155
Powder milk and cream 161.2 150 195
Fermented or acidified milk and yogurt 83.5 82.2 85
Whey, whether or not concentrated 49.2 44.4 50
Butter and other fats and oils from milk 110.6 112.6 75
Cheese and curd 333.5 340.3 365
Ice cream 50.9 60.2 70
Casein 42.6 45.6 50
In 2019 the import of cheese and curd, concentrated and powdered milk, ice cream and casein increased. The drop in the import was observed in butter, liquid milk and cream, yoghurts and dairy drinks and whey. In the commodity structure of imports, the share of
final consumer products decreased to 57.1% compared
to 59.4% in 2018.
Dairy products were mainly imported from the EU countries, the total share of which in the value of exports amounted to 95.7%.
FIGURE 5: Polish import – destination countries
Other 4% Other EU 19% Germany 32% Lithuania 12% Netherlands 11% Czech Republik 6% Italy 5% France 5% Belgia 4% Irlandia 2% EU-28 96%
Source: Based on unpublished MF data
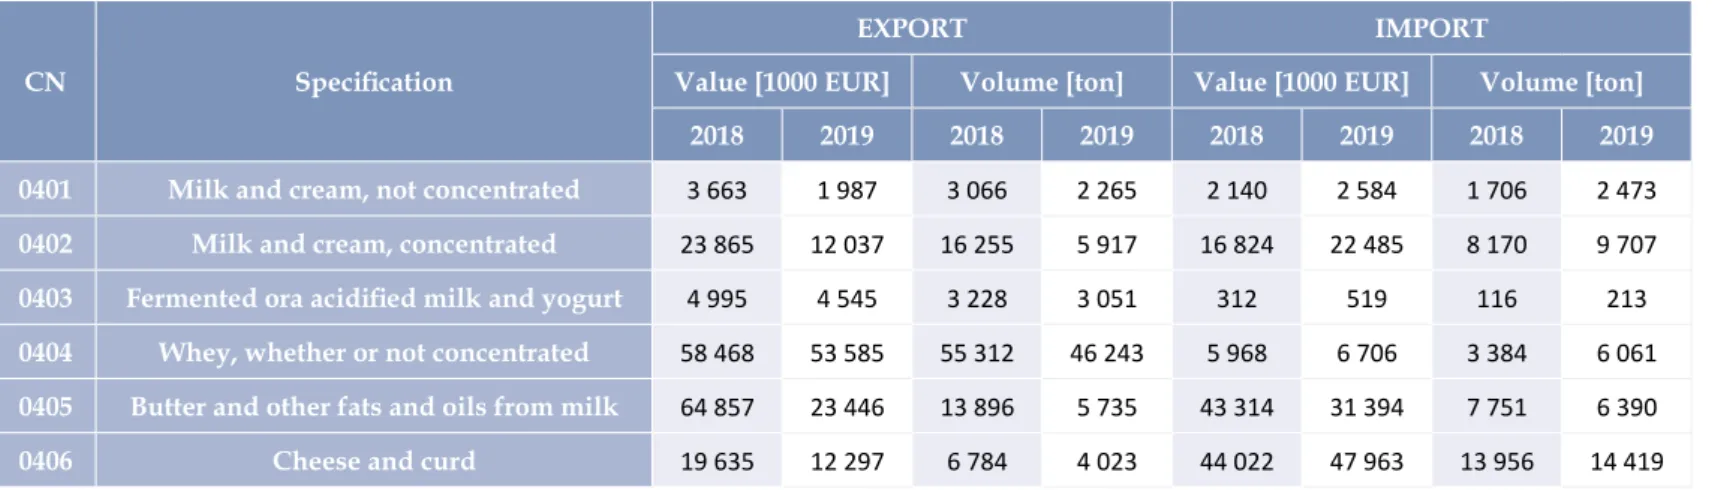
TABLE 9: Polish foreign trade with the Netherlands
CN Specification
EXPORT IMPORT
Value [1000 EUR] Volume [ton] Value [1000 EUR] Volume [ton]
2018 2019 2018 2019 2018 2019 2018 2019
0401 Milk and cream, not concentrated 3 663 1 987 3 066 2 265 2 140 2 584 1 706 2 473
0402 Milk and cream, concentrated 23 865 12 037 16 255 5 917 16 824 22 485 8 170 9 707
0403 Fermented ora acidified milk and yogurt 4 995 4 545 3 228 3 051 312 519 116 213
0404 Whey, whether or not concentrated 58 468 53 585 55 312 46 243 5 968 6 706 3 384 6 061
0405 Butter and other fats and oils from milk 64 857 23 446 13 896 5 735 43 314 31 394 7 751 6 390
0406 Cheese and curd 19 635 12 297 6 784 4 023 44 022 47 963 13 956 14 419
Source: Based on MF data
Polish dairy industry reports a high demand for the raw material, as it has surplus of production capacity in relation to the purchase of milk.
Organic milk had a large share in the import of liquid milk and cream. The production of organic milk in Poland is very limited and does not meet the growing domestic demand for organic milk and organic milk products.
TABLE 10: Main 10 suppliers of Bulk milk (tons) Country 2016 2017 2018 2019 Lithuania 93.431 69.406 79.464 66.448 Czech Republic 31.563 31.040 32.918 36.604 Germany 19.875 23.581 27.255 30.380 Austria 50 2.672 6.455 4.975 Belgium 7.218 4.271 7.094 4.546 Netherlands 379 2.805 1.011 1.374 Slovakia 9.152 5.132 4.311 609 Denmark 236 502 48 264 France 96 123 332 25 Estonia 124 129 54 20
Source: Based on Clal and IHS data
POLISH CONSUMPTION OF DAIRY PRODUCTS
In 2019, an upward trend in consumption of dairy products was consolidated, and this was determined by the improved income situation of households and favorable price trends when compared to substitution food products. The implementation of the milk consumption support program and the shaping of consumer habits in educational institutions also contributed to the increase in consumption.
The retail prices of dairy products (exclusive butter) rose by 1.5%. The average retail price of butter fell by 4.5%. The consumption of dairy products (exclusive of butter) in milk equivalent increased in 2019 by 1.3% to 227 liters per capita in comparison with 2018.
FIGURE 6: Per capita consumption of dairy products in Poland2 196 173 193 206 205 213 222 218 224 227 170 180 190 200 210 220 230 l/p er ca pi ta
Source: Based on CSO data
The consumption of butter increased in 2019 by 4.4% to 4.6. kg per capita due to the reduction of retail butter prices by 4.5% on the domestic market.
FIGURE 7: Per capita consumption of butter in Poland
3,0 3,5 4,0 4,5 5,0 5,5 6,0 6,5 7,0 7,5 8,0 kg /pe r c api ta 4,7 7,8 4,7 4,6 4,6 3,7
AMOUNT AND SIZE OF THE DAIRY FARMS
In 2019, the downward trend of the cow population, was noticed. The total number of cows decreased compared to the end of 2018 by 2.3% to 2,164 thousand. During this time, the number of dairy cows decreased by 0.5% to 2,221 thousand. At the same time,
the number of cows used exclusively for the production of beef increased by 17.7% to 239 thousand head. The decrease in the number of dairy cows was the result of the ongoing restructuring and modernization
processes in farms and difficult production conditions. TABLE 11: Structure of dairy farms according to the number of cows in 2016
Country/No of cows per farm 1_2 3-9 10-19 20-29 30-49 50-99 100 & more farmsTotal
Poland 49760 76290 42810 26600 26950 17060 4100 243 570
Italy 1380 9500 9440 6570 7720 7890 10880 53 380
France 420 1000 1810 1490 3750 15430 40530 64 420
Germany 250 1080 3990 5020 9740 18180 30950 69 190
Netherlands 30 120 150 210 700 3340 13360 17 910
Source: Based on Eurostat data
In Poland, according to newest Eurostat data from 2016, there were 243.6 thousand farms keeping cows (including approx. 125 farms with dairy cows supplying raw milk to industry). Over 50% of farms kept up to 9 cows, and only a small percentage of farms (approx. 2%) kept a herd of over 100 head. This is the opposite to the other EU milk producing countries. In the
In terms of regions, dairy cows breeding is concentrated in seven voivodships: Kujawsko-Pomorskie, Lubelskie,
Mazowieckie, Podlaskie, Warmińsko-Mazurskie, Wielkopolskie and Łódzkie. In 2019, the total
share of these regions in the total number of cows and dairy cows was 81.7% and 83.9%, respectively.
STRUCTURE OF THE POLISH
MAP 1: Milk procurement by voivodships and change in % y-o-y in 2019
Warmińsko-mazurskie
Mazowieckie Podlaskie Lubelskie Świętokrzyskie Małopolskie Śląskie Łódzkie Wielkopolskie
Kujawsko-Pomorskie
Pomorskie Zachodniopomorskie Lubuskie Opolskie Dolnośląskie Podkarpackie +1.6% +1.1% +4.3% -6.8% -1.5% -4.2% +2.7% +1.9% +2.3% +4.1% +3.1% +5.8% -0.4% -2.7% -2.0% -0.3% Milk procurement in thousand liters
2.500.000 and more
2.000.000 - 1.500 000
1.000.000 - 500.000
350.000 - 250.000
200.000 - 150.000
140.000 and less
Total milk procurement in milion liters
11 827.9
Average milk procurement price in PLN/100 liters
135.27
Source: Based on unpublished CSO data
In the dairy industry in Poland, the processes of restructuring the raw material base will be continued. The smallest farms, which are characterized by small
scale effects and low farming efficiency, will resign from
milk production. The dairy industry will strive to reduce transaction costs related to the purchase of milk, but at the same time will generate a large demand for the raw material.
The processes of concentration of the raw material base will consist of reducing the number of suppliers with a simultaneous increase in the average volume of supplies from one farm. The economic situation on the market will
also have a significant impact on the number of cows.
Milk purchase prices are relatively high and stimulate the development of breeding in medium and large farms.
MAP 2: Density of dairy cows per 100 hectares of farmland in 2019
Warmińsko-mazurskie
Mazowieckie Podlaskie Lubelskie Świętokrzyskie Małopolskie Śląskie Łódzkie Wielkopolskie
Kujawsko-Pomorskie
Pomorskie Zachodniopomorskie Lubuskie Opolskie Dolnośląskie Podkarpackie 17,8 25,2 39,2 8,5 10,1 12,6 12,1 18,3 15,3 13,6 7,6 2,6 3,2 7,3 2,7 6,0
Source: Based on IAFE data In December 2019, the average density of dairy cows per
100 ha of farmland was 14,7 head and was the same as in the corresponding period of 2018. The highest density
A large stocking density is also found in the
Małopolskie Voivodeship (12,6 head) and in Śląskie (12,1 head), which is the result
FINANCIAL AND ECONOMIC SITUATION OF THE DAIRY INDUSTRY
TABLE 12: Financial and economic situation of the dairy industrySpecification 2015 2016 2017 2018 2019 2019/2018 (%)
Number of dairies 177 175 168 163 163 0.0%
Income from sales (million PLN) 26915 27637 33668 33168 34746 4.8%
Gross profit (million PLN) 451.0 666.9 642,4 526.4 621.1 18.0%
Profitability indicators in % of revenues:
- gross profit 1.66 2.39 2.33 1.57 1.77 12.7%
- net profit 1.31 1.95 1.89 1.28 1.36 6.3%
Current liquidity (ratio of current assets to short-term liabilities) 1.41 1.61 1.67 1.62 1.59 -1.9%
Investment rate (investments in relation to depreciation) 1.35 1.4 1.67 1.35 1.45 7.4%
Number of employees (thousand) 32238 32355 32878 32896 32949 0.2%
Share of direct exports in sales value% 15.2 15.7 16.6 16.7 18.4 10.2%
The share of dairy in the sales value of the food industry % 12.3 12.1 12.9 12.6 12.3 -2.4%
Source: Based on unpublished CSO and IAFE data
In 2019, compared to 2018, the economic and financial
situation of the Polish dairy industry improved, which was due to the relatively good situation on the domestic and
foreign markets. The reason for the good financial results was also the improvement of management efficiency,
including, above all, the higher dynamics of revenues from the overall business activity than operating costs. The increase in the purchase of milk and production of dairy products as well as relatively high sales prices caused a 4.8% increase in the sales value of the dairy industry in 2019 compared to 2018, to 34.7 billion PLN.
The gross profit of the industry increased by 18% to 621.1 million PLN. Gross and net profitability ratios, which are the relation of gross and net profit to net
revenues, amounted to 1.77 and 1.36%, respectively.
In 2018, profitability ratios were lower and amounted to
1.57% gross, and 1.28% net.
Milk processing is characterized by a lower net
profitability than the average for the entire food industry
due to the cooperative nature of the industry. Dairy cooperatives, where farmers are the main shareholders, pay relatively higher milk procurement prices. The dairy
industry is characterized by safe financial liquidity
(1.59) and is able to settle current liabilities.
In 2019, investment expenditures increased by 7.4% to PLN 974.6 million, but were by approx. 45% higher than depreciation charges (the so-called investment rate was 1.45). In the structure of investments, machines as well as buildings had the largest share. The share of investments in land and means of transport was small. Enterprises invested in new production lines and product packaging lines. Investments also concerned the storage and logistics base, as well as energy installations and water and sewage management, in order to reduce costs related to environmental protection.
SITUATION OF DAIRY
INDUSTRY IN POLAND
The Polish dairy industry continues its restructuring and modernization processes. The restructuring processes consist primarily in an increase in the concentration of processing. In 2019, the number of enterprises amounted to 163 and was the same as the year before.
The steady number of enterprises and higher deliveries of raw milk resulted in an increase in processing per enterprise (by 2% to 72.6 million liters). Technical
labor efficiency, measured by the processing of raw milk
per employee, increased by 1.7% to 359 thousand liters.
TOP 20 POLISH DAIRY COMPANIES
The biggest 20 dairy enterprises in Poland have a share of almost 75% in industry turnover, and the biggest 3 dairy companies generated approximately 40% of industry incomes from sales.
TABLE 13: Top 20 Polish dairy companies
Company Legal status Website in thousand Turnover
PLN Turnoer in thousand EUR % in indusrty turnover
SM Mlekovita Dairy Cooperative www.mlekovita.com.pl 5 218 175 1 214 094 15.02%
SM Mlekpol Dairy Cooperative www.mlekpol.com.pl 4 293 884 999 042 12.36%
Grupa Polmlek*
Limited Liability Company - Polish
capital www.polmlek.com 4 000 000 930 665 11.51%
THE LARGEST DAIRY
COMPANIES IN POLAND
Lactalis Company - French Limited Liability
Group www.lactalis.pl 905 910 210 775 2.61%
OSM Sierpc Dairy Cooperative www.osm-sierpc.pl 684 571 159 277 1.97%
OSM Koło Dairy Cooperative www.osmkolo.pl 678 313 157 821 1.95%
Hochland Company - German Limited Liability
Group www.hochland.pl 655 246 152 454 1.89%
Łumiko Łuków Company - Polish Limited Liability
capital www.lumiko.com.pl 600 467 139 708 1.73%
OSM Giżycko* Dairy Cooperative www.osm-gizycko.com.pl 585 000 136 110 1.68%
SM Spomlek Dairy Cooperative www.spomlek.pl 582 847 135 609 1.68%
Bakoma Company - Polish Limited Liability
capital www.bakoma.pl 555 186 129 173 1.60%
OSM
Włoszczowa* Dairy Cooperative www.osmwloszczowa.com.pl 434 000 100 977 1.25%
SM Gostyń* Dairy Cooperative www.smgostyn.pl 418 000 97 255 1.20%
OSM
Radomsko* Dairy Cooperative www.osmradomsko.pl 375 000 87 250 1.08%
OSM
Krasnystaw* Dairy Cooperative www.krasnystaw.eu 358 500 83 411 1.03%
OSM Ryki* Dairy Cooperative www.smryki.pl 331 400 77 106 0.95%
SM Mońki* Dairy Cooperative www.msm-monki.pl 290 000 67 473 0.83%
*Based on own research Source: Based on own research, company information and dairy journals publication
MAP 3: Top 20 Polish dairy companies location
The structural transformations occurring in the Polish dairy industry, to a large extent, arise from the processes of its adaptation to the uniform EU market conditions. The thorough modernization of milk production and processing technologies has enabled the producers to achieve a considerable improvement of the quality of dairy products, which alongside the cost and price advantage of Polish dairy producers is an important contributor to the competitiveness in the EU market. The history of the dairy in Poland assures its steady growth. Most cooperative dairies have been present in Poland for decades and their products have become popular on Polish people’s tables.
They are hard to topple or replace as they remain widely used in everyday meals, continuously remembered because of new products being launched regularly. Producers and processors will continue the process of consolidation, building the scale of production. More attention will be paid to animal welfare and environmental cleanliness. Implementation of the new technology for
specific dairy products such as whey and milk protein
concentrates, baby food etc. will take place.
Finding new markets outside Poland and EU (Poland
self-sufficiency in milk reaches 130%) is another
challenge for next years.
TABLE 14: SWOT analysis of Polish dairy industry
Strengths Weaknesses
Low cost of skilled labor Downward trend in milk consumption in household Low feed cost Small average herd size
Cattle population and yield per cow continue to grow Many small farms Decrease in number of supplies High prices of farmland Increase in average supply size per farm Low production of bio raw milk
High capacity of the processing lines Fragmentation of the structure of the business sector Modern production technology Reduction in the price advantages
Recognition on world market Export focused on products with low added value
Opportunities Threats
Increase trend in milk consumption outside home Brexit - could have a negative impact on dairy sector
Promoting the consumption of milk and milk products in the local market „Green deal” and „Farm to Fork” program - increasing the cost of raw milk production and dairy products Depreciation of PLN against EUR and USD will have a positive impact
on the export COVID-19 pandemic spreading (economic recession will have a negative impact on the labor market and household income) Implementation of innovative eco-friendly solution for energy,
management & marketing COVID-19 Reduction of economic entities in the HoReCa channel Implementation of non-gmo standard COVID-19 Disruption of the supply chain, problems with export Implementation of well-balanced diet Limited consolidation of processing industry
Increased export development Milk and milk products overproduction
Promotion of Polish brands in foreign markets Concentration and increase the power of large foreign retailers Development of different products to niche markets Relavitely low consumption
Source: Own elaboration on the base of literature review
SWOT ANALYSIS OF POLISH
Milk Market in Poland, no 57 & 58, Warszawa, 2019, 2020 IAFE-NRI. Milk Market Analysis, PIM 2018-2020.
Published and unpublished data from Polish Ministry of Finance and Central Statistic Office in Poland.
• https://appsso.eurostat.ec.europa.eu/nui/show.do?dataset=apro_mk_pobta&lang=en • https://appsso.eurostat.ec.europa.eu/nui/submitViewTableAction.do • https://stat.gov.pl/obszary-tematyczne/rolnictwo-lesnictwo/produkcja-zwierzeca-zwierzeta-gospodarskie/ fizyczne-rozmiary-produkcji-zwierzecej-w-2019-roku,3,15.html • https://appsso.eurostat.ec.europa.eu/nui/show.do?dataset=apro_mk_cola&lang=en • https://www.clal.it/en/?section=quadro_europa&country=PL • https://appsso.eurostat.ec.europa.eu/nui/show.do?dataset=ef_lsk_bovine&lang=en • dodać do literatury: • https://appsso.eurostat.ec.europa.eu/nui/show.do?dataset=apro_mk_pobta&lang=en • https://appsso.eurostat.ec.europa.eu/nui/submitViewTableAction.do • https://stat.gov.pl/obszary-tematyczne/rolnictwo-lesnictwo/produkcja-zwierzeca-zwierzeta-gospodarskie/ fizyczne-rozmiary-produkcji-zwierzecej-w-2019-roku,3,15.html • https://appsso.eurostat.ec.europa.eu/nui/show.do?dataset=apro_mk_cola&lang=en • https://www.clal.it/en/?section=quadro_europa&country=PL • https://appsso.eurostat.ec.europa.eu/nui/show.do?dataset=ef_lsk_bovine&lang=en CONTACT:
Embassy of the Kingdom of the Netherlands
Department of Agriculture, Nature and Food Quality