DRIVER DROWSINESS DETECTION
BASED ON EYE BLINK
A Thesis submitted for the degree of Doctor of Philosophy
By
INDRACHAPA BUWANEKA BANDARA
Faculty of Enterprise & Innovation,
Buckinghamshire New University
Brunel University
Abstract
Accidents caused by drivers’ drowsiness behind the steering wheel have a high fatality rate because of the discernible decline in the driver’s abilities of perception, recognition, and vehicle control abilities while sleepy. Preventing such accidents caused by drowsiness is highly desirable but requires techniques for continuously detecting, estimating, and predicting the level of alertness of drivers and delivering effective feedback to maintain maximum performance.
The main objective of this research study is to develop a reliable metric and system for the detection of driver impairment due to drowsiness. More specifically, the goal of the research is to develop the best possible metric for detection of drowsiness, based on measures that can be detected during driving. This thesis describes the new studies that have been performed to develop, validate, and refine such a metric.
A computer vision system is used to monitor the driver’s physiological eye blink behaviour. The novel application of green LED illumination overcame one of the major difficulties of the eye sclera segmentation problem due to illumination changes. Experimentation in a driving simulator revealed various visual cues, typically characterizing the level of alertness of the driver, and these cues were combined to infer the drowsiness level of the driver.
Analysis of the data revealed that eye blink duration and eye blink frequency were important parameters in detecting drowsiness. From these measured parameters, a continuous measure of drowsiness, the New Drowsiness Scale (NDS), is derived. The NDS ranges from one to ten, where a decrease in NDS corresponds to an increase in drowsiness. Based upon previous research into the effects of drowsiness on driving performance, measures relating to the lateral placement of the vehicle within the lane are of particular interest in this study. Standard deviations of average deviations were measured continuously throughout the study.
The NDS scale, based upon the gradient of the linear regression of standard deviation of average blink frequency and duration, is demonstrated as a reliable method for identifying the development of drowsiness in drivers. Deterioration of driver performance (reflected by increasingly severe lane deviation) is correlated with a decreasing NDS score. The final experimental results show the validity of the proposed model for driver drowsiness detection.
Acknowledgements
I express my great appreciation to my supervisors Dr Peter Harding and Professor John Boylan, especially John for his patient support, encouragement and valuable guidelines along this research. A special thanks to my previous supervisor Professor Chris Hudson for his valuable guidance.
Especial thanks to Professor Scott Glickman (Queen Mary's Hospital and Aylesbury Hospital) for his valuable advice and Peter Thomas (Uppsala University, Sweden); and thanks to Faculty Research Officers Laura Bray and Peter Wilkinson for their responsible work.
Many thanks to Howard Bush and Dr Anne Evans in the University Research Unit, for all official proofs they gave. I am grateful to the University’s Learning Resources Centre staff for their kindly support for obtaining documents I required.
I would like to thank many of my friends and colleagues who gave me valuable comments on my research and support on the simulator test.
Finally, I will give my huge thanks to my dear wife and my parents for their moral support through and through. I would also like to thank my sister and brother-in-law for their support and especially my father, who has been an extraordinary mentor.
Author’s declaration
This is to certify that the work submitted in my thesis is my own and has not been submitted for any other degree.
Attention is drawn to the fact that some of the preliminary results have been published. Chapter 5 (“Eye Blink Detection System”) has been published as:
• Detection and Tracking of Eye Blink to Identify Driver Fatigue and Napping, 2nd International Road Safety Conference, 6-7 Nov 2006, Dubai UAE.
• Detection and Tracking of Eye Blink to Identify Driver Fatigue and Napping-stage -1, HCI 2006 Engage, The 20th BCS HCI Conference, 11-15 Sept 2006, Queen Mary University London.
• Detection and Tracking of Eye Blink using their Physiological Appearance and Dynamics with MATLAB Simulink, Quality Drivers Lean, IIE/ASQ Lean and Quality conference, 30-31 Oct 2006, Atlanta, USA.
• Detection and Tracking of Eye Blink to Identify Driver Fatigue, Research Poster Conference 2006, Brunel University, London.
"I grant powers of discretion to the University Librarian to allow this thesis to be copied in whole or in part without further reference to me. This permission covers only single copies made for study purposes, participant to normal conditions of acknowledgement".
Contents
Abstract... ii
Acknowledgements...iii
Author’s declaration ... iv
Contents ... v
List of Illustrations... xii
List of Tables ...xviii
Abbreviations ... xx
1. CHAPTER 1 ... 21
1.1. Motivation... 22
1.1.1. Driver Drowsiness and Road Accidents ... 22
1.1.2. The Mechanisms of Human Sleepiness ... 24
1.1.3. Biology of Human Sleepiness and Fatigue ... 24
1.2. Evaluating Current Driver Drowsiness Detection Methods ... 26
1.2.1. Concepts and Theories of Fatigue and Drowsiness ... 28
1.2.2. Review of Driver Drowsiness Detection Devices... 29
1.3. Research Aim and Objectives ... 31
1.4. Thesis Structure ... 33
1.5. Summary... 37
2. CHAPTER 2 ... 38
2.1. Introduction... 39
2.2. Driver Drowsiness... 39
2.3. Driver Drowsiness and Road Accidents... 39
2.4.1. Lack of Sleep... 41
2.4.2. The Time of Day ... 42
2.4.3. Time on Task... 44
2.4.4. Type of Driver... 44
2.5. Physiological Measures Related to Driver Drowsiness Detection ... 45
2.5.1. Eyelid Closure... 45
2.5.2. Eye Movements... 46
2.5.3. Muscle Activity... 47
2.5.4. Brain Wave Activity ... 48
2.5.5. Heart rate Variability... 49
2.5.6. Pupil Aperture Size Variability... 49
2.6. Evaluation of Drowsiness with Physiological Measures... 50
2.7. Other Methods of Drowsiness Detection ... 56
2.7.1. Number of hours sleep ... 56
2.7.2. Epworth Sleepiness Scale (ESS)... 57
2.8. PERCLOS (percentage eye closer) measure ... 57
2.9. Summary... 59
3. CHAPTER 3 ... 62
3.1. Introduction... 63
3.2. In-Vehicle Technology... 64
3.2.1. In -Vehicle Drowsiness Detection ... 65
3.2.2. Generic Driver Assistance and Warning Devices ... 65
3.2.2.1. Optalert™ system ... 66
3.2.2.2. “Co-pilot” system ... 67
3.2.2.4. The ‘FaceLAB’ system ... 69
3.2.2.5. Head Nodding Monitor – Dozer’s Alarm... 71
3.2.2.6. The “Head box” system... 72
3.3. Summary of Drowsiness monitoring devices... 74
3.3.1. Drowsiness monitoring systems and technique ... 74
3.4. Summary... 75
4. CHAPTER 4 ... 77
4.1. Introduction... 78
4.2. Detailed Research Methodology ... 79
4.2.1. Physiological Measures... 80
4.2.2. Apparatus ... 82
4.2.2.1. Simulator ... 82
4.2.2.2. Eye Blink Detection System... 83
4.2.2.3. Vision Chip... 86
4.2.2.4. Noise reduction caused by illumination. ... 89
4.3. Driving Performance Measures... 91
4.3.1. Participants... 92
4.3.2. Driving Scenarios... 93
4.4. Variables Measured Throughout the Driving Simulator Test ... 94
4.4.1. Eye Blink Data ... 94
4.4.2. Driving Performance Data ... 94
4.4.3. Reaction Time Data... 95
4.4.4. Speed related data ... 95
4.5. Procedure... 97
4.7. Summary... 99
5. CHAPTER 5 ... 100
5.1. Introduction... 101
5.2. Camera Hardware ... 103
5.3. Frame Resolution and Capture Speed ... 104
5.3.1. Human Eye Blink... 104
5.3.2. Accuracy of Eye Blinks Capture... 105
5.4. Exploiting the confidence measure for eye blink detection... 107
5.4.1. Eye Terminology... 108
5.5. Proposed System ... 108
5.5.1. Video Capture and Conversion ... 113
5.5.1.1. Effect of changing illumination in detection ... 113
5.5.2. Background Estimation... 117
5.5.3. Template Matching ... 119
5.5.3.1. Blob Analysis technique... 125
5.6. Eye blinks duration and blink frequency calculation. ... 130
5.7. Summary... 131
6. CHAPTER 6 ... 133
6.1. The Driving Simulator... 134
6.2. Experimental design ... 135
6.2.1. Virtual-Reality-driving simulator... 135
6.2.2. Architectural Design of the VR-Simulator ... 137
Figure 6-4: Hardware interface devices ... 140
6.2.3. VR Behavioural Module ... 140
6.2.3.1. Shapes... 141
6.2.3.3. Car and circuit design... 141
6.2.4. Realistic feedback ... 144
6.3. Reaction time measuring system ... 145
6.4. Summary... 148
7. CHAPTER 7 ... 149
7.1. Introduction... 150
7.2. Measures to Identify Drowsiness in Drivers... 151
7.2.1. Driving Performance Measures... 151
7.2.2. Self reported measures ... 156
7.2.3. Speed Related Measures ... 160
7.2.4. Physiological Measures... 163
7.3. Experimental Design... 165
7.3.1. Participant Procedure ... 166
7.3.2. Experimental Task Procedures... 167
7.4. Data Analysis Overview ... 167
7.4.1. Variables to be analysed... 167
7.4.2. Regression and Correlation Analysis ... 173
7.4.3. The t-test analysis... 175
7.4.4. Linkage between variables... 176
7.5. Summary... 177
8. CHAPTER 8 ... 179
8.1. Introduction... 180
8.1.1. Standard Deviation (SD) Calculation... 181
8.1.2. Participants... 186
8.2. Self reported measures analysis... 187
8.3. Effect of Sleep Duration on Driver Performance ... 192
8.3.1. Participants Who Participated in Sleep Deprived Condition ... 194
8.3.2. Sleepiness Scale (SLEPSCAL) ... 199
8.3.3. Age (AGE) and Time of the day (TODD) ... 201
8.3.4. Conclusions of the self reported measures... 203
8.4. Correlation of physiological & speed related measures with performance measures... 204
8.4.1. Final regression model of predictor and predicted variables ... 207
8.5. The duration of eye blinks and blink frequency changes with drowsiness ... 208
8.6. Final correlation analysis model... 212
8.7. Correlation analysis for SD of average blink duration and average blink frequency. ... 213
8.7.1. Alert participants ... 218
8.7.2. Drowsy participants ... 219
8.8. A New Scale of Drowsiness Based on Multiple Characteristics of Blinks. ... 220
8.8.1. Evaluating the Goodness of Fit ... 220
8.8.2. Calculating Slope (m) for all alert and drowsy participants ... 221
8.8.3. Logarithm of Slope (m) values and ranking ... 222
8.8.4. Categorization of New Scale... 224
8.9. Validation of new drowsiness scale ... 224
8.9.1. Relationship between driving performance and new drowsiness scale (NDS) 225 8.9.2. Variability in lane position (SD-AVEDEV) ... 226
8.10. Summary... 233
9. CHAPTER 9 ... 236
9.1. Discussion ... 237
9.1.1. Eyelid closure... 240
9.1.2. Driving performance measures ... 241
9.2. Research Conclusions ... 241
9.2.1. The Methodology ... 241
9.3. Research Results ... 243
9.3.1. Main Findings ... 244
9.3.1.1. Drowsiness detection... 244
9.3.1.2. Eye blink detection ... 245
9.4. Recommendations... 246
9.5. Limitations of the study and further research and analysis ... 247
10. References ... 249
11. Appendix - A1- Driver Drowsiness Detection Techniques... 271
12. Appendix – A2, Driver Drowsiness Detection Systems ... 274
13. Appendix – A3, Driver Drowsiness Detection Techniques... 278
14. Appendix – B1, Driver Performance Data ... 282
15. Appendix – B2, Eye Sclera Region Calculation ... 284
16. Appendix – C1, Morphological Operations... 286
List of Illustrations
Figure 1-1: Project Overview... 34
Figure 2-1: Fatigue during seventy-two hours of sleep deprivation (BOSB, 1997) .. 43
Figure 2-2: Time required falling asleep (BOSB, 1997)... 43
Figure 2-3: Positions of Physiological Measures... 49
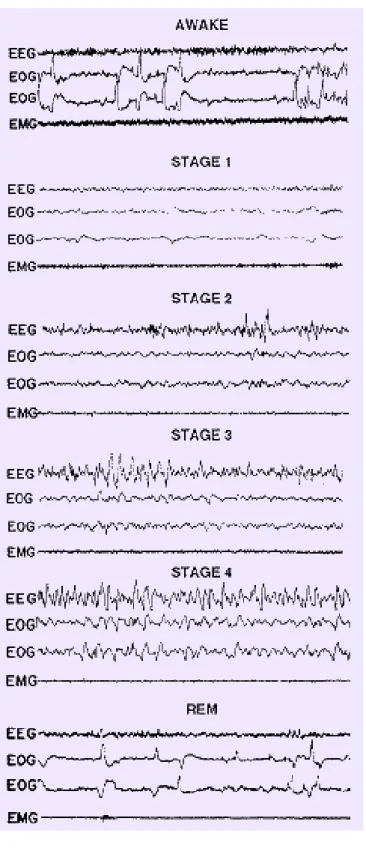
Figure 2-4: Polygraphic recording in an alert young adult ... 53
Figure 2-5: EEG, EOG and EMG measures of waves of the brain nerves. ... 54
Figure 2-6: Less Response to Sensory Input during Sleep ... 55
Figure 3-1: The “Co-pilot” system... 68
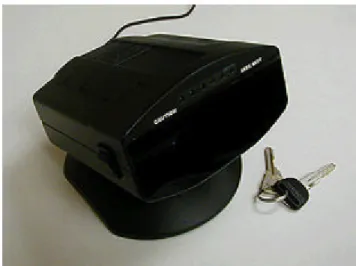
Figure 3-2: The Onguard eye closure monitor (Haworth & Vulcan, 1991)... 69
Figure 3-3: The interior of the simulator used in the study FaceLab system (Victor et al., 2001). ... 70
Figure 3-4: Dozer’s Head nodding monitor (Haworth & Vulcan, 1991)... 71
Figure 4-1: Equipment Arrangement of Drowsiness Experiment... 81
Figure 4-2: Driving Simulator... 83
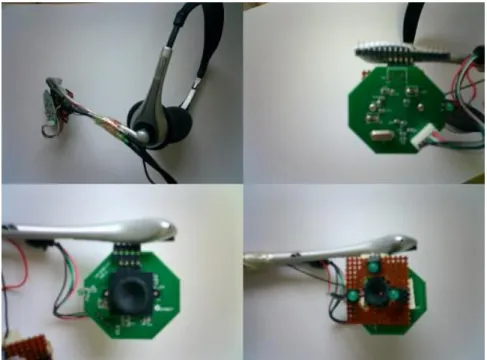
Figure 4-3: Eye Blink Detection System. ... 85
Figure 4-4: The CMOS 350K Vision Chip ... 86
Figure 4-5: Schematic of the hardware setup for the eye tracking device. ... 89
Figure 4-6: Specifications of the green LED setup... 91
Figure 5-1: Prototype system of Eye blink capture device ... 104
Figure 5-2(a): Total eye blinks at 1st, 10th and 30th minute for all participants... 106
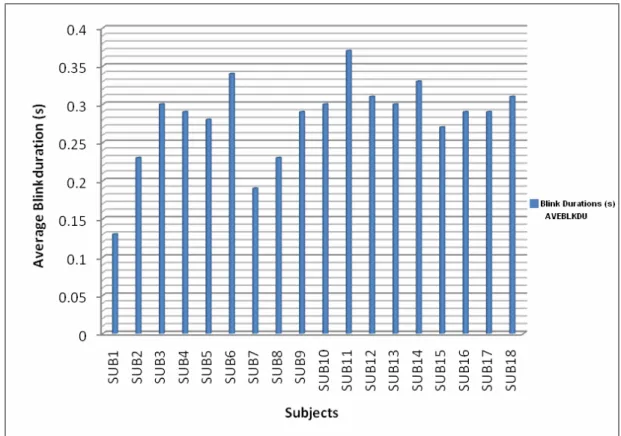
Figure 5-2(b): Average blink durations at the 15th minute during the test for all participants... 107
Figure 5-2(c): Frame by frame images of the complete eye blink... 107
Figure 5-3: Eye Anatomy (Werkmann, 2005) ... 108
Figure 5-4 (a): Block diagram of Eye Blink Detection System ... 110
Figure 5-4 (b): Complete eye blink detection system, MATLAB Simulink ... 111
Figure 5-5(a): RGB histogram of captured eye colour (RGB) image without the Green light system ... 115
Figure 5-5(b): Intensity increased and Green light system image (left), Blue light image (right) and RGB Histogram (bottom). ... 115
Figure 5-5(c): Eye images with and without green illumination ... 116
Figure 5-6: The background estimation process, Simulink control diagram. ... 118
Figure 5-7: Background motions slowing process (Matlab Help, 2005)... 118
Figure 5-8: (a) Side view of eye, (b) Grey scale morphology of captured eye sclera area... 119
Figure 5-9: Template matching Simulink block diagram. ... 120
Figure 5-10: Eye sclera template (binary image for template matching)... 120
Figure 5-11: Left-Gray image matrix view with similar colour regions to eye sclera, and Right- 3x3 Median filter applied image (Image smoothing) ... 121
Figure 5-12: Eye image and Template mask... 122
Figure 5-13: Constructed morphological operation to remove eye lashes... 123
Figure 5-14: Eye blink tracking process (above), and eye sclera area measure process (below) ... 124
Figure 5-15: (a) Binary image before adding morphological Closing, (b) after morphological Closing... 125
Figure 5-16 (a): Full opened eye sclera region, image from left- (i) captured eye sclera image using green illumination system, (ii) Blob analysis tracking image.
... 125
Figure 5-16 (b): half way closed eye, eye sclera area reduced in binary image ... 126
Figure 5-16 (c): captured 3/4 of closed eye ... 126
Figure 5-17: (a) The Blob detection model of eye sclera region detect using ellipse method, (b) Half eye close position, (c) quarter of eye close position. ... 127
Figure 5-18 (a): Frame by frame eye images used for the blink count. ... 128
Figure 5-18 (b): Frame by frame eye images used for the blink count... 128
Figure 5-19: The Simulink model designed to measure different size of eye sclera regions... 130
Figure 5-20: Eye sclera areas for eighteen participants for half eye open. ... 130
Figure 5-21: Complete eye blink detection process... 132
Figure 6-1: VR- based simulator screen... 136
Figure 6-2: Overall architecture of the driving simulator. ... 138
Figure 6-3: V-Realm builder virtual reality interface ... 139
Figure 6-5: Impression of the ‘VR Sink’ in Simulink ... 142
Figure 6-6: Out of Bounds on VR road system... 143
Figure 6-7: Road layout and centre line... 143
Figure 6-8: Reaction time measure setup... 145
Figure 6-9: Matlab V-Realm colour light change model ... 147
Figure 7-1: Maximum speed in first five minutes (Participant 1)... 162
Figure 7-2: Average speed in first five minutes (Participant 1)... 162
Figure 7-3: Implicit Model, Predicted and Predictor variables for drowsiness detection... 173
Figure 7-4: Predictor and Predicted variables analysis ... 174
Figure 7-5: Stat model of correlation analysis ... 174
Figure 7-6: Linkage between collected drowsiness detection measures... 176
Figure 8-1: Difference between deviations, AVDEV and SD-AVEDEV ... 182
Figure 8-2(a): (i) Linear Correlation of AVEBLKDU and AVEBLKFR, (ii)
Linear Correlation of SD-AVEBLKDU and SD-AVEBLKFR... 183
Figure 8-2(b): (i) Linear Correlation of AVEBLKDU and AVEDEV, (ii) Linear Correlation of SD-AVEBLKDU and SD-AVEDEV... 184
Figure 8-2(c): (i) Linear Correlation of AVEBLKDU and AVEREATM, (ii)
Linear Correlation of SD-AVEBLKDU and SD-AVEREATM ... 185
Figure 8-3: Block Diagram of the Main Steps in the Drowsiness Metric Development Procedure ... 186
Figure 8-4: Epworth sleepiness score for each participant ... 187
Figure 8-5: SD of AVEDEV and SD of AVEREATM with ES score for all participants... 189
Figure 8-6: Boxplot of ES score and average deviations (AVEDEV)... 190
Figure 8-7: Boxplot of ES Score and average reaction time (AVEREATM)... 191
Figure 8-7: Boxplot of sleep durations (two groups) and SD of AVEDEV ... 193
Figure 8-8: Boxplot of sleep durations and AVEREATM (during 24 hour period) 194 Figure 8-9(a): Comparison of average deviations (AVEDEV) of participants with their normal conditions and sleep deprivation condition... 195
Figure 8-9(b): Comparison of average reaction time (AVEREATM) of participants with their normal conditions and sleep deprivation condition... 195
Figure 8-10(a): Average deviations and average blink durations for participant 1: sleepy condition. ... 197
Figure 8-10(b): Average deviations and average blink durations for participant 1: not-sleepy condition... 198 Figure 8-11: Standard deviation of average deviations (SD-AVEDEV) for four
participants under sleepy (S1sl, S3sl, S9sl, S14sl) and not-sleepy (S1, S3, S9, S14) condition... 199 Figure 8-12: Boxplot of SLEPSCL score before and after the simulation test for all
participants... 200 Figure 8-13: Boxplot of performance; participants participated in two sessions .... 202 Figure 8-14: Final regression analysis model ... 207 Figure 8-15: SD of AVEBLKDU and AVEBLKFR variations for participants 1, 3, 9
and 14 in alert and sleepy conditions... 210 Figure 8-16: The mean values of SDAVEBLKDU and SDAVEBLKFR for eighteen
participants and the four participants participated in sleep deprivation conditions ... 211 Figure 8-17: Final correlation analysis model and the drowsiness prediction model ... 212 Figure 8-18: Correlation analysis: measure of linear relationship strength between
SDAVEBLKDU and SDAVEBLKFR for all alert and drowsy participants ... 218 Figure 8-19: The residual plot for participant 1 in alert condition... 220 Figure 8-20: SD of AVEDEV across new drowsiness scale for all participants ... 225 Figure 8-21: SD-AVEDEV and NDS categories for all alert and sleep-deprived
participants... 227 Figure 8-22(a): Participants 1’s SD-AVEDEV changes during 35 minutes and NDS ... 228
Figure 8-22(b): Participants 9’s SD-AVEDEV changes during 35 minutes and NDS
... 228
Figure 8-22(c): Participant 14’s SD-AVEDEV changes during 35 minutes and NDS ... 229
Figure 8-22(d): Participant 3’s SD-AVEDEV changes during 35 minutes and NDS ... 229
Figure 8-23: Participants 9’s SD-AVEDEV changes during 35 minutes and NDS (alert)... 230
Figure 8-24: NDS categories across SD-AVEDEV for the SUB -5 (high ESS). .... 231
Figure 8-25: Drowsiness scale and Average deiviation dring 35minute simualtor test for Participant 5 ... 232
Figure 8-26: Drowsiness scale (ln of slope) variations of AVEDVE for alert participant -1 ... 232
Figure 8-27: The average reaction time (AVEREATM) changes with drowsiness scale (logarithm values of slope (m)) participant 9 ... 233
Figure 9-1: Eye blink capturing device setup and system development process... 242
Figure 9-2: Categorization of Drowsiness Scale... 244
List of Tables
Table 2-1: Autonomic Nervous System Activity during Sleep ... 50
Table 3-1: Summary of drowsiness monitoring devices... 74
Table 5-1: The spectral reflectance curves of skin (Wyszecki & Stiles, 1992). ... 114
Table 7-1: Eye Measure vs. Lane Measure Correlations. (Dinges et al., 1985; Kircher et al., 2002) ... 153
Table 7-2: Questionnaire Structure ... 156
Table 7-3: Data manipulation procedure... 172
Table 8-1: Linear Correlation Comparison ... 182
Table 8-2: Epworth score compare with AVEDEV and AVEREATM for all participants... 191
Table 8-3: Sleep durations and median values of average deviations for all participants... 193
Table 8-4: Variation analysis for SD of AVEDEV for sleepy and not sleepy conditions... 197
Table 8-5: The advantages and disadvantages of self reported measures... 203
Table 8-6: Sets of measures used in Regression Analyses for each predicted variables. ... 204
Table 8-7: Table of Regression Analyses Results Showing R Values for single participant (Alert/Drowsy)... 205
Table 8-9: Correlation coefficients of SDAVEBLKDU and SDAVEBLKFR for all alert and drowsy participants ... 219 Table 8-10: Participants’ data with linear regression m (slope) values ... 222 Table 8-11: The slope (m) values, ‘ln’ (natural logarithm) values and rank order. . 223 Table 8-12: Categorization of Drowsiness Scale ... 224 Table 8-13: SD-AVEDEV averaged to NDS categories and ln of slope (m) ... 226 Matrix C-1: Modified structuring element for Erosion... 286
Abbreviations
AC Alternative Current
ADC Analog Digital Converter
AVI Audio Video Interleave
CCD Charge-Couple Device
CDL Commercial Driving License
CMOS Complementary Metal oxide Semiconductors
CMV Commercial Motor Vehicle
CDL Commercial Driving License
DC Direct Current
DDDS Drowsy Driver Detection System
DSP Digital Signal Processor
EEG Electroencephalogram
EMG Electromyograpic
EOG Electrooculogram
ESS Epworth Sleepiness Scale
HSV Hue, Saturation values-a colour space model
IR Infrared
JDS Johns Drowsiness Scale
JTV Johns’ Test of Vigilance
KSS Karolinska Sleepiness Scale
LED Light Emitting Diode
MC Microcontroller
MWT Maintenance of Wakefulness Test
NIR Near- Infrared
OO Orbicular Oculi
PERCLOS Percentage eye lid closure
REM Rapid Eye Movements
RGB Red, Green and Blue colour system
RGB Primary Colours (Red, Green, Blue)
SVM Support Vector Machine
TOD Time-of-Day
TOT Time-on-Task
VAS Visual Analogue Scale
1. CHAPTER 1
INTRODUCTION TO DRIVER DROWSINESS AND
1.1.
Motivation
Loss of driver alertness is almost always preceded by psycho-physiological changes (Weirwille, 1994); these changes are the reason that it is possible to detect the onset of drowsiness associated with loss of alertness in driving.
The basic idea behind driver drowsiness detection systems is to monitor the driver unobtrusively by means of a reliable system that can detect when the driver is impaired by drowsiness. This system senses various driver-related variables (such as physiological measures) and driving-related variables (driving performance measures), computing measures from these variables on-line, and then using the measures separately or in a combined manner to detect when drowsiness is occurring, and more importantly to predict the onset of drowsiness. Measures are combined because no single unobtrusive operational measure appears adequate in reliably detecting drowsiness (Weirwille, 1994).
It is important to point out the distinction between prediction and detection of drowsiness. Clearly prediction is the main aim, since at the detection point, drowsy driving may already have led to a potentially hazardous situation or even an accident. Another aspect is the great inter-individual variability in driver and driving behaviour, which an eventual automated system must be able to handle.
1.1.1.
Driver Drowsiness and Road Accidents
Driver drowsiness represents an important risk on the roads, as it is one of the main factors leading to accidents or near-missed accidents (Weirwille, 1994). This has been proven by many studies that have established links between driver drowsiness
and road accidents. Reducing the number of accidents related to driver drowsiness would save society a significant amount of money and personal suffering.
According to data from The Royal Society for the Prevention of Accidents (RoSPA 2006), 20% of serious accidents in the UK are due to driver extreme tiredness or weariness resulting from physical or mental activity (Haworth & Rowden, 2006). Whitty, et al. (2000) identified drowsiness as one of the main areas of driver behaviour to be addressed to reduce the number of people killed or seriously injured in road accidents. In driving experiments concerning drowsiness, there is the repeatedly observed phenomenon called ‘driving without awareness’ (DWA), which occurs when drivers demonstrate low attention levels during driving without being drowsy. At a certain moment the driver ‘awakes’ and he or she cannot remember the foregoing drive period. This phenomenon has been labelled as ‘Driving without awareness’ and also as ‘Highway hypnosis’ or ‘Driving without attention mode’ (DWAM) (Brown 1997).
Driver state monitoring is an ongoing topic concerning the development of driver support systems to prevent car accidents resulting from sleep. There are several criteria to predict driver drowsiness. The most important are related to the eye blink behaviour of the driver, and prolonged eyelid closure. Observation of the eye blink phenomenon is an important factor to identify driver drowsiness. The development of technologies for detecting or preventing drowsiness at the wheel is a major challenge in the field of accident avoidance systems. Owing to the hazard that drowsiness presents on the road, methods need to be developed for counteracting its effects.
1.1.2.
The Mechanisms of Human Sleepiness
A body of literature exists on the mechanisms of human sleep and sleepiness that affect driving risks. The sleep-wake cycle is governed by both homeostatic and circadian factors. Homeostasis relates to the neurobiological need to sleep; the longer the period of wakefulness, the more pressure builds for sleep and the more difficult it is to resist (Dinges et al., 1995). The circadian pacemaker is an internal body clock that completes a cycle approximately every 24 hours. Homeostatic factors govern circadian factors to regulate the timing of sleepiness and wakefulness.
1.1.3.
Biology of Human Sleepiness and Fatigue
‘Fatigue’ is generally used in everyday speech to describe a general set of feelings or sensations, including one or more of the following: tiredness, sleepiness, boredom, or physical weariness. However, the term is too imprecise to be useful in scientific research. For this type of research, it is necessary to describe fatigue in terms of an operational definition. There is a lack of an agreed definition of fatigue, even as to whether the term refers to a fact or a theoretical entity. ‘Sleepiness’ is also difficult to define. In this thesis, it is taken to be synonymous with ‘drowsiness’ and its definition, and distinction from ‘fatigue’, is discussed in section 1.2.1.
Fatigue has subjective, objective (performance) and physiological components which may occur in the short-term or as a continual state. Many theories of fatigue have been proposed, varying in their precision and the type of concepts they employ. Neural models are inspired by the structure of the brain and a neural network consists of a set of highly interconnected entities, called nodes or units. Each unit is designed to mimic its biological counterpart, the neuron. Each accepts a weighted set of inputs
and responds with an output (Anderson, 1995) but may be more suited to the explanation of muscular fatigue than to driver fatigue (Rong-ben, et al., 2003). Arousal theories can explain why fatigue develops in the low demand situation of highway driving, as it links the concepts of attention and fatigue and allows for psychological and physiological measures of fatigue. One disadvantage of these theories is that the physiological measures sometimes give inconsistent results (Eby & Kantowitz, 2006).
The study by Brown (1997) suggested that three main factors determine whether humans can continue performing work at an acceptable level in the long term: (1) the length of continuous work spells and daily duty periods; (2) the length of time away from work that are available for rest and for continuous sleep; and (3) the arrangement of duty, rest, and sleep periods within the 24-hour cycle of daylight and darkness, which normally determines individuals’ circadian rhythms. For drivers who work shifts or irregular hours over extended periods, the effects of these three factors are not independent. Drowsiness can become irresistible; recognition is emerging that neurobiological based sleepiness contributes to human error in a variety of settings, and driving is no exception (Horne & Reyner, 1995).
The terms ‘drowsiness’ and ‘inattention’ are likely to be used with sleepiness; however, these terms have individual meanings (Brown, 1997). It is more appropriate to use the term ‘drowsiness’ as the consequence of a physical phenomenon or a long-lasting experience and it is defined as a disinclination to continue the task at hand (Brown, 1994). In regard to driving, a psychologically based conflict occurs between the disinclination to drive and the need to drive. One result can be a progressive withdrawal of attention to the tasks required for safe
driving. Inattention can result from drowsiness, but the crash literature also identifies other factors such as preoccupation and distractions inside the vehicle, as causes of inattention.
1.2.
Evaluating Current Driver Drowsiness Detection Methods
One of the major problems in dealing with crashes and road safety is the difficulty in detecting driver drowsiness. Drowsiness is different from other road safety problems that can emanate from changes in the driver’s functional state, such as alcohol or drugs, which can be detected comparatively readily by measuring their content in the body. Drowsiness measurement is a significant problem as there are few direct measures, with most measures being of the outcomes of drowsiness rather than of drowsiness itself. However, it is probable that one very important aspect of fatigue, namely drowsiness, is related to some physiological measures such as eye blink behaviour, brain wave changes (EEG measures) and face muscle changes (Johns et al., 2003, Wierwille and Muto, 1981).
The characteristics of drowsiness measurement present a real problem for road safety. Over the last ten years, there has been an increasing interest in the development of drowsiness detection devices, with some motor vehicle manufacturers including devices in their vehicles that are marketed as ‘drowsiness warning systems’ (Fletcher et al., 2003; Lee et al., 2006). The problem of drowsiness detection is being researched using a range of approaches. Johns et al., (2003) argue that video camera methods have difficulty in capturing images reliably when the environmental light conditions are highly variable, as when driving in sunlight with shadows, or when prescription glasses or sunglasses are worn. The Johns Drowsiness Index or JDI (Johns & Tucker, 2005) is the most recent driver drowsiness detection
method and followed the PERCLOS (percentage of eye lid closer, Dinges & Grace, 1998) method. The JDI has been implemented in a commercial product called “Optalert” which detects eye blink open and close speed to predict driver drowsiness using IR (infrared) light.
There are standardized methods for monitoring sleep and wakefulness in patients with sleep disorders that have been used on experimental participants in sleep laboratories around the world. Those methods include monitoring the electroencephalogram (EEG), the electrooculogram (EOG), and the electromyogram (EMG). However, the need for electrodes to be attached to the participant makes these methods inappropriate for monitoring drivers regularly. Moreover, when such methods have been used for research in drivers, they did not detect drivers’ drowsiness well (Wierwille and Muto, 1981).
The video camera method used to detect the driver’s eye movements is more often used than EEG/EOG methods (Wylie et al., 1996). The video camera systems are particularly used for the PERCLOS (Dinges & Grace, 1998) method which measures the proportion of time that the pupils are at least 80% covered by the eyelids during periods of a few minutes. In this method, video cameras have to be fitted in front of the eyes to capture eyelid closure duration. If the camera is not fitted to a head mounted unit, advanced detection algorithms are required to track the eyes when head movements occur. The majority of research on driver fatigue detection has identified that eye blink and eye movements are the most consistent factors to predict driver drowsiness (Erwin et al., 1980; Johns et al., 2003).
1.2.1.
Concepts and Theories of Fatigue and Drowsiness
Muscio (1921) started researchers thinking about the necessity of defining drowsiness. He argued that without an acceptable definition and reliable measures, it was impossible to conduct drowsiness tests. The earliest definitions separate fatigue into three different types: subjective fatigue, the feeling of being tired; physiological fatigue, as determined from bodily changes; and objective fatigue, when performance on a task shows a progressive deterioration (Platt, 1964).
Cameron (1973) also looked at drowsiness, especially in relation to driving. He argues the importance of anxiety, and examines the link between drowsiness and sleep disturbances. Cameron suggests that drowsiness is a generalized response to stress over time.
The term “drowsiness” as used in this thesis refers to a state of reduced alertness (Wierwille et al., 1994), usually accompanied by physiological and performance changes that may result in impaired driving. The term “driver fatigue” is also widely used to describe this condition, especially on Police Accident Reports and in accident data files. However, Stern et al. (1994), Tepas & Paley (1992) and others have pointed out that drowsiness is distinct from physical fatigue. Fatigue and Drowsiness are two interrelated, but distinct phenomena; observed in a number of psychiatric (diagnosis and prevention of mental and emotional disorders), medical and primary sleep disorders. Despite their different implications in terms of diagnosis and treatment, these two terms are often used interchangeably (Sharon et al. 1996).
1.2.2.
Review of Driver Drowsiness Detection Devices
A review of commercial and experimental driver drowsiness detection systems presently available was undertaken. Since the majority of the devices were based on computer vision techniques, most of the investigation is related to these topics. The majority of systems used eye tracking and blink related methods. Most eye tracking devices are based on computer vision imaging systems, yet some are based on other means of detection. For instance, one technique is based on fixed items such as a tiny mirror engraved on a head mounted unit; the reflections of eye images from these mirrors serve as detectable points for a tracker CCD camera or even a single photo detector, (Beach et al., 1998). Other items such as induction coils have been embedded within contact lenses to give a signal when the user is exposed to a high electromagnetic field (Takemori et al., 1989). Another method detects the changes in the electrical potential of the skin around the eye (described in section 2.5.3), since an electrostatic field rotates along with the eye.
A common drawback of the above methods of detection lies in the difficulty of use for driver drowsiness detection. For example, the application of contact lenses or electrodes to one’s eye is uncomfortable for the user. The more effective methods were found to be imaging systems that did not interfere with their participants. Such video devices are fixed on a vehicle dashboard to capture the driver’s facial expressions and eye movements. These methods are commonly used to detect driver drowsiness but encounter difficulties of use requiring advanced detection algorithms to minimize the environmental light changes and vehicle vibrations. Many imaging techniques have been developed based on reflections of light from various portions of the eye. Some of these methods detect reflections off the surface of the eye, where
the changes in the intensity of reflected light beams are used to detect eye blink. These methods use Infrared (IR) light which is invisible and will not disturb the driver. The only disadvantage with IR systems is concern for the safety of the human eye.
The hazard potential of near-infrared (NIR) light should be considered from two perspectives: eye hazards and skin hazards.
The eye lens focuses the light on the retina. Focused light is stronger in terms of irradiance than non-focused light. Hence, injury potential increases with focusing. The majority of eye blinks detection systems that use IR light are focused light. There are some efforts by the International Commission on NonIonizing Radiation Protection (ICNIRP), the International Electrotechnical Commission (IEC) and American National Standards Institute (ANSI) to develop regulations about IR LED hazards. Most efforts have been concentrated on eye injury due to radiated energy (Bozkurt & Onaral, 2004).
The studies by Mori et al. (1999) found infrared radiation will increase eye temperature. A finite element model of the human eye is employed to calculate the temperature rises experienced by the intraocular (inside eyeball) media when exposed to infrared radiation. The model is used to calculate transient and steady-state temperature distributions for various exposure times and a range of incident irradiances. The effect of the eye's natural cooling mechanisms on the heating is investigated. Specific absorption rates in the infrared irradiated eye are presented. Results showed radiant energy by the iris and the lens combined with conduction of heat from the anterior regions is found to be responsible for increases in the lens temperature of 1-2 degrees C. Even if low power IR is used, long exposure to the naked eye will be harmful to eye cells and the retina.
The studies by Scott (1998) found temperature increase of the human skin caused by near infrared LEDs. Effects of the conducted and radiated heat in the temperature increase have been analysed separately. Research results show the skin temperature may be increased by up to 1°C. The effect of radiated heat due to NIR (Near Infrared) absorption is low – less than 0.5°C – since emitted light power is comparable to the NIR part of sunlight. The conducted heat due to semiconductor junction of the IR LED can cause temperature increases up to 9°C. Scott’s study demonstrates that the major risk source of the LED in direct contact with skin is the conducted heat of the LED semiconductor junction, which may cause serious skin burns.
The only legal restrictions and medical advices available on the web were concerned with infrared emissions of heat lamps or in the welding process. This suggests that IR light as emitted by other IR devices will be harmful, even the low power emitted IR LEDs (ca. 300mW). However, the effect of infrared light projecting for a long time at the naked eye will have a high potential of damaging the eye biological cell structure.
1.3.
Research Aim and Objectives
The development of technologies for detecting or preventing drowsiness at the wheel is a major challenge in the field of accident avoidance systems. Because of the hazard that drowsiness presents on the road, methods need to be developed for counteracting its effects.
The aim of this research is to develop a prototype drowsiness detection system to detect driver drowsiness to warn the driver before driving is impaired. The focus will
be placed on designing a system that will accurately monitor the blink frequency and blink duration of the driver’s eyes in a series of tests in a driving simulator. By monitoring the eyes, it is believed that the symptoms of driver drowsiness can be detected early enough to avoid a car accident. Detection of drowsiness involves a sequence of images of an eye, and the observation of eye blink patterns.
Associated with this research is the development of a method to record image changes to the side of the eye, and to determine the position of the eye sclera region. An image-processing system is developed to assess driver drowsiness by examining eye blink using vision techniques to work with reflections off the eye sclera region involving a detection method to monitor the changes in the eye sclera region. The detection of the white sclera area between the dark upper and lower eye lids is termed blink, and changes of area quantify the length of the blink.
To achieve the aim, this research has the following objectives:
• To investigate two other current methods related to driver drowsiness detection systems: PERCLOS (percentage of eye lid closure) and JTV (Johns’ Test of Vigilance). Discussion of the reliability of these methods will be important for informing the implementation of the new method.
• To design a driving simulator and a driver reaction time measurement system. Driver alertness can be estimated by monitoring the steering wheel movement, brake patterns, vehicle speed or lateral acceleration, and lateral displacement. A basic driving simulator is designed to detect driver performance by monitoring the response of the driver.
• To design a head mounted video camera with low intensity light to illuminate the sclera region of the eye and capture changes of this sclera area relating to blink to identify blink duration and frequency.
• To establish if eye blink frequency and duration are reliable factors to predict driver performance. By measuring the blink frequency and duration in participants in a driving simulator, it will be ascertained how these variables affect driver performance. The effects of sleep deprivation will be examined.
• To create a new operational measure of drowsiness based on eye blink durations and frequency of drowsy drivers, and to establish a driver drowsiness detection metric for future use in the development of drowsiness detection algorithms.
1.4.
Thesis Structure
This thesis is organised in nine chapters, as follows:
Chapter One: This chapter contains a brief review of driver drowsiness as a cause of
road accidents. Three main characteristics were considered in this chapter. The first was the mechanism of human sleepiness and its interrelation to driving risk; the second was the biology of human sleepiness and the third was driver drowsiness detection systems. The section 1.3 in this chapter states the research aim and objectives. Figure 1.1 shows the overview of project structure.
Figure 1-1: Project Overview
Chapter Two: Reviews the literature relating to driver drowsiness detection methods.
This gives a detailed review of current driver drowsiness detection methods, including physiological measures and their effectiveness. It reviews the popular methods used such as eye blink, eye movements and facial expressions. Consideration is also given to other methods of human drowsiness detection and their effectiveness in comparison to eye blink analysis.
PROJECT OVERVIEW CHAPTER
1 CHAPTER 2 &3 CHAPTER 4 & 5 CHAPTER 6 CHAPTER 7 CHAPTER 8& 9 PROJECT OVERVIEW Introduction Detection Systems Methodology Eye Blink Detection System Questionnaire Design Data Analysis Method Results and Validation Review and Conclusions Future Work Detection Methods Driving Simulator Design
Chapter Three: Reviews the literature relating to existing driver drowsiness detection systems. This gives a detailed review of existing driver drowsiness detection systems and their effectiveness. This review focuses mainly ‘In-Vehicle’ systems.
Chapter Four: This chapter introduces the methodology for a new driver drowsiness
detection system, which includes an eye blink detection system, a driving simulator and a subjective drowsiness measure questionnaire. In addition, this chapter briefly describes a new eye blink detection system and the main approach to the experimentation.
Chapter Five: Describes the development of the Eye Blink Detection System
(EBDS). The system tracks eye blinks from the side of the eye. The reliable detection and tracking of eye blink is an important requirement for measurement of eye blink frequency and blink duration in the detecting of driver alertness. Image acquisition and image processing algorithms are used for blink detection. By using a spectacle mounted sensor, the problem of analysis of head movement is minimised. The three-step eye blink detection procedure of background estimation, template matching and tracking is used to analyse eye blink dynamics. Video and image acquisition tools, signal processing tools and data analysis tools in MATLAB Simulink software are used to design the eye blink detection system.
Chapter Six: Discusses the development of a driving simulator. There were two
simulators used to measure driver performance. The first simulator measures driver reaction time and is designed using virtual reality tools in MATLAB Simulink. The second and main simulator measures five different parameters of driver performance.
Chapter Seven: Data Analysis Methodology. This chapter focuses on determining the variables and statistical procedures for data analysis. The physiological measures in this study have been identified as indicators of drowsiness in previous research studies. These measures included two eyelid-closure measures, the average blink duration (AVEBLDU) and average blink frequency (AVEBLFR).
The driving performance measures in this study were operational measures that would be obtainable in the driving simulator. The measures collected during this study included driving-related measures, and secondary task performance measures.
Chapter Eight: Final Data Analysis Results: Development of Driver-Drowsiness
Detection Model. Regression analyses were initially used for data manipulation for all eighteen participants. Several correlation tests were performed with the data in different configurations, including: all participants/all data for one-minute intervals, ten-minute intervals, and five-minute intervals. Analyses were also undertaken after “selecting” participants performance data (this method consists of using data from each participant and categorizing that data into high performance decrement, medium performance decrement, and low performance decrement categories) using a moving average filter.
Correlation tests were performed between the collected physiological measures (standard deviation, SD, of average eye blink durations and frequency) and the collected performance measures (standard deviation, SD, of average deviations from centre line and reaction time for colour light changes). Linear regression analysis was used to develop drowsiness detection model.
Chapter Nine: Summarizes the research outcomes, draws conclusions; discusses further development to improve research results.
1.5.
Summary
The problems of extracting quantified information from physiological and performance indicators of the drowsiness level of a vehicle driver are addressed. An outline has been given of a new approach for processing the physiological and performance outputs from a driver drowsiness monitoring system. The performance indicators are collected from the driving simulator (e.g. lateral movements of a vehicle (deviations from centre line), average speed, and reaction time for traffic signal). New results show how the physiological and performance indicators can be used to detect drowsiness. The development of new system for detection of driver drowsiness linked to impairment of driving performance is discussed in the following chapters.
The next chapter reviews the literature relating to driver drowsiness and detection methods. This gives a detailed assessment of current driver drowsiness detection methods, including physiological measures and their effectiveness.
2.
CHAPTER 2
REVIEW OF THE LITERATURE ON THE PHYSIOLOGY OF
DRIVER DROWSINESS
2.1.
Introduction
This literature review provides background information regarding driver drowsiness analysis methods. Current countermeasures to minimize drowsiness in car driver drowsiness are reviewed. In order to develop a new concept, it is important that the principles of current driver warning systems be reviewed and understood. Research papers concerning driver drowsiness detection systems and their effectiveness are discussed. Furthermore, the methods relating to eye blink analysis for human drowsiness detection and their effectiveness are reviewed.
2.2.
Driver Drowsiness
Drowsiness represents a significant social and economic cost to the community in relation to road crashes, especially motorway crashes. Drowsiness-related crashes are often more severe than other crashes as drivers’ reaction times are often delayed or drivers have not engaged any crash avoidance manoeuvres. Furthermore, it is difficult to quantify the level of driver drowsiness due to the difficulties in objectively measuring the degree of drowsiness following a crash. Lack of sleep reduces the alertness and concentration needed for safe driving. The quality of decision-making may also be affected (van den Berg et al., 2005).
2.3.
Driver Drowsiness and Road Accidents
There are difficulties in determining the level of sleep related accidents because there is no simple, reliable way for an investigation to determine whether drowsiness was a factor in the accident and, if it was, what level of drowsiness the driver was suffering. This result in varying estimates of the level of sleep related accidents and,
in particular, evidence based on accident reports usually produces lower estimated levels than research based on in-depth studies.
A British study by the Sleep Research Centre (Horne and Reyner, 2000) indicated that driver drowsiness causes up to 20% of accidents on motorways. This suggests that there are several thousand casualties each year in sleep related accidents. An earlier study (Horne and Reyner, 1995) on road accidents between 1987 and 1992 found that sleep related accidents comprised 16% of all road accidents, and 23% of accidents on motorways. Transport Research Laboratory (TRL) research (Maycock, 1995) found slightly lower proportions of sleep related accidents: 9% - 10% of accidents on all roads, and 15% of accidents on motorways involved driver sleepiness. In this study, 29% of drivers reported having felt close to falling asleep at the wheel at least once in the previous twelve months.
The National Highway Traffic Safety Administration (NHTSA) estimated that there are 56,000 sleep related road crashes annually in the USA, resulting in 40,000 injuries and 1,550 fatalities (NCSDR/NHSTA, 1998). Another study (Johnson, 1998) calculated that 17% (about 1 million) of road accidents are sleep related. Research by Wang (1996) suggested that 2.6% of accidents caused by driver inattention were due to drowsiness. Reissman, (1996) studied road accidents on two of America’s busiest roads and found that 50% of fatal accidents on those roads were drowsiness related and 30% - 40% of accidents involving heavy trucks were caused by driver sleepiness. In summary, research in many countries around the world has shown that sleep related accidents constitute a significant proportion of road accidents.
2.4.
Defining Drowsiness
The phenomenon of drowsiness is a highly researched participant, but does not have a universally accepted definition. The term drowsiness is a condition characterized by a lessened capacity for work and reduced efficiency of accomplishment, usually accompanied by a feeling of weariness and tiredness (Engleman et al., 1997). Using this definition, the involvement of drowsiness in a road crash can range from falling asleep at the wheel to inattention (HORSCC, 2000).
The general consensus is that the four main determinants of driver drowsiness are:
Lack of sleep
Time of day
Time spent performing a task (Hartley, et al., 2000; Williamson, et al., 2000).
Type of driver
Individual factors such as age, physical fitness and medical condition also affect the incidence of drowsiness (HORSCC, 2000).
2.4.1.
Lack of Sleep
Human beings need to sleep. Sleep is essential for everyone. The longer someone remains awake, the more difficult it is to resist falling asleep. The need for sleep varies between individuals, but sleeping for 8 out of 24 hours is common, and 7 to 9 hours sleep is required to optimise performance (Reichman et al., 1996).
Humans are usually awake during daylight and asleep during darkness. Sleeping less than four hours per night impairs performance. Sleepiness reduces reaction time, which is a critical element of safe driving. Lack of sleep reduces the alertness and concentration needed for safe driving. The quality of decision-making may also be affected (van den Berg et al., 2005).
2.4.2.
The Time of Day
Humans possess a neurobiological based sleep-wake cycle called a circadian rhythm or body clock (Folkard, 1997). Research has shown that there are two periods during the 24 hour circadian cycle where the level of sleepiness is high. The first period is during the night and early morning, and the second is in the afternoon (Hartley et al, 2000). During these periods of sleepiness, many functions (e.g., alertness, performance and subjective mood) are degraded (Rosekind, 1999).
Sleep related accidents have peaks in the early hours of the morning, between 2.00 am and 6.00 am, and mid afternoon, between 3.00 pm and 4.00 pm. Drivers are 50 times more likely to fall asleep at the wheel at 2.00 am than at 10.00 am (Horne and Reyner, 1995). This risk is three times as great between 3.00 and 4.00 pm as at 10.00 am. Horne and Reyner’s studies identified that young drivers are more likely to sleep at the wheel in the early hours in the morning and older drivers are more likely to fall asleep at the wheel during the afternoon sleep period.
The long sleep-wake cycles are the result of variable insensitivity to the sleep drive. In one study, randomly selected volunteers spent seventy-two hours without sleep and rated their drowsiness every three hours on a scale in comparison with their normal drowsiness (=100 percent) (BOSB, 1997). The feeling of drowsiness was
always highest in the early hours of the morning and lowest in the afternoon (Figure 2-1).
Figure 2-1: Fatigue during seventy-two hours of sleep deprivation (BOSB, 1997)
Figure 2-2: Time required falling asleep (BOSB, 1997)
Figure 2-2 shows the time required to fall asleep during the day, after long sleep, normal sleep, and a sleepless night. The participants lie down at two-hour intervals between 9:30 a.m. and 7:30 p.m. The amount of time required to fall asleep is used
as a measure of sleep propensity. After an extended sleep during the preceding night, the participants take a longer time to fall asleep; after a night without sleep, the time is greatly reduced.
2.4.3.
Time on Task
Prolonged physical activity without rest leads to muscular drowsiness. Similarly, a prolonged mental workload without rest will lead to reduced alertness and disinclination to continue the effort (Grandjean et al., 1988).
Research based on driving tasks has shown that the length of time on a task affects performance. As time spent on a task is increased, the level of drowsiness is increased, reaction time is slowed, vigilance and judgement is reduced and the probability of falling asleep during the task is increased (Engleman et al, 1997; HORSCC, 2000).
2.4.4.
Type of Driver
Several studies have identified young male drivers, aged less than 30 years, as one of the groups most at risk of being involved in sleep related road accidents (Maycock, 1995). In addition, company car drivers have a higher probability of falling asleep at the wheel as they tend to drive long distances on tight schedules (Hackett et al., 2003). In addition, shift workers and people with sleep problems are also in the risk group. The close environment of the inside of a car and loss of air flow and low oxygen rate also increase the tendency to sleep (Garder & Alexander 1994).
2.5.
Physiological Measures Related to Driver Drowsiness
Detection
The purpose of this section is to discuss measures that may lead to detect driver drowsiness and their operational definition. In this thesis drowsiness and sleepiness are considered synonymous, but the term drowsiness will be used. Another concept commonly used is drowsiness, which is an extreme tiredness that results from physical or mental activity. Drowsiness can also be described by the grade of wakefulness or vigilance. Wakefulness is the same as alertness or state of sleep inability, whereas vigilance can be described as watchfulness or a state where one is prepared for something to happen (Leproult et al., 2003).
2.5.1.
Eyelid Closure
Eyelid closure is a very reliable predictor of driver drowsiness (Erwin, et al., 1980; Dinges, et al., 1985). Erwin et al, examined various measures to determine if they were predictive of sleep onsets, including plethysmography (a device for measuring and recording changes in the volume of the body or of a body part or organ), respiration rate, Electroencephalography (EEG), skin electrical characteristics, Electromyography (EMG), heart rate variability, and eyelid closure. It was found that eyelid closure was the most reliable predictor of the onset of sleep among the measures examined.
Eyelid closure is indicative of sleep onset and undoubtedly the cause of poor performance in visual tasks, especially tracking tasks such as driving. It seems quite obvious that if a driver’s eyelids are closed, the ability to operate a vehicle would be impaired. Skipper et al. (1984) examined the ability of sleep deprived drivers to
perform a one and one half hour driving task. Various disturbances were purposely input into the steering system of the driving simulator to mimic on-the-road conditions. It was found that performance measures such as lane deviation and steering velocity were highly correlated with eyelid closures. The apparatus used to capture eyelid closures in the studies by Skipper et al, (1984) was a low-light level camera. A linear potentiometer was used manually by an experimenter to track and record the eyelid movement of the participants.
2.5.2.
Eye Movements
There are two general methods used to record eye movements during sleep or before sleep. The first method is Rapid Eye Movements (REMs). The second is based on the onset of sleep in most participants being accompanied by slow, rolling eye movements (Carskadon, 1980). Slow, rolling eye movements may accompany the onset of sleep or are precursors of sleep onsets. This phenomenon also occurs with the transition to stage 1 sleep during the night. The characteristics of human eye movements change greatly with alertness level. Slow eye movements (SEMs) prove to be one of the most characteristic signs of the phase of transition between wakefulness and sleep (Planque et al., 1991). A completely awake individual can be observed as having quick eye movements. As participants become drowsy, their eyes move in a pendulum motion from left to right (Hiroshige and Niyata, 1990) and the number of quick, voluntary movements of the eyes begins to lessen. Several SEMs are detected during stage 1 sleep, but they also appear during the long period separating waking from sleep. Convergence of the eyes is also possible when a person becomes drowsy.
Electrooculography (EOG) Figure 2-3 (page 50) shows the measuring of eye movements via electrodes in contact with the skin surrounding the eyes. The process of measuring eye movements with EOG is quite simple due to the electrical nature of the human body. In the eyeball, there is a small electro-potential difference from the front to the back. The front (cornea) of the eye is positive with respect to the back (retina) of the eye. Before a certain point in a person’s awake but drowsy state, SEMs do not exist. However, after a particular moment in the onset of sleep, slow, rolling, lateral, ocular movements create sinusoidal activity in the EOG (Lairy and Salzarulo, 1974). On the EOG signal, the SEMs are translated by slow deflections lasting more than a second. It is likely that amplitudes of at least 100 microvolts will be seen (Torsvall and Akerstedt, 1988). The EOG waves that are normally observed are moderate in amplitude initially, but increase with the degree of drowsiness (Planque et al., 1991). These researchers found that after several minutes of driving only blinking and glances at simulator instrumentation were recorded. Approximately 30 minutes into the study deterioration of deliberate eye movement was observed. Planque et al. (1991) argue that, by analyzing the EOG, it is possible to follow clearly the deterioration of alertness.
2.5.3.
Muscle Activity
The Electromyogram (EMG), conventionally abbreviated as "EMG" is a record of the electrical activity which emanates from active muscles, especially in the facial muscles. It may also be recorded from electrodes on the skin surface overlying a muscle. In humans, the EMG is typically recorded from under the chin, since muscles in this area show very dramatic changes associated with the sleep stages (BOSB, 1997). Hauri (1982) demonstrates that EMG recorded on the chin steadily,
though not dramatically, decreases as a person nears sleep. Even when a person is totally relaxed, small muscle potentials will be seen. This is because every muscle is composed of many contractile fibres that are innervated by nerves. When a muscle fibre is activated through nerve innervations, a change in the electrical potential is seen. When the muscle is relaxed, fewer nerves discharge, thus a smaller EMG potential is recorded. EMG (figure 2-3) is used to predict drowsiness with electrical potential differences of facial muscle.
2.5.4.
Brain Wave Activity
The Electroencephalogram (EEG) is conventionally abbreviated as "EEG" and is popularly known as "brain waves." The EEG was discovered in 1929 by Hans Berger, a Swiss psychiatrist. He found that small changes in voltage between two electrodes occurred when they were placed in contact with the scalp. Voltage changes are amplified and examined for variations in duration. The exact physiologic basis of the voltage variations are not entirely known, but it is believed that they originate largely from changes in voltage of the membranes of nerve cells. Erwin, et al. (1980) found that there is no reliable alteration in background brain activity prior to eyelid closure. Upon eyelid closure, the researchers found that a very rapid shift in brain wave patterns takes place. This shift is identifiable as the early stage of sleep. However, Planque et al. (1991) argue that sharp changes in the frequency content of brain wave activity are observed during the crossing from alertness to a stage of hypoalertness, then to drowsiness, and finally to sleep. A slowdown of the brain activity in general, an increase in the percentage of alpha waves and, in turn, a decrease in the percentage of beta waves, is observed at the same time that a decline in performance is seen.