Direktorium: Leibniz-Rechenzentrum Telefon: +49 89 35831 - 8000 E-Mail: [email protected] Prof. Dr. A. Bode (Vorsitzender), Prof. Dr. H.-J.
Bungartz
Boltzmannstraße 1 Telefax: +49 89 35831 - 9700 Internet: www.lrz.de Prof. Dr. H.- G. Hegering, Prof. Dr. D. Kranzlmüller 85748 Garching b.München USt-IdNr.: DE811335517
Technical Report
Knowledge-based Performance Monitoring
for Large Scale HPC Architectures
Carla Beatriz Guillen Carias
Vollständiger Abdruck der von der Fakultät für Informatik der Technischen Universität München zur Erlangung des Akademischen
Grades eines Doktors der Naturwissenschaften (Dr. rer. nat.) genehmigten Dissertation.
UNIVERSIT ¨
AT M ¨
UNCHEN
Institut f¨
ur Informatik
Lehrstuhl f¨
ur Rechnertechnik und Rechnerorganisation
Knowledge-based Performance Monitoring
for Large Scale HPC Architectures
Carla Beatriz Guill´
en Car´ıas
Vollst¨
andiger Abdruck der von der Fakult¨
at f¨
ur Informatik der
Technischen Universit¨
at M¨
unchen zur Erlangung des Akademischen
Grades eines
Doktors der Naturwissenschaften (Dr. rer. nat.)
genehmigten Dissertation.
Vorsitzender: Univ.-Prof. Dr. Thomas Huckle
Pr¨ufer der Dissertation: 1. Univ.-Prof. Dr. Hans Michael Gerndt 2. Univ.-Prof. Dr. Dieter Kranzlm¨uller
Ludwig-Maximilians-Universit¨at M¨unchen Die Dissertation wurde am 02.02.2015 bei der Technischen Universit¨at M¨unchen
Firstly, I would like to thank the people who were directly involved in helping me with my the-sis. Without them this dissertation wouldn’t have been possible. Special thanks to Professor Michael Gerndt for the mentoring of this dissertation and his valuable support. He provided not only guidance on this thesis but equally supported me on another research project. I would like to express my gratitude to Professor Dieter Kranzlm¨ueller for his time reviewing my thesis. I am also indebted to Professor Arndt Bode for reading and providing comments to this docu-ment.
I would like to express my infinite gratitude to Dr. Matthias Brehm for providing insightful guidance on performance analysis and so much help in many other issues. Special thanks also to Dr. Wolfram Hesse who worked with me three years programming, provided support and advice in statistical matters, and helped me also in several other concerns. Many thanks to Jeanette Wilde, Dr. Sandra Mendez, Dr. Helmut Satzger, Dr. Nicolay Hammer, and Dr. Carmen Navarrete. They provided their generous help in many issues, like proof reading, translations, help with LATEX, image processing, fruitful discussions, etc. I am grateful to the four students
for parts of the implementation: Sebastian Schweiger, and the 3B gang: Benno Willoweit, Ben-jamin Degenhart, and Bernhard B¨ucherl.
I owe a debt of gratitude to Conny Wendler, who helped by taking over the workload of user ad-ministration to let me program and write this thesis and for being a great office mate. Thanks to all the colleagues in the Application Support Group who contributed in one way or another and for a great teamwork. Thanks to Sabine Linner-P¨offinger, who helped me with the printing of the thesis with dedicated attention. Thanks to many of the colleagues in the High Performance Computing department, especially the system administrators: Dr. Hans-Georg Kleinhenz, Jo-hann Dobler, Dr. Markus Michael M¨uller, and Dr. Alexander Block.
I would like to thank my family and friends. Without them I wouldn’t have even been able to start this work. Special thanks to my dear parents and my dear sister for their never ending affection, support, and for motivating me until the end. Special thanks to my boyfriend Julius for his loving care and support in writing the thesis.
If I forgot to mention someone who should have been here, I apologize to him/her.
This work was developed while being a scientific employee at the Leibniz Supercomputing Centre of the Bavarian Academy of Sciences and Humanities, an institution to which I am very grateful for providing me the unique opportunity to research in the field of HPC.
Carla Guill´en Garching, Germany October 2014
This thesis presents concepts for system wide monitoring and performance analysis of super-computers. They aim at detecting inefficiencies of running applications that are responsible for suboptimal use of HPC systems.
Massive parallel applications which run inefficiently on a supercomputer will block the use of the system and decrease the throughput of applications. The improvements in productivity of numerical simulations are typically conducted with performance analysis tools. In order to have an overview of all the applications that run on a supercomputer, the detection of applications with bottlenecks requires to be conducted automatically, on-line, and with a low time overhead. However, there is a lack of tools that provide on-line analysis without a significant overhead and without instrumentation of user codes for the collection of data on a systemwide basis. In order to achieve a scalable systemwide monitoring with acceptable overhead, methods and algorithms have been developed and implemented in the PerSyst Tool. On-line analyses are performed with codified expert knowledge on strategy maps which are designed to reveal bot-tlenecks in an application. A strategy map is comprised of a tree-like structure whose nodes analyze and classify the monitored data. Scalability is achieved in the PerSyst Tool with a hier-archical distributed software architecture: a tree of agents which can operate autonomously and run continuously to measure, analyze, filter, and collect performance data. The architecture is designed to optimize the collection route and minimize the usage of the network interconnect. The performance data is reduced by using two main approaches. Firstly, depending on the resulting analysis the strategy maps determines to collect or discard performance data. Sec-ondly, descriptive qualities of performance data are retained by using quantiles which largely reduce the raw data. Even though, quantiles provide a scalable solution by reducing data, the aggregations in the context of a hierarchy of agents can’t be performed with exact calculations at all levels of the agent tree. To reduce the need for estimating quantiles, the mapping of performance data to agents is optimized which enables the precise calculation of quantiles as opposed to quantile estimation.
The concepts for scalable system-wide performance analysis were implemented in the PerSyst Tool and applied to three supercomputers with a different microarchitecture. Detailed results are provided for the Petaflop system SuperMUC, the largest of the three systems, at the Leibniz Supercomputing Centre.
In der vorliegenden Arbeit wurden Konzepte f¨ur ein systemweites Monitoring mit integrierter Leistung-Analyse f¨ur Hochleistungsrechner realisiert, um ineffizient laufende Applikationen zu detektieren.
Ineffizient laufende massiv parallele Applikationen blockieren unn¨otigerweise große Teile des Systems und reduzieren den gesamt Durchsatz an Anwendungsprogrammen. Die Produk-tivit¨at numerischer Simulationen l¨asst sich durch Leistungsanalysewerkzeuge erh¨ohen. Um einen ¨Uberblick ¨uber das Leistungsverhalten aller auf einem HPC-System laufenden Anwen-dungen zu bekommen, muss eine ¨Uberwachung und die anschließende Analyse automatisch, online, und mit geringem Zeit-Overhead erfolgen. Allerdings fehlen bisher Werkzeuge f¨ur eine systemweite Sammlung von Performance-Daten, in denen Online-Analysen ohne signifikanten Overhead, und ohne Benutzercode-Instrumentierung m¨oglich sind.
Um ein solches skalierbares systemweites Monitoring mit akzeptablen Overhead zu realisieren wurden entsprechende Methoden und Algorithmen entwickelt und im Rahmen der vorliegenden Arbeit ein Performance-Werkzeug namens PerSyst Tool entwickelt. Online-Analysen erfolgen mit sogenannten Strategy-Maps, in denen Expertenwissen f¨ur die Aufdeckung von Bottlenecks in einer Anwendung kodiert ist. Eine Strategy-Map stellt eine baum¨ahnliche Struktur dar, deren Knoten die Daten analysieren und klassifisieren. Die Skalierbarkeit des PerSyst-Tools wird durch eine hierarchisch verteilte Architektur erreicht, d.h. einem Baum bestehend aus Agenten, die autonom operieren k¨onnen und dabei kontinuierlich Performance-Daten messen, analysieren, filtern und sammeln. Die Architektur ist so aufgebaut, dass die Netzwerkbelas-tung durch das Sammeln der Daten optimal ist. Eine Reduktion der Performance-Daten wird mit zwei Hauptmethoden erreicht: Erstens wird mittels der Strategie-Maps entschieden, welche Performance-Daten gesammelt oder verworfen werden k¨onnen. Zweitens und entscheidender f¨ur die Datenreduktion ist die Verwendung von Quantilen, die die qualitativen und statistis-chen Eigenschaften der Verteilung der Performance-Daten erhalten. Die Quantil-Berechnungen wirken sich vorteilhaft hinsichtlich der Skalierung des Tools aus, wobei bei der Aggregation ent-lang des Agenten-Hierarchiebaums die exakte Berechnung der Quantile nicht auf allen Ebenen des Baums m¨oglich ist und eine Sch¨atzmethode verwendet wird, die die statistischen Eigen-schaften erh¨alt. Eine optimierte Verteilung der Daten im Baum erm¨oglicht in den meisten F¨allen die genaue Berechnung der Quantile. Die im PerSyst-Tool implementierten Konzepte wurden auf drei Supercomputer mit verschiedenen Microarchitekturen portiert und evaluiert. Detaillierte Ergebnisse wurden in dieser Arbeit f¨ur das Petaflop-System SuperMUC des Leibniz-Rechenzentrums dargestellt.
Acknowledgments i
Abstract v
List of Figures x
List of Tables xi
List of Listings xiii
List of Algorithms xv
1 Introduction 1
1.1 Motivation . . . 2
1.2 Performance Analysis and Design Objectives . . . 4
1.3 Structure of the Thesis . . . 6
2 Approaches To Performance Monitoring 7 2.1 Existing Approaches and Tools for Performance Monitoring . . . 7
2.2 State of the art . . . 9
3 Execution Properties and Strategies 15 3.1 Strategies for Monitoring and Analysis . . . 16
3.2 Execution Properties . . . 33
3.3 Properties for the Westmere-EX Architecture . . . 38
3.4 Properties for the Sandy Bridge-EP Architecture . . . 51
3.5 Architecture independent Properties . . . 63
4 Functionality of the PerSyst Tool 69 4.1 Agent Hierarchy . . . 69
4.2 Agent Functionality . . . 70
4.3 Communication Interaction . . . 73
4.4 Cycles and Time Control . . . 75
4.5 Failure Recovery . . . 77
5 Statistical Aggregation of Performance Data 81 5.1 Aggregation Using Quantiles . . . 81
5.2 Percentile Estimation . . . 84
5.3 Data Collection . . . 86
6 Portability and Adaptability 93 6.1 Framework and Abstract Classes . . . 93
7 Context of Evaluation and Results 103
7.1 Context of Evaluation . . . 103
7.2 Portability . . . 104
7.3 Scalability Tests . . . 105
7.4 Results of the Transport System in SuperMUC . . . 107
7.5 Quality of Quantile Estimation . . . 111
7.6 Validations of Performance Measurements . . . 111
7.7 Selection of Thresholds . . . 127
7.8 Use cases of the PerSyst Tool . . . 130
8 Conclusions and Outlook 133 8.1 Conclusions . . . 134
8.2 Outlook . . . 136
A Visualization 137
B Glossary 141
1.1 Optimization roadmap. . . 3
3.1 Memory bandwidth Strategy map . . . 17
3.2 Memory bound code Strategy map . . . 18
3.3 Compute bound code Strategy map . . . 21
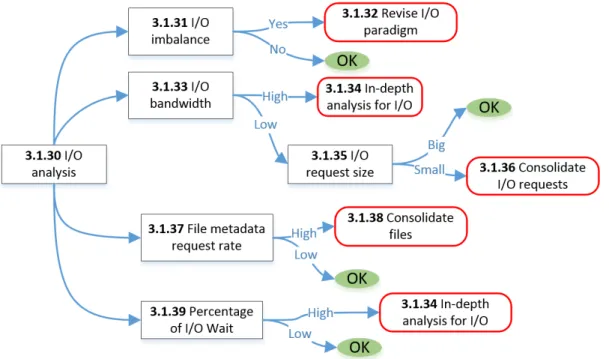
3.4 I/O Strategy Map . . . 26
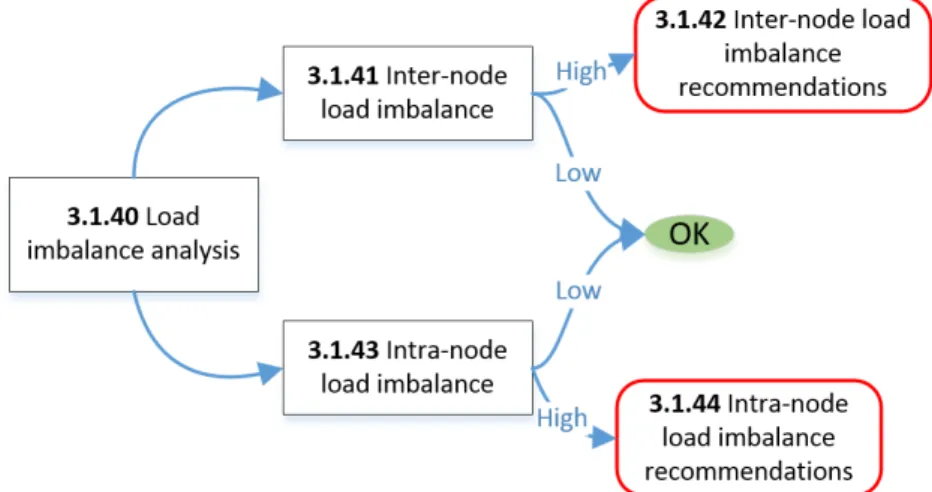
3.5 Imbalance Strategy Map . . . 29
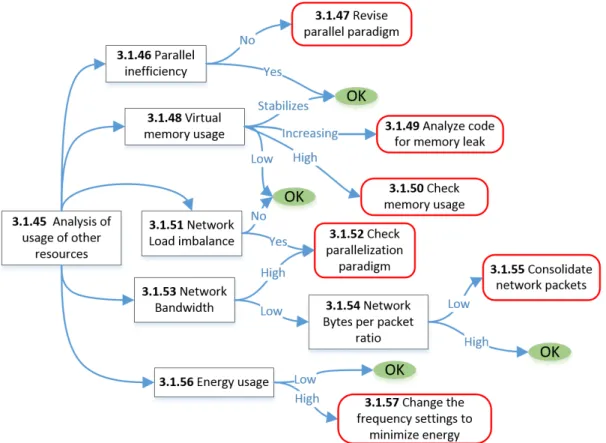
3.6 Other Resources Strategy Map . . . 30
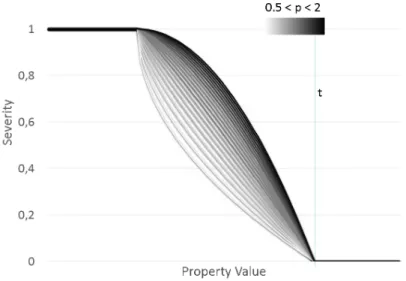
3.7 Severity formula FORMULA1. . . 36
3.8 Severity formula FORMULA2. . . 36
3.9 Westmere-EX Architecture . . . 39
3.10 Pipeline with hyperthreading technology. . . 39
3.11 Detecting load imbalance with hardware counters . . . 43
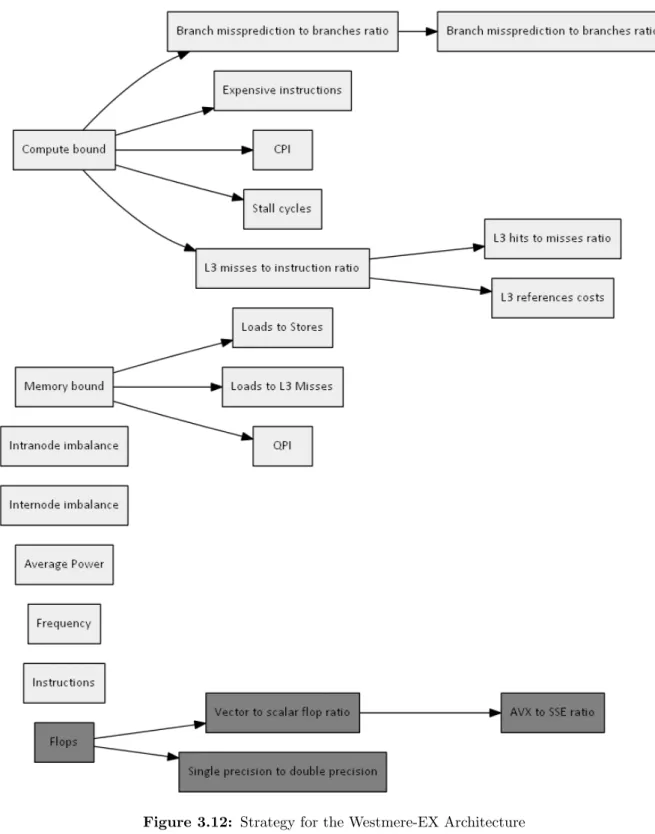
3.12 Strategy for the Westmere-EX Architecture. . . 50
3.13 Sandy Bridge-EP Architecture. . . 51
3.14 Strategy for the Sandy Bridge-EP Architecture . . . 62
3.15 Strategy for architecture independent properties . . . 68
4.1 Agent Hierarchy . . . 69
5.1 Approximation of a population with uniform distribution . . . 85
5.2 Examples of the tree distances between nodes . . . 88
5.3 Example of retrieval of Properties . . . 91
6.1 PerSyst Agent Framework . . . 94
6.2 Tool parallelization within PerSyst Agent . . . 96
7.1 Scalability for job information transmission . . . 106
7.2 Scalability of command transmission . . . 106
7.3 Evaluation of Quantile Estimation . . . 112
7.4 Validation of Flops/s in Westmere-EX. . . 113
7.5 Memory Bandwidth with STREAM and the LIKWID interface. . . 114
7.6 Validation of L3 Bandwidth in Sandy Bridge-EP . . . 114
7.7 Validation of instruction count using the LIKWID interface of the PerSyst Tool. 115 7.8 ATS load imbalance distribution pattern . . . 116
7.9 Validation of intra-node imbalance . . . 117
7.10 Validation of inter-node imbalance property . . . 118
7.11 Validation of inter-node imbalance for Sandy Bridge-EP . . . 118
7.12 Expensive instruction validation with the LIKWID interface . . . 119
7.13 Validation of loads using the LIKWID interface with the PerSyst Tool . . . 120
7.15 Validation of branches using the LIKWID interface with the PerSyst Tool . . . . 121
7.16 Validation of misspredicted instructions for Sandy Bridge-EP . . . 123
7.17 Validation of I/O Bytes per operation . . . 124
7.18 Validation of I/O per open and per close operation . . . 125
7.19 Validation of memory usage . . . 126
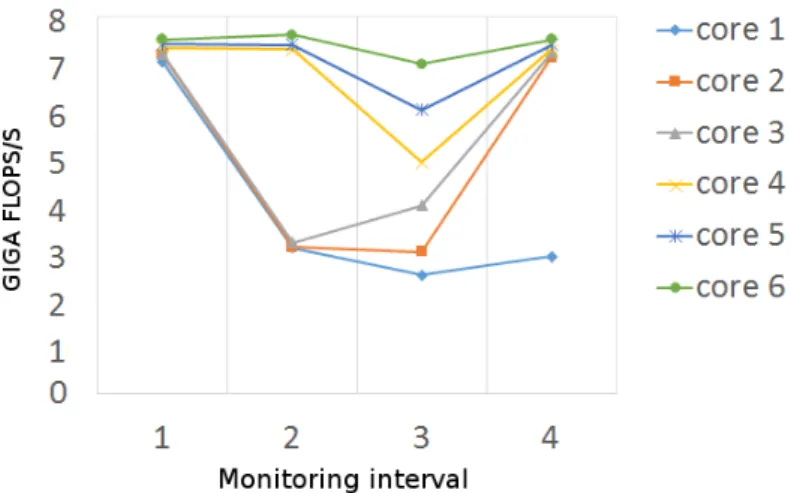
7.20 Application with bottleneck: Floating point operations/s . . . 130
7.21 Comprehensive view of system usage . . . 131
A.1 View of Average Severity for Several Jobs . . . 138
A.2 View of Severity for a Single Job in a Timeline . . . 139
2.1 Examples of performance tools and libraries for performance monitoring and
performance analysis . . . 7
2.2 Taxonomy of performance tools and libraries according to level of monitoring . . 8
2.3 Taxonomy of tools and libraries according to instrumention . . . 8
3.1 Westmere-EX: Cache latencies . . . 47
3.2 Sandy Bridge-EP: Cache latencies . . . 52
4.1 Times for cycle control . . . 76
7.1 Measuring tools used . . . 105
7.2 Scalability of the tool in SuperMUC . . . 107
7.3 Total time and number of Agents . . . 107
7.4 Times for cycle control . . . 108
7.5 Distribution of performance data in agent tree . . . 108
7.6 Usage of the topology network . . . 109
7.7 Collection time in Collector Agents . . . 109
7.8 Amount of collected data in SuperMUC . . . 110
7.9 Set frequency compared to measured frequency. . . 123
7.10 Average memory bandwidth from STREAM . . . 127
7.11 I/O Thresholds . . . 128
7.12 Thresholds and how they are selected . . . 129
3.1 Abstract Property Class . . . 34
6.1 Abstract Class Tool . . . 95
6.2 Abstract Class Strategy . . . 96
6.3 Abstract Class HPCSystem . . . 98
6.4 Abstract Class HPCSystemCollector . . . 99
6.5 Abstract Class HPCSystemSync . . . 100
7.1 Triad used for measuring flops . . . 113
7.2 Kernel for measuring number of instructions . . . 114
7.3 Assembler code for measuring the number of instructions . . . 115
7.4 ATS do work kernel modifications . . . 116
7.5 Kernel for expensive instructions . . . 119
7.6 Assembler code for measuring number of instructions . . . 119
1 Algorithm to distribute job’s properties to collectors. . . 87 2 Algorithm to distribute performance data load to several collectors. . . 89 3 Algorithm to find Collector with minimum load and minimum tree distance. . . . 90
1
Introduction
High performance computing is an instrument for the sciences for performing numerical simu-lations. By conducting numerical simulations in large HPC architectures, scientific results can be obtained without the expenses of prototyping or even perform experiments which are not possible in real life. Even though HPC systems are significantly less costly than real experimen-tation, they still are expensive resources. Massive parallel applications which run inefficiently on a supercomputer will block the use of the system and thus prevent it from producing more scientific results compared to an efficient usage of the supercomputer. Optimizations of numer-ical simulations are typnumer-ically conducted with the aid of performance analysis tools. There are more than 20 thousand application runs per month in a petaflop supercomputer 1. In order to have an overview of the applications, the detection of applications with bottlenecks requires to be conducted automatically and with low time overheads. However, there is a lack of tools that provide on-line analysis without a significant overhead and without instrumentation of user codes for a collection of data on a systemwide basis.
This thesis presents a hierarchical analysis of performance characteristics of parallel applications to detect inefficiencies. Along with this analysis, the design characteristics, implementation, and validation of a systemwide performance monitoring and analysis tool, hereafter PerSyst Tool, for high performance computing systems are also described. The PerSyst Tool analyzes and monitors at application level as well as system level with negligible overhead.
The tool has been implemented, by design, in a hierarchy of software components, calledagents, to collect and analyze monitoring information. The tree-like hierarchy ensures scalability in all aspects of the tool, especially the scalability for measuring the data synchronously. The tool performs analysis by including expert knowledge on performance patterns with decision trees to determine the analysis path.
A distinct feature of the tool is that it uses information of the placement of running applica-tions in order to perform a balancing of the monitored data in the collecting components. The optimized distribution of the data to the components reduces significantly the communication network usage such that the network is only used partially. This ensures that the traffic in the network is minimized in order to avoid a congestion of the system’s network with performance
1This information was taken from the statistical data collected at the Leibniz Supercomputer Centre. See
data.
The tool supports a time based sampling rationale. It, therefore, does not require any instrumen-tation of code regions. The measurements are performed cyclically at equally spaced intervals. Monitoring information at a certain point in time, just like in a snapshot, is a possibility which can be used to monitor metrics such as instant CPU load. The collected data is always linked to the start of the measurement, also referred to as the timestamp. The monitoring tool has no other information of the running code except for the job that runs on the devices which are being monitored and the timestamp.
A limitation of monitoring without instrumentation is that performance data can not be re-lated to the source code. Thus, no detailed analysis can be made to localize and optimize the bottleneck. The only available information are those provided by the batch scheduler.
The amount of raw performance data is reduced by applying filtering of information and ag-gregation at the level of the job. Agag-gregation is performed by calculating or estimating a fixed and defined amount of quantiles (like quartiles, deciles, or percentiles) of the observations. This allows the tool to retain the distribution of the observations without knowledge of the available data, while keeping the quality of the information.
The measured performance data is analyzed and classified before it is sent through the trans-port system of agents. The analysis is done with predefined decision trees, called strategies. The strategies are composed of performance analysis objects, or execution properties, that in-corporate thresholds. The concept of a hierarchical analysis of performance characteristics with strategies and properties has been adapted for systemwide monitoring and is part of the perfor-mance analysis and autotuning tool Periscope [74]. Once an inefficiency is found, the analysis renders into assessment on performance issues and guidelines on how to handle the detected symptoms. Recommendations for the removal of the detected bottlenecks are not part of the tool’s transport system but appear as a result of registered properties that are shown in the visualization.
The experience acquired in the design, development, and deployment of such a system in three high performance systems in user operation is presented in this document. The analysis with strategy maps was implemented on two architecures (the first system had a simpler monitoring and analysis of data). Detailed results are provided for the Petaflop system SuperMUC at the Leibniz Supercomputing Centre.
1.1 Motivation
Large parallel systems which are built with general purpose processors are used mainly for simulations in a variety of scientific fields (examples, as reported by the TOP500 organiza-tion [85], are: meteorology, automotive, aerospace, geophysics, chemistry, finance, and research on semiconductor). Algorithms differ widely among the fields of science which are being tested in a supercomputer. At the Leibniz Supercomputing Centre resources of the SuperMUC sys-tem are employed mostly for astrophysics, computational fluid dynamics, physics, life sciences,
chemistry, geophysics, high energy and particle physics, and solid state physics. SuperMUC is a Tier-0 system which started as the fourth fastest HPC system on the TOP500 [86] list in 2012 (with more than 3 Petaflops) and currently remains on this list among the top 12 fastest supercomputers. It comprises 148,608 Intel Sandy Bridge-EP and 8,200 Intel Westmere-EX cores. The HPC activities are promoted by the Bavarian Academy of Sciences and Humanities (BAdW), the Gauss Centre for Supercomputing, GCS, and the Kompetenznetzwerk fuer Wis-senschaftliches Hoechstleistungsrechnen in Bayern, KONWIHR. Scientists all over Europe have access to SuperMUC via the Partnership for Advanced Supercomputing in Europe, PRACE. High performance systems in the order of petaflops are expensive resources, so special attention is given in maximizing the throughput of applications running on them. Inefficient applications running on a system will decrease this throughput and can block the system from running other applications which, in turn, hampers the users in obtaining more scientific results in a given period of time. A general roadmap has been identified [14] that strives to increase the efficient use of a supercomputer, the necessary steps are shown in Figure 1.1. The detection phase will reveal the codes which are running inefficiently on a supercomputer. This phase has two steps, the performance measurement and analysis. Once a code with performance problems has been identified, the subsequent phase strives to obtain an optimized code (the optimization effort phase). The analysis step can provide recommendations on how to do a detailed search or how to perform an optimization.
Figure 1.1: Optimization roadmap for applications running on a HPC System.
Detection phase
Monitoring (performance measurement) and automatically analyzing the performance of user codes in order to detect inefficient applications are the preliminary steps to identifying inefficien-cies and improving the time-to-solution of codes. Although there are several tools (more than 15 tools/libraries are presented in the next chapter) that provide detailed analysis of performance on codes, these require user involvement. The users need to know how to optimize when a tool indicates that there is a part of the code which has bottlenecks, and they need some knowledge on architectural specific optimizations. Additionally, many of the tools require instrumentation which intrinsically adds time overhead which is at least proportional to the number of instru-mented locations [9, 63, 116]. The overhead can drastically grow if the instrumentation is done incorrectly or if the overhead affects individual threads or processes in synchronized communi-cation [67, 68] generating an incremental impact on the overall runtime. Problems may arise at the time of instrumenting or when running an instrumented code: a change of cache behaviour; the instrumentation interacts with the optimization of the compiler; and runtime overhead [29].
Also, users require additional education on the handling of these tools. A preliminary detection of inefficient codes does not require a detailed analysis like the one provided by tools which use instrumented code regions. Given the potential disadvantages that instrumentation brings, application instrumentation has not been considered in this thesis.
Optimization effort
A part of the next step in the roadmap of the optimization endeavour is to provide recommen-dations, which result from the preliminary analysis. The analysis for detection suggests which changes could be done to optimize a code. Thus, the application developers with bottlenecks in their codes can be given recommendations of optimizations from a first diagnosis.
Detailed analysis is already provided by several tools and optimizations can be done manually or with other automatic tuning tools, so this part of the roadmap is not covered in this dissertation. Additional system performance information
A by-product of the gathered data is to have a systemwide overview on how an entire HPC system is being utilized. It is important, for instance, to see the percentage of the peak per-formance as a whole, measured through the use of the floating point operations per second, to compare its usage with other supercomputers. This motivates a synchronized measurement of the performance among applications and across idle nodes. The data can be used in the decision making of procurement of new systems.
1.2 Performance Analysis and Design Objectives
The functionality of the PerSyst Tool enables the monitoring and on-line analysis of the per-formance of all the applications running in a supercomputer. Analysis of perper-formance data is required to accelerate the recognition of bottlenecks and as a means for raising an alarm. The analysis is also useful in providing recommendations as shown in the roadmap in Figure 1.1. Once an inefficiency is detected, the possible causes can be speculated and thus recommen-dations on how to remove the inefficiency are given. The specific objectives for performance analysis are:
• To provide on-line analyses based on expert knowledge such that bottlenecks are revealed and these can be related to coding practices. The codified knowledge includes the use of monitored data, derived performance metrics, and thresholds for the evaluation of the severity of bottlenecks.
• General recommendations are given when inefficiencies are detected. Recommendations are not required to be the final solution to remove a bottleneck but point to possible solutions or a course of action to further investigate the bottleneck. The recommendations are only given when an analysis renders an inefficiency.
• To design a hierarchy of analyses such that bottlenecks can be given a priority in order to enable an analysis path that improves the diagnoses of the bottlenecks.
• The codified knowledge for the analysis is configurable and extensible.
• To gain insight of the macroscopic performance of the system in order to see how a supercomputer is being used. Thus, the goal is not just to identify performance bottlenecks in running applications but also to provide an overview of general system performance. The following system design objectives were pursued in order to enable a suitable operation in a supercomputer:
• Scalability of measurements: scalable and synchronized measurements across an HPC System. The objective is to master large scale machines with potentially several hundred thousand cores, i.e. in the petaflop range.
• Interoperability: the tool is extensible with third party tools and/or libraries in order to profit from new technologies.
• Scalability in the tool management: management time overheads do not increase with the number of nodes of the monitored HPC system.
• Scalability in accessing the data: the querying of the data is also scalable and performance data should be promptly available for querying.
• Portability: The systemwide monitoring tool is ported into different HPC systems, with different hardware architectures and independent of batch systems and/or resource man-agers.
• Keeping a negligible monitoring intrusion: the monitoring overhead is kept statistically insignificant in a continuously running system. The average time of an application with or without the PerSyst Tool remains statistically the same, with a statistical error of 1%.
• Reduction of information: reduce amount of data through filtering and aggregation. Ag-gregation of information is done with respect to cores not time. The changes of perfor-mance with respect to time for a given application is important to identify the stages of a running code. This information over time could be also used for another monitoring tool that uses instrumentation which can have, as an input, the time where the bottleneck occurs in order to later make a fine grained analysis with instrumented code.
• No required user eduction/training: the users do not require additional information or training in the development phase or production phase of their applications for the purpose of monitoring. No user training is required as they do not trigger the monitoring of their applications. They are also not required to perform any changes in their applications. Monitoring runs on the background and remains unnoticed to the application as opposed to actively interacting with the application.
• No additional user action: users are not required to perform extra tasks other than their normal workflow when using the supercomputing (this usually includes: programming, building, and running the applications). Additional user action can be a consequence of detected performance bottlenecks, but is not directly triggered by the tool.
The concepts presented in this thesis encompass monitoring, analysis, and transport of the data. Approaches to visualize and store the data (such as database approaches) even though necessary, are not covered.
Security, with regard to network communication, is a broad topic with well established so-lutions. Also, the risks associated to unauthorized access to performance data are not critical, since the performance data remains anonymous. Finally, the possible listeners are a reduced group, i.e. the users of a supercomputer which have special access to it. Therefore, security considerations between communicating components within the monitoring and analysis tool are also out of the scope of this thesis.
1.3 Structure of the Thesis
This thesis is organized in seven additional chapters. The chapter “Approaches To Performance Monitoring” surveys the existing approaches to monitoring solutions, their areas of impact, and how they have influenced the monitoring tool described in this thesis. The next chapter “Execution Properties and Strategies” deals with the analysis methods in order to recognize performance problems. Chapter “Functionality of the PerSyst Tool” describes in detail the funcitonality and system design of the tool. In the context of agent trees, Chapter “Statistical Aggregation of Performance Data” describes how statistical aggregation is conducted. Chapter “Portability and Adaptability” deals with the portability and adaptability issues. Chapter “Context of Evaluation and Results” covers the specific implementation details of the PerSyst Tool on three supercomputers in many different aspects, including different measurements on overhead and scalability. There is also a validation of the results of the tool. The results on monitoring applications are shown in this chapter. Finally, the “Conclusions and Discussions” chapter includes the interpretation of the overall results and conclusions.
2
Approaches To Performance Monitoring
The following section provides a classification of the approaches to performance monitoring. Additionally, the overlapping areas that the monitoring tool in this dissertation has with other tools are described. The taxonomy tables also help determine the relevant differences the tool has with respect to other performance tools. Classifications are shown according to: the level at which it applies, functional approaches, and according to the software architecture. Section 2.2 presents the tools which have overlapping areas of commonality with the PerSyst Tool.
2.1 Existing Approaches and Tools for Performance Monitoring
Performance monitoring tools register and process performance data in order to help detect bottlenecks or to help a developer to optimize a code. There are performance tools which are prominent given that they have steps into analysis of performance data and they do not perform just performance monitoring. A non-exhaustive list of tools and libraries (only few representative tools at each category are shown) which are dedicated to performance monitoring (measuring based on profiling, or tracing) are shown on Table 2.1.
Performance Monitoring Performance Monitoring and Analysis
Ganglia [7], PAPI [79] Periscope [38], Scalasca [66], pfmon [3], perf [26] TAU [105], Vampir [62]
Table 2.1: Examples of performance tools and libraries for performance monitoring and performance analysis
The tools and libraries for performance monitoring are either dedicated to: the performance analysis of a single application (application level); the collection of performance data for a system-wide overview for system administrators (system level); or a combination of the two. Direct measurement can be done without knowledge of the source code (there is no instru-mentation involved) at system and application level. Once an application is instrumented, the monitoring is done at application level. Examples of other tools in the different monitoring levels are shown in Table 2.2.
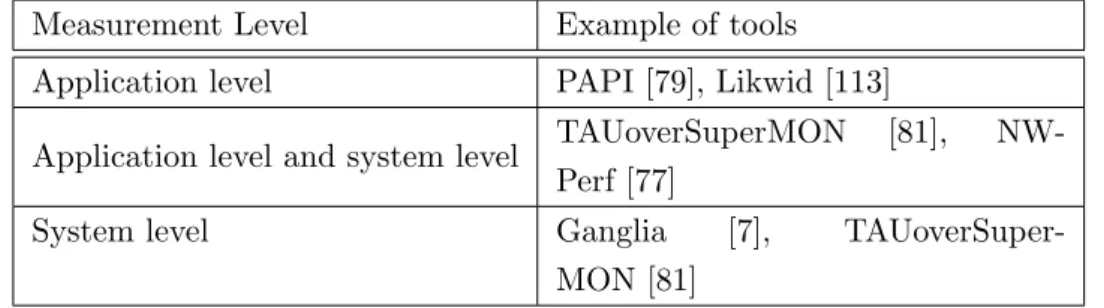
Measurement Level Example of tools Application level PAPI [79], Likwid [113]
Application level and system level TAUoverSuperMON [81], NW-Perf [77]
System level Ganglia [7],
TAUoverSuper-MON [81]
Table 2.2: Taxonomy of performance tools and libraries according to level of monitoring
Performance monitoring of an application can be categorized into monitoring with instru-mentation and without it. There are different instrumentation approaches that have been identified [29]. Instrumentation can be applied in the source code by inserting function calls that trigger the measurement and/or trace information collection prior to compilation [119]. Library level instrumentation links the library calls to a wrapper library with added function-ality for monitoring. This approach can be automatic and unnoticed by the user if the wrapper libraries replace the desired library but links internally to the library. Binary instrumentation rewrites the binary by inserting binary code that collects the measurements [13]. The advantage of this method is that instrumentation is language independent and no recompilation is needed. Finally, dynamic instrumentation refers to the approach of inserting and removing instrumen-tation at runtime [9], clearly no recompilation is needed and the approach is also language independent. Table 2.3 shows the type of instrumentations with examples.
Source level Periscope [38], Scalasca [66] , TAU [105], Vampir [62], Likwid [113]
Library level IPM [35, 36] Binary level ATOM [31]
Dynamic at runtime Pin [90], DynInst [9], DynaProf [78], DPCL [91] No instrumentation Likwid, perf [26], pfmon [3]
Table 2.3: Taxonomy of tools and libraries according to instrumention
From the forgoing three taxonomy tables presented, there is no tool or library which pro-vides performance analysis without instrumentation at a system level with a synchronized mea-surement for large HPC architectures. The PerSyst Tool encompasses all these features and additionally enables the aggregation and reduction of performance data and optimizes the ex-traction/collection of performance data. These capabilities are desired due to:
• No instrumentation implies negligible impact or disturbance of running applications.
• Systemwide on-line performance analysis of application level to process the bulk of appli-cation runs in a large HPC system.
• Synchronized measurement allows for performance monitoring at system level. For exam-ple: systemwide collection of floating point operations, instructions, and other metrics.
• Selection and aggregation of data to handle a reduced amount of data without sacrificing the quality of the monitoring data.
2.2 State of the art
The previous section described tools which are only a fraction of the existent tools for perfor-mance measurements. This section will cover the tools which are in a direct relation to the PerSyst Tool in more detail, showing the differences to each tool.
Direct measurement tools
At the Leibniz Supercomputing Centre, tools like pfmon [3] from HP were called at regular intervals and its output is parsed, aggregated, and stored in the file system. The used approach measures the hardware events by using command line tools at the compute nodes which output their data to file systems [16]. These buffered files are then read by another component which stores them into a database. Subsequently, this component deletes the files. All of these pro-cedures are carried out at regular intervals. The approach is implemented in two main steps: a script invokes the measuring tool and produces files in a common file system; then a script parses the output files and stores it into a database. A chronological scheduler was set to cycli-cally run the previous steps.
Differences or addressed shortcomings: This approach has the downside of having a costly I/O file system accesses which impedes the method to be scaled for machines with over hun-dreds of thousands of cores; it does not reduce the amount of information and does not provide analysis.
LIKWID
The LIKWID tool [112, 113] is multifaceted and one of its uses is for performance monitoring at system level. LIKWID is based on using the linux kernel module Model-Specific Registers (MSR) which can be found on Intel and AMD processors. A light weight daemon runs on the compute nodes and accepts Unix socket connections as a command to write on the MSR virtual files to read hardware events. The daemon makes probes at a specified cycle time and delivers these raw counters to the requesting client.
The tool can also be used without the daemon to run independently for a specific code as a performance tool. In this case, however, the tool requires special permissions to run. A given application can be instrumented to interact with LIKWID and do specific measurements for regions of the code. LIKWID uses predefined performance groups to select a group of events to be measured. These events are not presented raw to the users, instead derived metrics (rates, ratios and/or other calculations) are made available.
on the PerSyst Tool, its software infrastructure is not adequate to be used as a stand alone monitoring system for automatic analysis and reduction of information. The client components are not designed on a hierarchical structure such that the tool scales to a large number of nodes. NWPerf
NWPerf does systemwide monitoring on large scale supercomputing clusters at application level [77]. The scalability has not been experimentally tested, but given that it is based on a hierarchical system, the extension and scaling the system is possible. NWPerf measures data via modules at intervals synchronized by the Network Time Protocol (NTP) of a cluster. These modules operate as clients to send performance data over a multicast socket to a packet-handler component. The packet-handler uses a lightweight shared memory queue, which is emptied at intervals by a queue drainer. Data is decoded by the latter component and inserted to a database for permanent storage.
Differences or addressed shortcomings: Monitoring is done without applying on-line anal-ysis, and has no mechanisms for filtering, reducing, or aggregating the information.
MRNet
The Multicast Reduction Network tool (MRNet) is a tool for parallel applications enabling high-throughput communications [17, 55, 93]. Although MRNet is not, per se, a performance measuring tool it can be used for these purposes. Other ways in which MRNet can be cus-tomized include debugging, system administration tools, operations of command and control, and data collection and reduction. MRNet uses the principle of a hierarchy of software in a tree topology, also referred to as a tree-based overlay network, for scaling to hundreds of thousands of cores. Multicast is done from the frontend downwards through the tree, until the command reaches the leaves of the tree-topology. Transport of data is done with a bottom-up logic, i.e. from the leaves of the tree to the frontend. Aggregation can be implemented by customisable filters to aggregate data packets. The filters, however, can aggregate data only from piece-wise continuous aggregation functions.
Differences or addressed shortcomings: When MRNet is used as a performance monitor-ing tool the collection of data is done by usmonitor-ing the entire tree topology without optimizmonitor-ing the extraction of data. The purpose of the tool is very broad and does not specialize on performance monitoring.
TAU
A combination of systemwide monitoring and application level monitoring has been developed by Nataraj et al [81]. The authors used SuperMon [75], a monitoring and transportation sys-tem, to extract data from the compute nodes. The compute nodes delivered the data from mon (a single node data server) and also TAU [106] to provide application and system performance correlation. TAU provides the information of instrumented application. The tested scalability of Supermon is up to 2048 [108] nodes. Supermon handles client requests to extract performance information from the kernel instead of using a cyclic system-wide measurement rationale. TAU
can be used with other tools, for instance TAU over MRNet [65, 80], to meet the requirements of scalability.
Differences or addressed shortcomings: TAU relies on instrumentation of applications, which may bring unwanted side effects, like the ones discussed in the introductory chapter. IPM
The Integrated Performance Monitor tool (IPM) is a scalable, portable, and low overhead profil-ing and tracprofil-ing tool for application performance monitorprofil-ing [36,107]. Among other performance measurements, IPM profiles several types of MPI calls. Based on an overloading of the Intelli-gent Platform Management Interface(IPMI), IPM can be used to application level monitoring with instrumentation. The instrumentation is done automatically, without the user having to activate it, as it is at a library level. All running applications are profiled with a low overhead. As the applications interact with the MPI library, the library registers the number of calls with IPM. Among other features, IPM uses a hashing mechanism, which codes program regions into a signature, and compresses them to represent more than one task and region, in order to lower its overhead. Due to the fact that results across applications are not available, there is not a possibility of having a systemwide overview of performance. IPM also does not have on-line analysis; the applications can be analysed on a post-mortem visualization.
Differences or addressed shortcomings: IPM relies on instrumentation of applications, which may bring unwanted side effects, like the ones discussed in the introductory chapter. Ganglia
The open source project Ganglia enables distributed and systemwide monitoring for high-performance computing systems [7, 69]. Ganglia is widely used for system administration pur-poses and is considered to have a highly optimized means of data collection. Using a UDP communication protocol, Ganglia components transmit monitoring data in a unicast or multi-cast channel. Ganglia aims to achieve low per-node overheads and high concurrency [95], in part by using the UDP communication protocol. Per default, thegmond component of Ganglia is configured to send basic metrics such as system load and cpu utilization. User defined metrics contained in key-value pairs can easily be extended by means of added C or Python modules. The gmond component is also used as middle-ware to aggregate data and receive from other gmond daemons. Thus, it keeps an in-memory cache of monitored data. The gmetad component is a daemon which polls the gmond components periodically in order to store the information. The latter components are grouped in a hierarchical tree structure to enable high scalability. The default storage engine used is the Round Robin Database tool (RRD Tool) [84] which can be easily used for real-time visualization. Ganglia includes a web frontend component for visualization of performance information.
Differences or addressed shortcomings: Uses UDP, an unreliable communication proto-col, and has no in-built capabilities for on-line analysis. The transport system even though optimized by using UDP, is not optimized by reducing the communication paths. Although highly scalable, Ganglia has no inbuilt capabilities of monitoring in a per job basis. In addition
the collection of data among compute nodes is not synchronised, such that it is not possible to correlate data.
The Parastation GridMonitor
The Parastation GridMonitor provides data collection at a desired request from a client [21]. As a commercial software, the GridMonitor’s technology remains partially unknown. As such, it is not available to be adapted to a systemwide monitoring system that provides analysis and reduction of information. The Grid Monitor uses several components with different function-alities in order collect performance data [22]. One of these components, the collector, is the central process which captures data from the different agents which are running on the nodes. The collector, however, will only request information when a client triggers this request. The structure of data which is passed from an agent to a collector is a key, a value, and a timestamp. Differences or addressed shortcomings: Monitoring is done without applying on-line anal-ysis. Its technology remains partially unknown as is not open source.
The HOPSA Project
In the HOPSA Project [76] several tools have been integrated in a detection and analysis pro-cess for application performance monitoring. The tools carry out either systemwide performance analysis or application performance monitoring in separate stages. The system monitoring con-tributes with performance information for a holistic view and complements the use of application monitoring and analysis tools. The system monitoring on certain devices may not reflect the effects of one application, but of several applications. The use of application monitoring and analysis tools is constrained in the HOPSA Project to a set of well-known performance tools which cover different areas of performance bottlenecks (Dimemas [103], Paraver [64], Scalasca, ThreadSpotter [12] and Vampir).
Differences or addressed shortcomings: The approach presented by the HOPSA Project is different to the PerSyst Tool. While the PerSyst Tool combines systemwide monitoring and uses analysis for a preliminary detection of inefficient codes, the HOPSA Project has a workflow oriented to a detailed analysis which has an additional systemwide information support. Periscope
Many of the features that are desirable for systemwide performance monitoring are already existent in the profiling based tool Periscope [38]. Periscope is a scalable tool for analyzing ap-plication performance. It enables a distributed on-line search for performance properties based on hardware counters as well as MPI and OpenMP properties [11, 39–41]. Using instrumented code, Periscope provides the possibility of defining a user region within the code [41]. There are also potential look-up regions within the instrumented section of the code which are auto-matically detected. These regions are analyzed and refined when bottlenecks are detected in order to delimit the section of the code which has a problem. Periscope binds the application with a monitoring request interface which activates the start and stop of measurements of the hardware counters at these regions [61].
In Periscope, the detection of the bottlenecks is done through the evaluation of properties in analysisstrategies. The properties characterize the bottlenecks and are arranged into trees that are refined when a given bottleneck is encountered. These ideas have been used in the PerSyst Tool with some modifications—they have been adjusted to characterize the systemwide moni-toring and applications as a black box.
Differences or addressed shortcomings: A tool like Persicope, while it can be effective in precisely uncovering inefficiencies, it is not adequate for the purpose of system wide analysis and monitoring. Periscope provides detailed analysis and is not a system wide monitoring tool itself (it does not have the capability of running as a daemon, thus providing continuous monitoring). The PerSyst Tool is distinct in that it provides formalized on-line analysis without instru-mentation, filtering unnecessary monitoring data and aggregating the monitored data using percentiles [42, 43]. The approach is to conduct a preliminary detection of inefficient codes (which may even be running in production mode as opposed to testing or scaling trials). Ad-ditionally, the hierarchical network is only used partially to communicate the monitoring data from the jobs and produce an output as local to the source of information as possible, in this way it avoids network congestion. It does not belong to the set of tools that use instrumentation to correlate data with code regions. The tool uses current technology to cope with scalability and demands to handle the volumes of data produced. Scalability issues are tackled by the hi-erarchical tree-like architecture of independent and communicating software components. The PerSyst Tool handles conflict monitoring by allowing users to switch off the monitoring infras-tructure. Finally, adapting the PerSyst Tool to other tools with system level data, in order to be part of a holistic approach of data collection, is feasible [45].
3
Execution Properties and Strategies
In this Chapter, the analysis abstractions—theexecution properties andstrategies—used in the PerSyst Tool are provided.
An analysis done to one or more hardware events that aims to reveal an inefficiency is referred to as execution properties or simply properties. These abstractions are used in the tool’s al-gorithms to evaluate performance. The properties are organized in tree-like structures that determines whether to continue performing a finer analysis or to ignore monitoring data when no bottleneck is detected. These analysis trees are called strategies in this thesis and are used to evaluate the performance in a code. The idea behind a tree structure of properties is to start at the root properties and refine to other properties to search for an inefficiency. Once an inefficiency has been identified at a root property, a more specific inspection will be made with the child properties to delimit the problem which causes it. This idea was taken from Periscope [38] which also refines properties depending on the implemented strategies only when it is needed.
Astrategy mapis an abstraction of analysis which includes the strategy along with recommenda-tions (the latter are a product of the analyses performed). Strategy maps are introduced in the following section. The bottleneck list proposed by Treibig et al. [114] is extended in this section and used for the properties and strategies. The criterion used by the chip vendors [1, 2, 4, 52] to optimize a code has also been taken into account. The criteria used to prioritize the analysis of performance bottlenecks are:
• Limitations inherent to the code: algorithmic constraints, volume of data saturates the internal bandwidth, dominating I/O, etc.
• Optimizations that have the biggest impact on performance: optimizing load imbalance in comparison to optimizing loop-unrolling, optimizing memory accesses compared to optimizing branch prediction, and so on.
• Bottlenecks that typically arise more frequently.
These criteria are applied with the constraint that these performance bottlenecks should be measurable with current measurement tools and applicable for black box monitoring1. The
1The termblack box monitoring will be used in this document to refer to monitoring of running executables
possible bottlenecks and optimizations can be formalized into a systematic analysis of code, having the code as a black box.
Section 3.2 provides a detailed definition and explanation of how properties have been im-plemented. The analyses are centered on the x86 64 Intel architectures: Westmere-EX, and Sandy Bridge-EP. For each architecture the final strategies are provided which may differ from the strategy maps due to events which can’t be measured with current available tools.
3.1 Strategies for Monitoring and Analysis
A strategy allows a controlled selection of properties by defining relations among them. A parent-child relation in a property defines a broader problem in the parent property and a more delimited problem in the child property, such that a more detailed diagnosis to an observed performance problem can be done in the latter. For example: the property for stalled cycles is a parent to stalled cycles due to instruction starvation. A strategy may comprise a simple list of properties or a more complex list of trees of properties. All of the strategy nodes in a tree are properties that analyze a specific bottleneck. Cyclic property structures, for instance property A is parent of property B and viceversa, are, by definition, not possible given that this would contradict the idea of doing a refinement in a child property. A strategy has one or more root properties which will always be evaluated, if the measurement data for them is available. If a root property has one or more child properties, these will be evaluated if the root property reports the existence of a bottleneck. Refining over properties or stopping and ignoring a sub-strategy tree is controlled in the same way.
In the following sections strategy maps are shown. The term ’high’ and ’low’, when used in the context of a property and a strategy map, is precisely defined by a threshold. A threshold is a quantity which delimits what is considered to be an inefficiency (An explanation on how thresholds values can be selected is available in Section 3.2). Each figure illustrates a strategy map. Note that the section numbering has a correspondence to the items shown in the figures. In the strategy maps the boxes can correspond to a property or to an analysis done at the end of the application run (post-mortem stage). When the word ’Strategy:’ appears in the title of a section, the section corresponds to a strategy map in a figure and marks the beginning of a block of sections which are related to this figure. The arrows in a strategy map represent selections: when no qualifier (such as ’high’ and ’low’) is indicated the branch should always be evaluated. Each strategy map branches to several analyses that have to be parsed in order to identify the bottleneck. While red boxes correspond to recommendations, green circles indicate that no optimization is required for the examined performance pattern.
3.1.1 Strategy: Memory bandwidth analysis
The most dominant aspect of single core performance is related to memory movements in the processor and, thus, it is important to classify a code with an input data set as memory bound or compute bound [114]. Memory boundedness limits the optimizations that can be applied at the level of the pipeline. Regardless of additional stalls that the pipeline may suffer, the memory accesses will dominate the latency since they are many times more expensive and will thus hide latencies due to other stalled cycles. A memory transfer has an average latency of 50 to 70 compute cycles (see Tables 3.1 and 3.2 of the two presented architectures in the Sections 3.3 and 3.4). These are average values and not a precise cost in terms of cycles, given that software prefetching and memory affinity in NUMA architectures mitigate the waiting cycles for memory in the DRAM [88]. On the other hand, the opposite effect appears (longer latency) if data in the L1 and L2 caches has to be written on main memory.
The strategy starts by analyzing the memory bandwidth; at this point it is determined whether there is memory saturation or not. Figure 3.1 illustrates the memory bandwidth map.
IF memory bandwidth is high: GO TO Section 3.1.2 ELSE GO TO Section 3.1.9
Figure 3.1: Memory bandwidth strategy map
3.1.2 Analysis: Memory bound
If an application is memory bound, the usage of data from the DRAM requires inspection. If the loaded data volume into the cache and registers is not entirely used for the computations, then the unused data volume should be avoided. If the same data is loaded several times to carry out computations, a recommendation is to improve the data locality such that the data is loaded once and all the necessary computations are carried in one go before other data is loaded for computations. If the code is already optimized for moving data blocks to a minimal amount without performing strided accesses, and it is still memory bound, then there is little work to do by optimizing the computations themselves, since the compute latencies will be hidden by the memory transfer latencies.
strided access or inefficient temporal locality can not be determined separately. However, by examining the metrics shown in Figure 3.2, it can be determined that it has at least one of the two problems, without a distinction if it is a strided access problem or a memory locality problem.
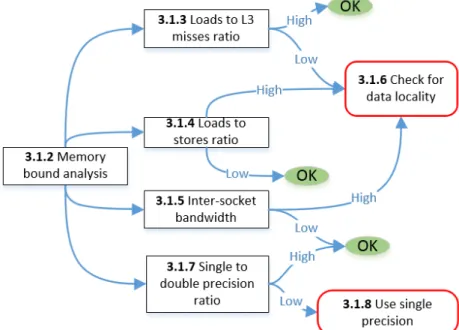
Figure 3.2: Memory bound code strategy map
3.1.3 Analysis: Loads to L3 misses ratio
A diagnosis to determine whether the code suffers from strided accesses or memory locality can be done by examining the ratio of data loads by L3 cache misses. If loads are constantly causing cache misses, this ratio will below and this indicates a bad data locality.
IF loads to L3 misses ratio islow: GO TO Section 3.1.6
ELSE code needs no optimization with respect to this ratio.
3.1.4 Analysis: Loads to stores ratio
The ratio of the loads to the stores gives an idea of the amount of data needed (loaded) in order to produce new data (stored). The lower this ratio, the more efficiently the new data is produced. Ahigh ratio is not necessarily a bottleneck but it does give an idea of how the data volume is being used.
IF loads to stores ratio ishigh: GO TO Section 3.1.6
3.1.5 Analysis: Inter-socket bandwidth
Certain Intel architectures feature two or more sockets with shared memory, with each socket containing several cores. The inter-socket bandwidth can be monitored to examine the data locality. In the case of certain Intel architecture types, the transfer rate through the Quick Path Interconnect, QPI, can be used for this purpose. High transfer rates are an indication that data used in one hardware socket has to be fetched in another one (for example, there is bad data locality due to the first touch policy). If there is a high bandwidth between sockets, i.e. the NUMA bandwidth, it is recommended that the data placement be checked.
IF inter-socket bandwidth ishigh: GO TO Section 3.1.6
ELSE code needs no optimization with respect to inter-socket bandwidth.
3.1.6 Recommendation: Check for data locality
This recommendation aims to improve the data locality. It should be checked whether the data volume is not being used due to:
• Strided accesses: if this is the case improve data spatial locality.
• Inefficient temporal data locality: if this is the case try to improve the reutilization of data
• Check first touch policy in OpenMP threads: make sure that data is initialized at the threads were it will be used.
3.1.7 Analysis: Single to double precision ratio
The type of floating point precision that has been used can be analyzed via the ratio of single to double precision. Using single precision instead of double precision halves the memory con-sumption of the floating point data and the corresponding data transfers.
IF single to double precision ratio islow: GO TO Section 3.1.8
ELSE code needs no optimization with respect to this ratio.
3.1.8 Recommendation: Use single precision
This recommendation consists of reducing the memory footprint of the application. If the code does not suffer from numerical instability with single precision, then single precision should be used as the code will not only perform better, but it will also take up less memory and perform less data movements in terms of bytes. For memory bound codes this can be very beneficial if the application can become compute bound. Therefore, recommendations to a code which uses double precision include analyzing the feasibility of using single precision.
3.1.9 Strategy: Compute bound analysis
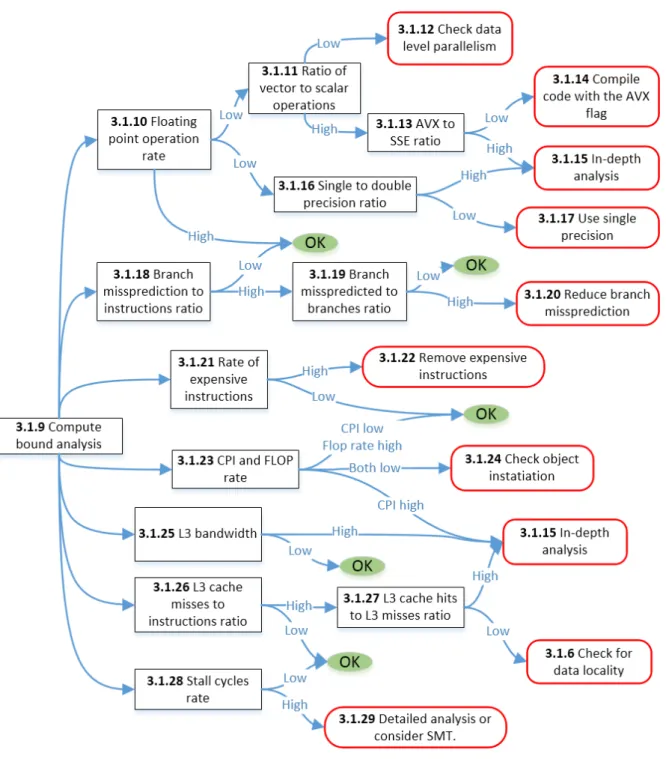
If a code is compute bound, the code should also address latencies in moving data that may bring the computation temporarily to a stall. However, these are not necessarily the dominant cause of bad performance. Figure 3.3 shows the different aspects of performance that are explored in a compute bound code.
3.1.10 Analysis: Floating point operation rate
The rate of floating point operations has been endorsed by the scientific computing community as part of the standard set of metrics for performance evaluation. The higher the rate the more efficient the code is considered (an exception is when phoney arithmetic calculations are included in the code just to increase this rate).
IF floating point operation rate islow:
GO TO Section 3.1.11 THEN Section 3.1.16
ELSE code needs no optimization with respect to the flop rate.
3.1.11 Analysis: Ratio of vector to scalar operations
Codes with data level parallelism can be vectorized with special instructions that are available in some architectures. Intel provides, for instance, instruction sets with SSE or AVX vectorizations (or both). These instruction sets allow the architecture to perform several operations at once. The higher the ratio of the total number of vectorized operations (with either AVX and/or SSE) to the number of scalar operations, the more efficient the code will execute. Vector instructions can perform (depending on the architecture and if they are in single precision) between 2 to 16 times the number of operations compared to scalar operations. Thus, an equivalent speedup can be achieved by using these vectorized operations.
IF vector to scalar operations ratio islow: GO TO Section 3.1.12
ELSE GO TO Section 3.1.13.
3.1.12 Recommendation: Check data level parallelism
The recommendation when a code has little or no vectorized operations, is to try to remove the dependencies in the loop kernel. If the code exhibits data level parallelism then the recommen-dation is to compile the code with AVX compilation flag.
3.1.13 Analysis: AVX to SSE ratio
The ratio of the different types of vectorizations can also be measured. The ratio of AVX instructions and SSE instructions is inspected, if the architecture supports AVX instructions. In this item, scalar operations are not taken into account.
GO TO Section 3.1.14
ELSE GO TO Section 3.1.15.
3.1.14 Recommendation: Compile with the AVX flag
A code that has been compiled with SSE instructions has a degree of data level parallelism present. The question is then whether this data level parallelism can be incremented, or whether it is enough to leverage the AVX instructions by simply compiling with the AVX flag (this is the case where flags were simply not used before).
3.1.15 Recommendation: In-depth analysis
If all the analysis failed to give a recommendation, the application developer should instrument the code for a in-depth analysis of performance and code regions. The developer can check for other causes of inefficient performance.
3.1.16 Analysis: Single to double precision ratio
Section 3.1.7 analyzes single precision to double precision of floating point operations to de-termine whether the memory can be reduced in the case of memory bound code. In some architectures two single precision floating point operations can be performed in the place of one double precision operation, which makes the former more efficient. Thus, the analysis of single precision usage is also needed to improve the performance in compute bound codes.
IF single to double precision ratio islow: GO TO Section 3.1.17
ELSE GO TO Section 3.1.15.
3.1.17 Recommendation: Use single precision
As a recommendation, the application developer should evaluate if the use of single precision is possible. A speed-up of almost a factor of 2 is possible if there are no dependencies.
3.1.18 Analysis: Branch missprediction to instructions ratio
By monitoring the branch missprediction rate to the instructions, wasted CPU cycles due to misspredictions can be detected. The waste of cycles implies not only wasted time but energy, as the execution of misspredicted instructions make the processor work harder.
IF branch miss prediction ishigh: GO TO Section 3.1.19
ELSE code needs no optimization with respect to misspredicted branches.
3.1.19 Analysis: Branch missprediction to branches ratio
The rate of branch miss predictions with respect to total number of branches will guide the optimization actions. This analysis is done to obtain more insight of the performance with
respect to branches. Thus, only a recommendation will follow. GO TO Section 3.1.20
3.1.20 Recommendation: Measures against branch misspredictions
The recommendation given is find the conditionals where it is known that jumps (branches) are being performed and analyze the possibility of removing or reordering the conditionals. By removing branches, the misspredictions will subsequently be removed [60]. The developer can allow the branch predictor to correctly predict branches when these unnecessary branches are removed. It is also recommended to try different compiler optimizations.
3.1.21 Analysis: Rate of expensive instructions
Another item to analyze is whether a code has expensive instructions (like divisions, exponen-tials, square roots, etc), to be found within the compute kernel.
IF expensive instruction rate is high: GO TO Section 3.1.22
ELSE code needs no optimization with respect to expensive instructions.
3.1.22 Recommendation: Remove expensive instructions
The application developer should avoid using expensive instructions within the loop kernel. The recommendation is to reduce associated latencies by checking the expensive instructions in the kernel. The following optimizations can be done:
• If there is a division, the recommendation is to find the reciprocal of the fraction and use multiplication (i.e. change a fraction which is known to its decimal form). The Intel compiler flag -no-prec-div gives a hint to the compiler to replace the division by a multiplication with a reciprocal.
• For other expensive operations, it is recommended to try to do the expensive operation outside the kernel (outside of other loops as well).
• If the previous optimizations are not possible, then the application developer should con-sider implementing a look-up table with the correspondence of a value to the transforma-tion of an expensive functransforma-tion that is computed only once and accessed within the kernel loop, avoiding thus the repetitive expensive instruction. There will be a trade off between wasted cycles due to expensive instructions and memory accesses (look up table), so this solution requires careful evaluation.
3.1.23 Analysis: CPI and Flop rate
Another item to examine is the ratio of cpi (clock cycles divided by instructions) and the flop rate. This analysis targets applications which should typically be floating point intensive. The phenomenon of having a low ratio of clocks per instruction and, simultaneously, a low
floating point operation rate, could indicate that the code performs unwanted operations [114]. Incorrect inlining will also produce this effect, when inlined functions which aren’t visible to the application developer insert other inlined functions unknowingly. These usually happens when inlining constructors which initialize other classes and/or inherit from other classes.
IF CPI is high:
GO TO Section 3.1.15
ELSE IF CPI is low AND flop rate islow: GO TO Section 3.1.24
ELSE code needs no optimizations.
3.1.24 Recommendation: Check object instantiation
A typical bottleneck which exhibits the symptom oflow CPI andlow floating point rate is the excessive object instantiation in C++ [114]. Object instantiation in object oriented languages (like C++) creates more latency with unnecessary instructions than normal in-built types. These are usually hidden functions that are not explicitly written by the developer and must be included in the compiled code [72].Therefore, the recommendation is to analyze the possibility of using less objects (C struct in the case of C++) and, thus, to remove unnecessary instructions.
3.1.25 Analysis: L3 bandwidth
This analysis aims to determine whether a code is bound by the L3 cache accesses. IF L3 bandwidth ishigh:
GO TO Section 3.1.15
ELSE code needs no optimizations with respect to L3 bandwidth.
3.1.26 Analysis: L3 cache misses to instructions ratio
If the L3 cache misses to instructions ratio is high compared to the total number of retired instructions, this indicates that the L3 cache misses dominate.
IF L3 cache misses to instructions ratio ishigh: GO TO Section 3.1.27
ELSE code needs no optimizations with respect to L3 accesses.
3.1.27 Analysis: L3 cache hits to L3 cache misses ratio
If L3 cache misses are high with respect to the total number of instructions, the fraction of L3 cache hits to L3 cache misses will bring more insight into the cache utilization. Note that the recommendations given to this symptom are the same as the ones in Section 3.1.6.
![Table 3.1: Westmere-EX: Cache latencies. Taken from the IA64 and IA32 Software Developers Man- Man-ual [4].](https://thumb-us.123doks.com/thumbv2/123dok_us/1861720.2771139/67.892.297.572.139.260/table-westmere-cache-latencies-taken-software-developers-man.webp)