Technology Assessment
Technology
Assessment
Program
Agency for Healthcare Research and Quality
540 Gaither Road Rockville, Maryland 20850
Vision Rehabilitation for
Elderly Individuals with
Low Vision or Blindness
TABLE OF CONTENTS
Table of Contents ... iEstimate of Number of Individuals in Elderly Medicare Population who Might Benefit from Vision Rehabilitation Training and Credentialing of Vision Rehabilitation State Statutory and Regulatory Requirements for Unlicensed Tables... v
Tables (Appendix B)...vi
Table (Appendix C) ...vi
Tables (Appendix D)...vi
Table (Appendix F)...vii
Tables (Appendix G) ...vii
Figure ... viii
Figure (Appendix E) ... viii
Executive Summary ... 1
Scope of Report ... 17
Background ... 20
Low Vision and Blindness ... 20
Definitions of Low Vision and Blindness... 20
Causes of Low Vision and Blindness ... 23
Consequences of Low Vision or Blindness ... 25
Services ... 25
Vision Rehabilitation Services... 36
Personnel ... 37
Clinical Practice Guidelines ... 46
Patient Evaluation ... 49
Management and Rehabilitation... 51
Referral and Multidisciplinary Care ... 52
Follow-up Care... 53
Ongoing Trials... 53
Methods... 53
Key Question, Analytic Framework, and Outcomes... 53
Key Question Addressed... 54
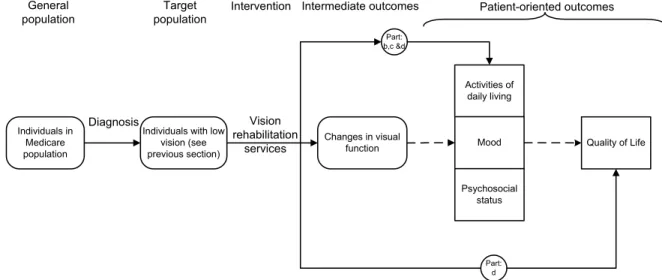
Analytic Framework for Addressing Effectiveness of Vision Rehabilitation ... 54
Outcomes Assessed ... 55
Literature Searches... 59
Inclusion/Exclusion Criteria... 59
Data Extraction ... 63
Evaluation of the Quality of Evidence Base ... 64
Statistical Methods... 64
Evidence Base ... 64
Evidence Synthesis ... 66
Comprehensive Services ... 67
Quality of Included Studies... 67
Details of Study Enrollees and Study Generalizability ... 68
Details of Programs Evaluated... 69
Outcomes Assessed ... 73
Findings of Included studies... 74
Findings of other Systematic Reviews ... 79
Optical Aids and Low-Vision Devices ... 81
Quality of Included Studies... 81
Details of Study Enrollees and Study Generalizability ... 82
Outcomes Assessed ... 84
Findings of Included Studies ... 84
Findings of Systematic Reviews... 87
Subsection Summary ... 89
Orientation and Mobility Training ... 90
Quality of Included Studies... 90
Details of Study Enrollees and Study Generalizability ... 91
Details of Programs Evaluated... 91
Outcomes Assessed ... 93
Findings of Included Studies ... 94
Findings of Systematic Reviews... 96
Subsection Summary ... 96
Adaptive Techniques Training ... 98
Quality of Included Study ... 98
Details of Study Enrollees and Study Generalizability ... 98
Details of Program Evaluated... 99
Outcomes Assessed ... 99
Findings of Included Studies ... 99
Findings of Systematic Reviews... 100
Subsection Summary ... 101
Group Intervention Programs... 101
Quality of Included Studies... 102
Details of Study Enrollees and Study Generalizability ... 103
Details of Programs Evaluated... 103
Findings of Included Studies ... 106
Findings of Systematic Reviews... 108
Subsection Summary ... 108
Supervision of Services and Outcome... 109
Bibliography... 113
APPENDICES: Supporting Documentation and Evidence Tables . 131 Appendix A. Full Text of Medicare Program Memorandum (29th May 2002)... 132
Appendix B. Education and Certification of Non-Medicare Physician Vision Rehabilitation Personnel... 136
Occupational Therapists... 137
Physical Therapists ... 143
Low-Vision Therapist... 148
Orientation and Mobility Specialists ... 161
Rehabilitation Teacher ... 168
Appendix C. Ongoing Trials ... 176
Appendix D. Outcome Measures ... 184
Appendix E. Literature Searches ... 191
Electronic Database Searches ... 192
Hand Searches of Journal and Nonjournal Literature ... 196
Appendix F. Excluded Studies ... 197
TABLES
Table 1. ICD-9-CM Definitions of Low Vision and Blindness ...20
Table 2. Primary Causes of Low Vision in the Elderly...24
Table 3. State-by-State Low Vision and Blindness Prevalence Estimates...30
Table 4. Evidence Base ...65
Table 5. Types of Vision Rehabilitation Services Evaluated ...66
Table 6. Quality of Studies of Comprehensive Vision Rehabilitation Services...67
Table 7. Outcomes Assessed ...73
Table 8. Quality of Studies of Low-Vision Devices and Optical Aids ...82
Table 9. Outcomes Assessed ...84
Table 10. Systematic Reviews of Optical Aids and Low-Vision Devices ...88
Table 11. Quality of Studies of Orientation and Mobility Training ...91
Table 12. Outcomes Assessed ...93
Table 13. Quality of Studies of Adaptive Techniques Training...98
Table 14. Quality of Studies of Group Intervention Programs...102
Table 15. Outcomes Assessed ...105
TABLES (APPENDIX B)
Table B-1. Typical Curriculum of a Degree Course in
Occupational Therapy... 137
Table B-2. Typical Curriculum of a Degree Course in
Physical Therapy ... 143
Table B-3. Pennsylvania College of Optometry Low-Vision
Therapy Certificate and Master’s Program Courses.. 148
Table B-4. Typical Curriculum of an O&M Specialist Degree
Course ... 161
Table B-5. Typical Curriculum of Rehabilitation Teacher
Degree Program ... 168
TABLE (APPENDIX C)
Table C-1. Ongoing Trials ... 176
TABLES (APPENDIX D)
Table D-1. Instruments used to Evaluate Activities of Daily
Living ... 184 Table D-2. Instruments used to Evaluate Mood
Table D-3. Instruments used to Evaluate Psychosocial
... 188
Functioning ... 189 Table D-4. Instruments used to Evaluate Quality of Life ... 190
TABLE (APPENDIX F)
Table F-1. Excluded Studies ... 197
TABLES (APPENDIX G)
Table G-1. Systematic Reviews and Technology Assessments.. 200 Table G-2. Study Design Details ... 202
Table G-3. Study Design Characteristics Pertaining to Internal
Validity ... 206 Table G-4. Patient Enrollment Criteria... 211
Table G-5. Characteristics of Enrolled Patients I:
Residential Status and Underlying Pathology... 214
Table G-6. Characteristics of Enrolled Patients II
(Demographics) ... 218
Table G-7. Charactersics of Enrolled Patients III
(Comorbidities) ... 224 Table G-8. Rehabilitation Program Details ... 228 Table G-9. Study Findings... 240
FIGURE
Figure 1. Analytic Framework for Addressing Effectiveness of
Vision Rehabilitation ... 55
FIGURE (APPENDIX E)
EXECUTIVE SUMMARY
Section 645 (a) of the Medicare Prescription Drug, Improvement and Modernization Act of 2003 requires that the Secretary of Health and Human Services conduct a study to determine the feasibility and advisability of providing payment for vision rehabilitation services furnished by vision rehabilitation professionals.(1) The Secretary has been instructed to report on this study and provide recommendations for such legislation or administrative action as the Secretary
determines to be appropriate.
On February 10th 2004, AHRQ issued a Statement of Work (SOW)
contracting ECRI to update a previous report published in
October 2002 titled, “Vision Rehabilitation: Care and Benefit Plan Models.”(2) The SOW specified that ECRI should update and extend the Lewin Group report by systematically reviewing new evidence on the potential of vision rehabilitation services to improve the quality of life and functioning of the elderly with low vision or blindness. In commissioning this report, AHRQ provided ECRI with four Specific Aims. These Specific Aims are as follows:
1. Estimate the number of elderly persons with vision loss that might benefit from vision rehabilitation services. Review published
estimates if available. If not, use sources of data such as the National Health Interview Survey or other sources as appropriate. Discuss how available data on prevalence relate to studied
indications on vision rehabilitation and estimate how many Medicare beneficiaries might benefit from vision rehabilitation.
2. Update the Lewin report by reviewing any additional information regarding the training of vision rehabilitation personnel in the United States, as well as any practice guidelines or other
documentation regarding accepted practice. Provide a summary of organizations that provide training and credentialing of vision
rehabilitation professionals. Provide a summary of different state statutory or regulatory requirements governing both the
credentialing of providers and the provision of services.
3. Update the Lewin report by systematically reviewing new evidence on the effectiveness of vision rehabilitation services. Include
information on:
a. The types of providers and settings that were used in studies b. The components and frequency of vision rehabilitation
services provided in the studies
c. The patient population that was studied, including age, whether community dwelling or in nursing homes, and information about the extent and characteristics of vision loss
d. Validity of the outcomes selected for measurement e. Methods of measurement of outcomes
f. Outcomes of the vision rehabilitation services
g. The possible role of the pattern of vision loss, the etiology of vision loss, and the prognosis for an individual patient’s future vision on the benefits of vision rehabilitation
4. Summarize the types of providers that provided the services in the clinical trials, whether the services were provided under physician supervision, and the outcomes achieved. Provide an analysis of how these results might be generalizable to the question of whether providers, specifically the three types of providers
specified in the law (low-vision therapists, orientation and mobility specialists, and rehabilitation teachers), can provide quality
services in the absence of physician supervision.
The findings of our assessment as they pertain to these four Specific Aims are presented below.
Specific Aim 1: The precise number of individuals in the U.S. Medicare population who might benefit from vision rehabilitation
services is not known; only estimates are available. Despite a number of limitations, the best estimate currently available emanates from a model developed by Massof.(3) Massof’s model was developed using data from five U.S. population-based prevalence studies that
screened for visual impairment (the Beaver Dam Study,(4) the Baltimore Eye Survey,(5-7) the Framingham Eye Study,(8-10) the Mud Creek Valley Study,(11) and the Salisbury Eye Evaluation Study.(12))
Massof’s model, when applied to census data collected for the year 2000, estimates that approximately 1.255 million individuals in the U.S. consisting of 1,120,000 whites and 135,000 blacks would meet the ICD-9-CM definition for low vision (ICD-9 codes beginning with
the prefix 369.xx1) and are thus potential candidates for vision
rehabilitation services. This represents approximately 3.7% and 4.9% of the total white and black Medicare-aged population, respectively.
These prevalence estimates include individuals with visual
impairment from potentially correctable cataracts. Vision loss due to cataracts can, in most cases, be surgically corrected. Consequently, the prevalence estimates need to be adjusted to account for these individuals. Although the precise number of individuals with
correctable cataract cannot be determined, Massof estimated this figure to lie in the region of 15% to 20%.(13) Assuming that this estimate is reasonable, we calculated that the total number of individuals in the U.S. who might be considered as potential
candidates for low-vision rehabilitation services falls within the range of 1,004,000 to 1,066,750. Thus, adjusting for the prevalence of cataracts, we estimate that approximately 3.3% to 3.5% of Medicare-aged whites (896,000 to 952,000 individuals) and 3.8% to 4.1% of Medicare-aged blacks (108,000 to 114,750 individuals) are potential candidates for low-vision rehabilitation services.
Although Massof’s model provides the best currently available
estimates of the prevalence of low vision among the elderly Medicare population, the generalizability of these estimates to the specific
question, “How many Medicare beneficiaries might benefit from vision
1 ICD-9 codes for “low vision” are coded 369.XX, where the prefix 369 relates to the diagnosis of “low vision or blindness” and the suffix .XX relates to the severity of the low vision in both eyes.
rehabilitation services?” cannot be determined. There are several reasons for this:
• First, the prevalence estimates calculated using Massof’s
model were based on data from epidemiological studies that were not designed to determine the prevalence of individuals who meet Medicare’s current eligibility criteria for vision
rehabilitation services. Rather, these studies were designed to provide an estimate of the prevalence of visual impairment in selected U.S. populations where the definition of visual
impairment was usually based solely on measures of visual acuity. Disability resulting from visual impairment is not entirely dependent upon visual acuity. Visual field loss and other
impairments can also lead to disability. For the purposes of addressing Specific Aim 1 then, available data on the
prevalence of visual impairment will likely underestimate the true prevalence of low vision in the U.S.
• Second, Medicare’s current suggested medical necessity
criteria for vision rehabilitation services extend beyond the World Health Organization (WHO) definitions of low vision (ICD-9-CM code: 369.xx) and include individuals with a number of uncorrectable and irreversible visual field defects that fall into the ICD-9 diagnostic category of a “visual disturbance” (ICD-9-CM code: 368.4x). Massof’s prevalence estimates do not take into account this latter diagnostic category. The consequence of this is that, even if prevalence data from the population-based studies listed above were to provide an accurate estimate of the
prevalence of low vision, the estimates emanating from
Massof’s model will likely underestimate the true prevalence of low vision as defined by Medicare’s eligibility criteria.
• Third, the studies used to develop Massof’s model focused
primarily on white populations. Although two of the studies did evaluate African Americans, none evaluated any other racial groups. Consequently, the generalizability of the estimates derived from the Massof model to the elderly Medicare population is unclear.
Specific Aim 2: Vision rehabilitation services are multidisciplinary. Although staffing models differ from program to program, guidelines from the American Academy of Ophthalmology (AAO)(14) and the American Optometric Association (AOA)(15) list both licensed medical personnel (ophthalmologists, optometrists, ophthalmic nurses, occupational therapists and physical therapists) and unlicensed low-vision professionals (low-vision therapists, vision rehabilitation teachers, and orientation and mobility specialists) as appropriate providers of vision rehabilitation services.
The Lewin Group report provided little information on the training and credentialing of personnel that provide vision rehabilitation services. In the present report, we provide descriptions of each service
provider considered by the AAO and the AOA to be members of a multidisciplinary rehabilitation team. We also provide details of their training and credentialing. In particular, we provide extensive
selected vision rehabilitation personnel who do not meet the current definition of a Medicare physician (occupational therapists, physical therapists, low-vision therapists, rehabilitation teachers, and
orientation and mobility trainers).
Information on state statutory or regulatory requirements governing both the credentialing of providers and the provision of services is sparse. Ophthalmologists, optometrists, occupational therapists, physical therapists, and social workers are all required to be licensed by the states in which they practice. There are currently no state statutory or regulatory requirements governing the provision of vision rehabilitation services by unlicensed personnel (low-vision therapists, rehabilitation teachers, or orientation and mobility specialists). Efforts supported by a number of organizations are currently underway in the state of New York to obtain licensure for low-vision therapists, vision rehabilitation teachers, and orientation and mobility specialists as a new class of allied health professional.(16-18) To date, however, this and other similar efforts in the states of North Dakota and Tennessee, have not been successful.(16,17,19)
Low-vision therapists, rehabilitation teachers, and orientation and mobility specialists can, provided they meet certain eligibility criteria, apply for certification by the Academy for Certification of Vision
Rehabilitation and Education Professionals (ACVREP). According to the National Vision Rehabilitation Cooperative, ACVREP certification of unlicensed vision rehabilitation personnel is recognized by many states as a “…strong barometer to ensure quality control among
providers.”(20) For example, the state of Alabama strongly
encourages that unlicensed vision rehabilitation personnel within its programs have ACVREP certification and the state of Georgia
requires ACVREP certification for rehabilitation teachers and orientation and mobility specialists that work in state-run programs.(20)
Specific Aim 3: In order to address Specific Aim 3, we asked the
following Key Question: Is vision rehabilitation an effective
intervention for patients with irreversible low vision or blindness? In assessing effectiveness, we considered four outcomes related to disability and function; activities of daily living, mood, psychosocial status, and quality of life.
Since the publication of the Lewin Group report, the field of vision rehabilitation has been active, funding opportunities for research into low vision have improved, and a plethora of new studies are
underway. This increase in activity, however, is not yet mirrored by the literature. Our literature searches, which were limited to the period
January 2000 to February 2004,2 identified a total of five systematic
reviews(21-25) and 13 studies that met our a priori inclusion
criteria.(26-38) These studies included four RCTs,(26-29)
two nonrandomized controlled trials,(30,31) and seven before-after studies.(32-38)
2 The Lewin Group report covered literature published before this time. As per the requirements of Task 3, this report focuses on new evidence that has been published since the publication of the Lewin Group report.
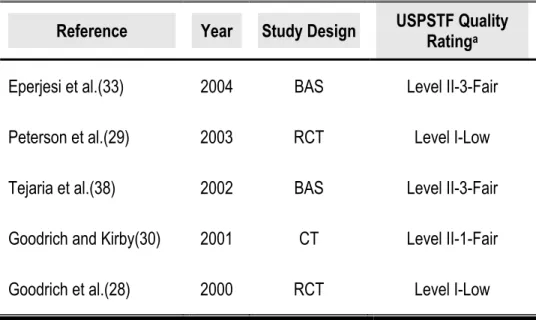
The quality of each included study was rated using standard criteria as proposed by the U.S. Preventive Services Task Force
(USPSTF).(39) The quality of included studies was not high. No
included studies, not even the RCTs, were completely protected from all potential confounders. Three RCTs were rated as USPSTF
Level I-Low,(27-29) one RCT was rated as Level I-Fair,(26)
one non-randomized controlled trial was rated as Level II-1-Fair,(30) one non-randomized controlled trial was rated as Level II-1-Low,(31) six before-after-studies were rated as Level II-3-Fair,(33-38) and
one before-after-study was rated as Level II-3-Low.(32) This finding is in concordance with the findings of the Lewin Group report and
five other systematic reviews that have been published since 2000.(21-25)
The generalizability of each included study to the elderly Medicare population was estimated from study enrollment criteria and the reported characteristics of the patients who were actually enrolled in the study. With the exception of one study,(38) which was excluded from our analysis for reasons of poor generalizability, the
generalizability of the findings of the included studies to the elderly Medicare population were judged to be “Fair.”
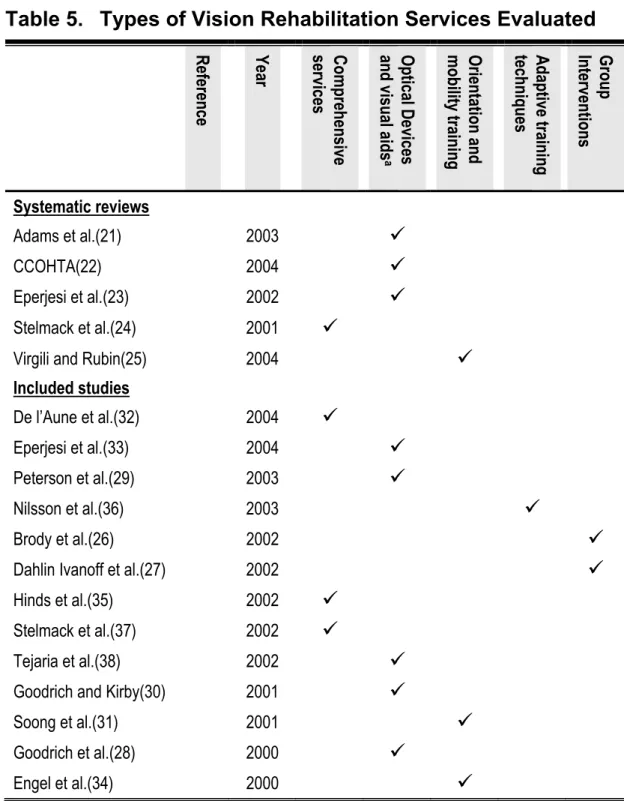
The included studies evaluated the effectiveness of several different vision rehabilitation services. These included comprehensive
rehabilitation services,(32,35,37) optical aids and low-vision
devices,(28-30,33,38) orientation and mobility training,(31,34) training in the use of adaptive techniques (eccentric viewing),(36) and group intervention programs.(26,27)
Comprehensive Vision Rehabilitation Programs
One systematic review published since January 2000 assessed the effectiveness of comprehensive rehabilitation programs. Stelmack et al.(24) concluded that exposure to vision rehabilitation services leads to improvements in self-reported functional status and quality of life. This conclusion, however, was based on data from a small evidence base consisting of four studies.
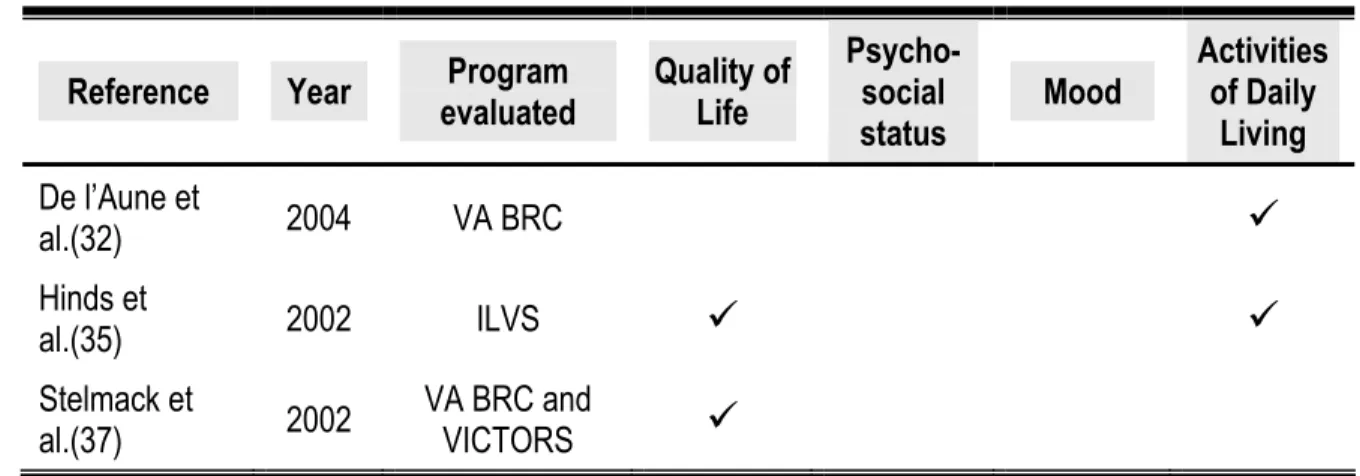
Our searches identified three studies published since January 2000 that evaluated the effectiveness of three different comprehensive
vision rehabilitation programs and met the a priori inclusion criteria for
this assessment.(32,35,37) All three studies utilized a before-after design (one study: USPSTF Quality Rating: Level II-3-Low;
two studies: USPSTF Quality Rating: II-3-Fair). The results of these studies, though methodologically weak, suggest that individuals with low vision do benefit from exposure to comprehensive vision
rehabilitation services.
One cannot draw evidence-based conclusions pertaining to the
relative effectiveness of the three comprehensive vision rehabilitation service models evaluated, or draw conclusions about the relative effectiveness of different staffing models. The available evidence does not allow one to determine the relative effectiveness of the different components of the programs assessed or determine the optimal frequency and intensity of service provision. Finally, evidence from included studies does not allow one to draw conclusions
etiology of vision loss, and the prognosis for an individual patient’s future vision following exposure to comprehensive vision
rehabilitation services.
Optical Devices and Visual Aids
Three relevant systematic reviews have been published since January 2000.(21-23) Of these, one evaluated evidence on the effectiveness of an array of optical devices and low-vision aids that are used in VA vision rehabilitation programs,(21) one evaluated the effectiveness of optical filters,(23) and the third evaluated evidence on the effectiveness of an implantable miniature telescope.(22) All three systematic reviews failed to reach any evidence-based conclusions because of a paucity of available data.
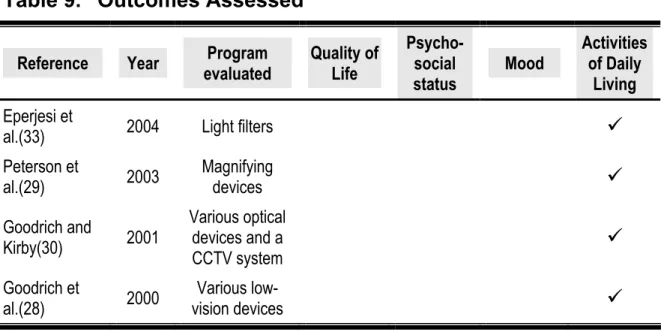
Our searches identified five studies published since January 2000 that evaluated the effectiveness of optical aids or low-vision devices
and met the a priori inclusion criteria for this
assessment.(28-30,33,38) One of these studies was excluded from further consideration because of poor generalizability to the Medicare
population.(38) The remaining studies were small (N ranged from 22 to 90), fair-to-low quality (USPSTF Quality Ratings ranged from I-Low to II-3-Fair), laboratory-based studies.(28-30,33)
All four included studies showed that the prescription of optical devices and low-vision aids improved reading performance. One included study examined the question of the optimum number of training sessions required following prescription of low-vision aids.(28) This study found that five training sessions, followed by
practice, was optimal. Because all four studies were directly
supervised and performed by optometrists, one is precluded from drawing conclusions about how different supervisory and staffing models may influence outcome.
Orientation and Mobility Training
One systematic review published since January 2000 attempted to evaluate the effectiveness of orientation and mobility training. Virgili and Rubin(25) searched the Cochrane Central Register of Controlled Trials Medline, Embase, and LILACS up to September 2002 for
randomized and quasi-randomized controlled trials. No randomized or quasi-randomized controlled trials were identified by their searches so no conclusions about the effectiveness of orientation and mobility training were drawn.
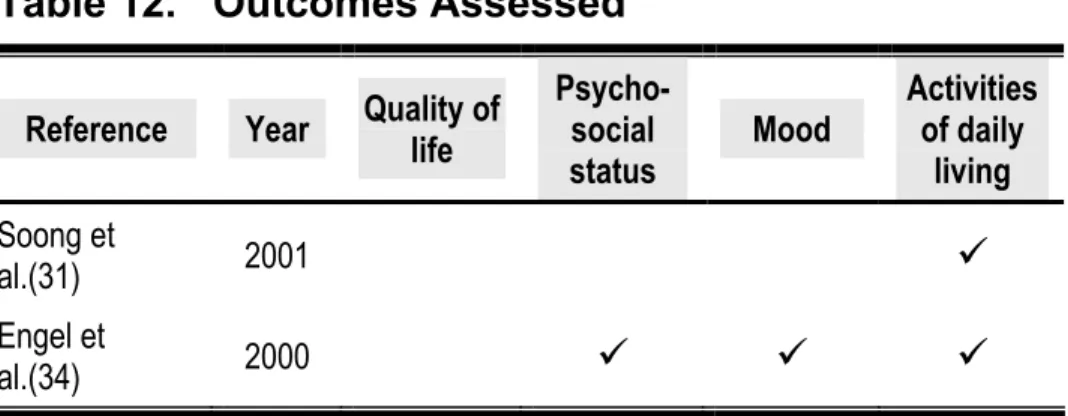
Evidence on the effectiveness of orientation and mobility from two studies(31,34) that met the a priori inclusion criteria for this
assessment is inconclusive. One non-randomized controlled study (USPSTF Quality Rating: II-1-Fair) did not provide evidence
supporting the hypothesis that orientation and mobility training leads to improvements in mobility.(31) The other study, which utilized a before-after study design (USPSTF Quality Rating: II-3-Fair), found that exposure to an orientation and mobility-based program resulted in a number of improvements across a number of domains of
psychosocial status.(34) Whether the differences in the findings of the two included studies are the result of differences in study quality,
differences in service protocol, differences in enrolled patients, or differences in the outcomes measured is not known.
In summary, the effectiveness (or lack of effectiveness) of orientation and mobility training has yet to be demonstrated by a well-designed study that has utilized validated instruments to measure a patient-oriented outcome. In addition, the available data does not allow one to draw evidence-based conclusions regarding the relative
effectiveness of different orientation and mobility training programs or the optimal frequency and intensity of administration of such services. Nor does the available evidence allow one to draw conclusions
regarding the relationship between the pattern of vision loss, the etiology of vision loss, and the prognosis for an individual patient’s future vision following exposure to orientation and mobility training programs.
Adaptive Techniques Training
Our searches identified one before-after study (USPSTF Quality Rating: II-3-Fair) that evaluated the effectiveness of adaptive techniques training and met the a priori inclusion criteria for this assessment.(36) This Swedish study used a computer program in conjunction with a scanning laser ophthalmoscope (SLO) to teach individuals with age-related macular degeneration (AMD) to use
eccentric retinal loci for reading. The study investigators found that 18 of 20 enrolled individuals learned to use eccentric viewing for the purposes of reading. Among these 18 individuals, reading speeds increased significantly from baseline (p <0.001). Because no
long-term followup data are available, however, it is not clear whether these improvements in reading performance can be maintained over time.
Available data does not allow one to draw evidence-based
conclusions regarding the relative effectiveness of different adaptive training techniques. Nor does the available evidence allow one to draw conclusions regarding either the optimal frequency and intensity of administration of eccentric viewing training, or the relationship between the pattern of vision loss, the etiology of vision loss, and the prognosis for an individual patient’s future vision following exposure to the program.
Group Intervention Programs
The Lewin Group report identified four studies that evaluated the effectiveness of group intervention programs. Based on the findings of these studies, the Lewin Group report stated that group
intervention “…appears to be effective, based on attitudinal outcomes and perceptions of activity levels.”(2)
Our searches identified two relevant articles describing two RCTs that
were published since January 2000 and met the a priori inclusion
criteria for this assessment.(26,27) One of these articles presented updated data emanating from a RCT that was cited in the Lewin Group report.(27) These updated data, along with data from the remaining RCT, lend support to the conclusions of the Lewin Group report. Both studies found that exposure to a group intervention program led to significant improvements in patient outcomes. Brody
et al. (USPSTF Quality Rating: I-Fair) found that quality of life and mood among individuals with low vision (all enrollees had AMD) who had been exposed to their self-management group intervention
program were significantly improved when compared to controls.(26) Dahlin Ivanoff et al. (USPSTF Quality Rating: I-Low) found that
exposure to their group health education program led to significant improvements across a number of activities of daily living.
Available data does not allow one to draw evidence-based
conclusions regarding the relative effectiveness of the two group intervention programs, the optimal frequency and intensity of these programs, or the most effective staffing model. Nor does the evidence allow one to draw evidence-based conclusions regarding the
relationship between the pattern of vision loss, the etiology of vision loss, and the prognosis for an individual patient’s future vision
following exposure to group intervention programs.
Specific Aim 4: The personnel that provided services in the studies that are included in this report covered the entire gamut of vision rehabilitation personnel identified previously. Rehabilitation services described by the included studies were usually (11 out of 13 studies)
directly supervised by a Medicare-defined physician.3
Because of limitations in the literature, it is not possible to provide an analysis of how the outcomes of the included studies might be
3 Relevant Medicare-defined physicians who include doctors of medicine; doctors of osteopathy; and doctors of optometry; see Appendix A and CMS Medical Benefit Policy Manual..(189)
generalizable to the question of whether providers, specifically the three types of providers specified in the law (low-vision therapists, orientation and mobility specialists, and rehabilitation teachers), can provide quality services in the absence of direct physician supervision.
The only direct evidence, albeit weak, to demonstrate that quality services can be provided by low-vision therapists, orientation and mobility specialists, and rehabilitation teachers in the absence of direct physician supervision comes from two before-after-studies (USPSTF Quality Ratings: II-3-Fair and II-3-Low) both of which evaluated the effectiveness of the Veterans Affairs Blind
Rehabilitation Centers program.(32,37) Although Medicare-defined physicians are involved in this rehabilitation program (they are responsible for the clinical management of enrolled individuals and are members of the rehabilitation team that develops an
individualized care plan for new enrollees), they do not supervise the implementation of vision rehabilitation services directly. The
implementation of the care plan is instead coordinated by a
rehabilitation specialist (orientation and mobility specialists, vision rehabilitation teachers, and low-vision therapists). Both De l’Aune et al.(32) and Stelmack et al.(37) demonstrated that exposure to this service improves the ability of “blind” veterans to perform activities of daily living, which in turn enhances their quality of life.
SCOPE OF REPORT
Section 645 (a) of the Medicare Prescription Drug, Improvement, and Modernization Act of 2003 requires that the Secretary of Health and Human Services conduct a study to determine the feasibility and advisability of providing for payment for vision rehabilitation services furnished by vision rehabilitation professionals.(1) The Secretary has been instructed to report on this study and provide recommendations for such legislation or administrative action as the Secretary
determines to be appropriate.
On February 10th 2004, AHRQ issued a Statement of Work
(SOW)(40) contracting ECRI to update a previous report published in October 2002 titled, “Vision Rehabilitation: Care and Benefit Plan Models.”(2)
The SOW specified that ECRI should update and extend the Lewin Group report by systematically reviewing new evidence on the
potential of vision rehabilitation services to improve the quality of life and functioning of the elderly with low vision or blindness. As part of fulfilling this contract, ECRI was instructed to address the following Specific Aims:
1. Estimate the number of elderly persons with vision loss that might benefit from vision rehabilitation services. Review published
estimates if available. If not, use sources of data such as the National Health Interview Survey or other sources as appropriate. Discuss how available data on prevalence relate to studied
indications on vision rehabilitation and estimate how many Medicare beneficiaries might benefit from vision rehabilitation. 2. Update the Lewin report by reviewing any additional information
regarding the training of vision rehabilitation personnel in the United States, as well as any practice guidelines or other
documentation regarding accepted practice. Provide a summary of organizations that provide training and credentialing of vision
rehabilitation professionals. Provide a summary of different state statutory or regulatory requirements governing both the
credentialing of providers and the provision of services.
3. Update the Lewin report by systematically reviewing new evidence on the effectiveness of vision rehabilitation services. Include
information on:
a. The types of providers and settings that were used in studies b. The components and frequency of vision rehabilitation
services provided in the studies
c. The patient population that was studied, including age, whether community dwelling or in nursing homes, and
information about the extent and characteristics of vision loss d. Validity of the outcomes selected for measurement
e. Methods of measurement of outcomes
g. The possible role of the pattern of vision loss, the etiology of vision loss, and the prognosis for an individual patient’s future vision on the benefits of vision rehabilitation
4. Summarize the types of providers that provided the services in the clinical trials, whether the services were provided under physician supervision, and the outcomes achieved. Provide an analysis of how these results might be generalizable to the question of whether providers, specifically the three types of providers
specified in the law (low-vision therapists, orientation and mobility specialists, and rehabilitation teachers), can provide quality
BACKGROUND
In this section we provide background information on low vision, blindness, and vision rehabilitation services. The purpose of this section is two-fold: 1) to provide context for the research syntheses presented later in this report and, 2) to address Specific Aim 1 and
Specific Aim 2 as laid out in the section headed, “Scope of Report.”
Low Vision and Blindness
Definitions of Low Vision and Blindness
There is no universal consensus on the definitions for low vision and blindness.(2,3,21,41) In its broadest sense, low vision can be defined as any visual impairment that results in disability and that cannot be corrected medically, surgically, or with conventional eyeglasses. ICD-9-CM defines low vision and blindness using standard measures of visual acuity and visual field diameter (see Table 1).
Table 1. ICD-9-CM Definitions of Low Vision and Blindness
Definition Visual Acuitya Visual Fielda
Moderate visual impairment <20/60 to 20/160 Not considered
Severe visual impairment ≤20/200 to 20/400 Visual Field ≤20 degreesb
Profound visual impairment <20/400 to 20/1000 Visual Field ≤10 degreesb
Near-total vision loss ≤20/1250
Total Blindness No perception of light
a In better seeing eye
The ICD-9-CM threshold criteria that define an individual as having low vision are an uncorrectable and irreversible visual acuity of less
than 20/604 in the better seeing eye, or a visual field of 20 degrees or
less in the better seeing eye. In the U.S., the threshold for a diagnosis of low vision is often considered to be a visual acuity of less than 20/40 in the better seeing eye. The use of this higher visual acuity in the definition of low vision is based on the fact that a visual acuity of 20/40 in the better seeing eye is the criterion used by many states for the provision of an unrestricted driver’s license. Many experts
contend that this latter threshold, without other limitations in visual functioning, is an inappropriate threshold with which to define low vision.(42) It is argued that aside from the limitation of being unable to drive, individuals with this visual acuity rarely suffer significant
reductions in their ability to perform other functions and are,
therefore, unlikely to be candidates for vision rehabilitation services. This opinion is mirrored by a recent Medicare Program Memorandum (Appendix A) that states that, in the absence of visual field
disturbance, individuals will not meet Medicare’s suggested medical necessity requirements unless their visual acuity is less than 20/60 in the better seeing eye.
Individuals who meet the ICD-9-CM criteria for severe visual
impairment (a visual acuity of 20/200 or less or a visual field of 20 degrees or less in the better seeing eye) meet the minimum requirement for classification as legally blind in the U.S., and are,
therefore, entitled to disability benefits. The terms “severe visual impairment” and “profound visual impairment” are preferred by the American Academy of Ophthalmology (AAO) to the term “legal blindness” for the purposes of classifying individuals with low vision and blindness because the former terms more accurately reflect the fact that some residual vision remains in patients with these degrees of vision loss.(14) AAO suggests that, in the context of vision
rehabilitation, the term “blindness” be reserved for those individuals with no residual vision at all in the better seeing eye (i.e. complete blindness).(14)
Recognizing that the ICD-9-CM definitions for low vision and blindness do not encompass all patients with uncorrectable and irreversible visual impairment severe enough to limit an individual’s daily activities and functioning, Medicare’s current suggested medical necessity criteria (Appendix A) expands eligibility for vision
rehabilitations services beyond the ICD-9-CM definitions for low vision and blindness (ICD-9-CM codes beginning with the prefix
3695). Medicare has suggested that individuals with the following
visual field “disturbances”6 should also be considered eligible for
vision rehabilitation services: a central scotoma in the better seeing eye (ICD-9-CM code: 368.41), generalized contraction or constriction
5 ICD-9 codes for “low vision” are coded 369.XX, where the prefix 369 relates to the diagnosis of ‘low vision or blindness” and the suffix XX relates to the severity of the low vision in both eyes.
6 ICD-9-CM codes for ‘visual disturbances” are distinct from ICD-9 codes for ‘low vision.” ICD-9 codes for the diagnosis of a “visual disturbance” are allocated the prefix 368 and the suffix .4X identifies the type of visual disturbance as being a visual field disturbance.
of the visual field in the better seeing eye (ICD-9-CM code: 368.45), homonymous bilateral visual field defects (ICD-9-CM code: 368.46) or heteronymous bilateral visual field defects (ICD-9-CM code: 368.47). This extension of the eligibility for vision rehabilitation
services beyond the ICD-9-CM definitions of low vision and blindness has important implications for the accuracy of current estimates of the number of individuals in the elderly Medicare population who might benefit from vision rehabilitation services. These implications are
discussed below in the section headed, “Estimate of Number of
Individuals in Elderly Medicare Population who Might Benefit from Vision Rehabilitation Services.”
Causes of Low Vision and Blindness
Low vision and blindness are not caused by a single disease. Rather, they can result from a plethora of different ophthalmologic and
neurological disorders. These disorders include, but are not limited to, age-related macular degeneration (AMD), glaucoma, cataract,
diabetic retinopathy, central retinal vein occlusion (CRVO), retinitis pigemtosa, corneal damage, stroke, atherosclerosis, temporal
arteritis, trauma, and tumors. By far the most prominent pathologies underlying low vision and blindness among the elderly Medicare
population are age-related macular degeneration (AMD)7, glaucoma,
and diabetic retinopathy.(4-12) The impact of each of these latter eye diseases on functional vision is summarized in Table 2.
Table 2. Primary Causes of Low Vision in the Elderly
Disease Clinical Presentation Associated Disabilities
AMD Reduced visual acuity
Loss of central vision (central scotoma)
Diabetic Reduced visual acuity retinopathy Scattered central scotoma
Peripheral and mid-peripheral scotoma
Macula edema
Glaucoma Degeneration of the optic disc Loss of peripheral vision (constricted visual field) Cataracta Reduced visual acuity
Light scatter Sensitivity to glare Image distortion
Difficulty reading, inability to recognize faces, distortion or disappearance of central vision, reduced color vision, reduced contrast perception, mobility difficulties related to loss of depth and contrast cues. Difficulty with tasks requiring fine-detail vision such as reading, distorted central vision, fluctuating vision, loss of color perception, mobility problems due to loss of depth and contrast cues. In severe cases, total blindness can occur.
Mobility and reading problems due to restricted visual fields, people suddenly appearing in the visual field. In severe cases, total blindness can occur. Remedied by lens extraction in 90% of cases. If not, difficulty with detail vision, difficulty with bright and changing light levels, reduced color vision, decreased contrast perception, mobility difficulties related to loss of depth and contrast cues.
Adapted from Pazel(43)
a Vision loss experienced by most individuals with cataract can be reversed. Consequently, many elderly individuals with cataract will not be considered as candidates for vision rehabilitation.
Another common cause of visual impairment among the elderly is cataract. In most cases, however, vision impairment resulting from cataract can usually be successfully corrected through the surgical removal of the cataractous lens. As a consequence, many (but not
all8) individuals with visual impairment resulting from cataract will not
meet current definitions for low vision or blindness (irreversible and
8 Approximately 10% of individuals with cataract may not be appropriate candidates for cataract surgery because of health issues or concerns related to the potential progression of diabetic retinopathy or glaucoma secondary to surgery.
uncorrectable visual impairment) and will not usually be considered candidates for vision rehabilitation services.
Consequences of Low Vision or Blindness
Low vision and blindness have a significant impact on the physical and mental well-being of the affected individual. Individuals with impaired vision are less able to perform activities of daily
living,(24,44-51) are less mobile,(24,48,50) are more isolated,(44,50) suffer higher rates of depression,(24,52-59) and consequently, have a reduced overall quality of life(24,51,52,60) when compared to their normal-sighted counterparts. In addition, patients with visual
impairment have higher mortality rates,(61-63) and are more prone to accidents and falls.(62,64-71) As a consequence, elderly individuals with low vision are more prone to injuries than their normal-sighted counterparts.(62,68,72,73) For example, low vision is a
well-documented risk factor for hip fractures in the elderly resulting from falls.(73-75)
Estimate of Number of Individuals in Elderly Medicare Population who Might Benefit from Vision Rehabilitation Services
This section addresses Specific Aim 1 of this report (see “Scope of
Report”) and aims to provide an estimate of the number of individuals in the elderly Medicare population who might benefit from vision
rehabilitation services. At the present time, the precise number of individuals in the elderly Medicare population who meet Medicare’s
suggested eligibility criteria for vision rehabilitation services is not known; only rough estimates are available.
Our searches identified eleven potential sources of relevant published data. These sources are:
• The National Health Interview Survey (NHIS).(76,77)
• The Lighthouse Survey.(78)
• The 1988 to 1994 National Health and Nutritional Examination
Survey (NHANES III).(79)
• The Prevent Blindness America/National Eye Institute
survey.(80)
• The Medical Expenditure Panel Survey (MEPS).(81)
• The Framingham Eye Study.(8-10)
• The Mud Creek Valley Eye Survey.(11)
• The Beaver Dam Eye Study.(4)
• The Salisbury Eye Evaluation.(12)
• The Baltimore Eye Survey.(5-7)
• Proyecto VER (Vision Evaluation and Research).(82)
The Lewin Group report cited estimates of the prevalence of low vision and blindness from two sources; the National Health Interview Survey and Lighthouse International.(2) These sources, however, along with prevalence estimates emanating from the NHANES III, the Prevent Blindness America/National Eye Institute survey and the MEPS, do not provide accurate estimates of the number of elderly
individuals who will meet Medicare’s current suggested medical necessity criteria for vision rehabilitation services because they were self-assessment surveys. The problem with estimating the prevalence of visual impairment from self-assessment surveys is that the cause of the survey respondent’s poor vision is unknown. As a
consequence, prevalence estimates from these studies include an unknown number of individuals with reversible visual impairments such as uncorrected refractive error or cataract, leading to
overestimates of low vision in the elderly population.
The remaining six studies (the Baltimore Eye Survey, the Beaver Dam Eye Study, the Framingham Eye Study, the Mud Creek Valley Eye Survey, the Salisbury Eye Evaluation, and Proyecto VER) avoided the primary problem associated with self-assessment surveys by screening subjects for visual impairment. A thorough ophthalmic examination of all individuals who were found to have a visual impairment was performed, and those individuals with
impairments that could be corrected through refraction were accounted for.
Although, these latter six studies are currently the most reliable
primary sources of data on the prevalence of visual impairment in the U.S., as individual studies they are of limited value in addressing Specific Aim 1. This is because the prevalence estimates that emanate from them differ considerably across studies. These disagreements appear to be the consequence of differences in
methodology and differences in the definitions of low vision that were used.
Robert Massof of the Lions Vision Research and Rehabilitation Center (Johns Hopkins University School of Medicine) recently developed a model based on prevalence data extracted from five of the six population-based studies listed above that screened for visual impairment (the Baltimore Eye Survey, the Beaver Dam Eye Study, the Framingham Eye Study, the Mud Creek Valley Eye Survey, and the Salisbury Eye Evaluation). The purpose of developing this model was to understand the sources of disagreement between studies and to attempt to obtain a consensus estimate of the prevalence rates of Medicare-aged Americans who might benefit from low-vision
services.(3)
Exploration of the heterogeneity in prevalence estimates reported by the five population-based studies that were considered by Massof found that the two major reasons for these between-studies
differences in prevalence estimates were: 1) different criteria were used to measure best-corrected visual acuity in different studies and, 2) different studies utilized different age ranges in the oldest age category. When Massof corrected for these differences, the results of all but one of the prevalence rate studies (the Mudd Creek Valley Study), fell on the same line on a plot of prevalence versus age. Massof argued that the prevalence data from the Mudd Creek Valley study could not be reconciled with that obtained from the remaining four studies because the prevalence of cataracts in this impoverished population was exceedingly high.
In order to estimate the prevalence of low vision among U.S. elders, Massof applied his model to census data collected for the year 2000.
His analysis estimated that approximately 1,275,000 whites and 230,000 blacks over the age of 45 years will have a best-corrected visual acuity of less than 20/60 (the ICD-9-CM threshold for low vision). When looking at the Medicare-aged population, Massof estimated that approximately 1,120,000 whites and 135,000 blacks would meet the ICD-9-CM definitions for low vision and blindness. This represents approximately 3.7% and 4.9% of the total white and black Medicare-aged population, respectively.
The prevalence estimates presented above include an unknown number of individuals with visual impairment that results from
potentially correctable cataract. Massof estimated that approximately 15% to 20% of cases included in the prevalence estimates presented above may have cataract. Because vision loss due to cataract can, in most cases, be corrected surgically, not all individuals with cataract should be counted in estimates of the prevalence of patients who would be considered to be potential candidates for vision
rehabilitation. Assuming that Massof’s estimates of the number of cases of cataract are reasonable, we estimate that the total number of individuals in the U.S. who might be considered as potential
candidates for low-vision rehabilitation services falls within the range of 1,004,000 to 1,066,750. Thus, adjusting for the prevalence of cataract, we estimate that approximately 3.3% to 3.5% of Medicare-aged whites (896,000 to 952,000 individuals) and 3.8% to 4.1% of Medicare-aged blacks (108,000 to 114,750 individuals) are potential candidates for low-vision rehabilitation services.
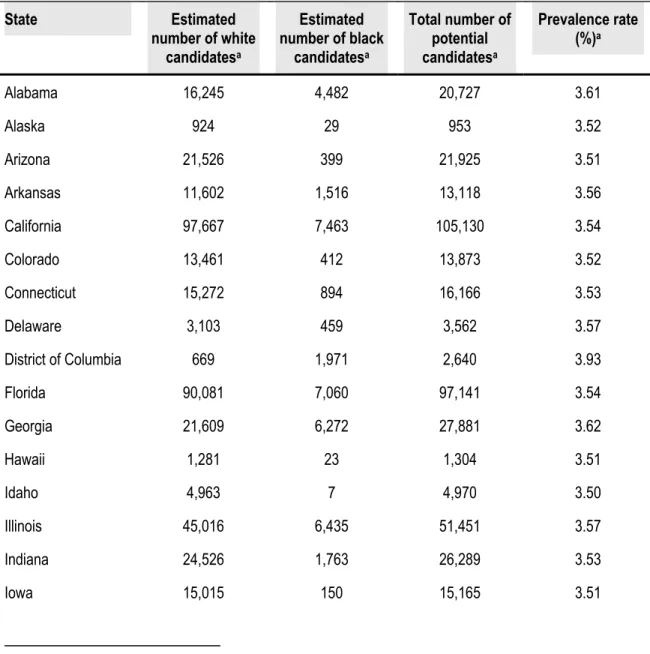
Using age and race data for each state obtained from the 2000 U.S. Census, we estimated the number (and prevalence) of Medicare-aged individuals who are potential candidates for vision rehabilitation services. These state-by-state prevalence data, which have been
adjusted for cases of correctable cataract9, are presented in Table 3.
Table 3. State-by-State Low Vision and Blindness Prevalence
Estimates
State Estimated Estimated Total number of Prevalence rate
number of white candidatesa number of black candidatesa candidatesa (%)a Alabama 16,245 4,482 20,727 3.61 Alaska 924 29 953 3.52 Arizona 21,526 399 21,925 3.51 Arkansas 11,602 1,516 13,118 3.56 California 97,667 7,463 105,130 3.54 Colorado 13,461 412 13,873 3.52 Connecticut 15,272 894 16,166 3.53 Delaware 3,103 459 3,562 3.57 District of Columbia 669 1,971 2,640 3.93 Florida 90,081 7,060 97,141 3.54 Georgia 21,609 6,272 27,881 3.62 Hawaii 1,281 23 1,304 3.51 Idaho 4,963 7 4,970 3.50 Illinois 45,016 6,435 51,451 3.57 Indiana 24,526 1,763 26,289 3.53 Iowa 15,015 150 15,165 3.51 potential
potential
State Estimated Estimated Total number of Prevalence rate
number of white candidatesa number of black candidatesa candidatesa (%)a Kansas 11,771 489 12,260 3.52 Kentucky 16,577 1,065 17,642 3.53 Louisiana 13,654 4,808 18,462 3.64 Maine 6,355 11 6,366 3.50 Maryland 16,401 4,468 20,869 3.61 Massachusetts 28,274 955 29,229 3.52 Michigan 37,649 4,931 42,580 3.56 Minnesota 20,229 228 20,457 3.51 Mississippi 8,903 3514 12,417 3.65 Missouri 24,179 2199 26,378 3.54 Montana 4,086 5 4,091 3.50 Nebraska 7,861 181 8,042 3.51 Nevada 6,780 387 7,167 3.53 New Hampshire 5,107 15 5,122 3.50 New Jersey 33,772 3,896 37,668 3.55 New Mexico 6,232 116 6,348 3.51 New York 70,574 10,723 81,297 3.57 North Carolina 27,964 6,285 34,249 3.60 North Dakota 3,240 3 3,243 3.50 Ohio 47,810 5,042 52,852 3.55 Oklahoma 14,068 807 14,875 3.53 Oregon 14,640 148 14,788 3.51 Pennsylvania 61,977 5,030 67,007 3.54 Rhode Island 5,056 119 5,175 3.51 South Carolina 13,174 4,263 17,437 3.63 South Dakota 3,660 5 3,665 3.50
State Estimated Estimated Total number of Prevalence rate
number of white candidatesa number of black candidatesa candidatesa (%)a Tennessee 21,731 3,054 24,785 3.56 Texas 61,478 7,220 68,698 3.55 Utah 6,385 28 6,413 3.50 Vermont 2,681 5 2,686 3.50 Virginia 22,628 5,022 27,650 3.60 Washington 21,336 428 21,764 3.51 West Virginia 9,356 293 9,649 3.52 Wisconsin 23,697 653 24,350 3.51 Wyoming 1,951 10 1,961 3.50 Puerto Rico 12,536 1278 13,814 3.55 potential
a Estimates calculated by ECRI using overall U.S. prevalence estimates for blacks and whites emanating from Massof’s model and age, race and state population data extracted from the 2000 U.S. census database available online at http://factfinder.census.gov/home/saff/main.html?_lang=en
Although Massof’s model provides the best available estimates of the prevalence of low vision and blindness among the current Medicare population, the generalizability of these estimates to the specific
question, “How many Medicare beneficiaries might benefit from vision rehabilitation services?” cannot be determined. There are several reasons for this:
• First, the prevalence estimates calculated using Massof’s
model were based on data from epidemiological studies that were not designed to determine the prevalence of individuals who meet Medicare’s current eligibility criteria for vision
rehabilitation services. Instead, these studies were designed to provide an estimate of the prevalence of visual impairment in
selected U.S. populations where the definition of visual impairment was usually based solely on measures of visual acuity. Disability resulting from visual impairment is not entirely dependent upon visual acuity. Visual field loss and other
impairments can also lead to disability. For the purposes of addressing Specific Aim 1 then, available data on the
prevalence of visual impairment will likely underestimate the true prevalence of low vision in the U.S.
• Second, Medicare’s current suggested medical necessity
criteria for vision rehabilitation services extend beyond the ICD-9-CM definitions of low vision and blindness (ICD-9-CM code: 369.xx). These criteria also include individuals with a number of uncorrectable and irreversible visual field defects that fall under the ICD-9 diagnostic category of a “visual disturbance” (ICD-9-CM code: 368.4x). Massof’s estimates did not take into account this latter diagnostic category. The consequence of this, is that, even if prevalence data from the population-based studies listed above were to provide an accurate estimate of the prevalence of low vision in the U.S. (as defined by ICD-9-CM definitions), the estimates emanating from Massof’s model will likely underestimate the true
prevalence of low vision and blindness as defined by Medicare’s current suggested eligibility criteria.
• Third, the studies used to develop Massof’s model focused on
white populations. Although two of the studies did evaluate African Americans, none evaluated any other racial groups.
Consequently, the generalizability of the estimates derived from the Massof model to the elderly Medicare population is unclear.
In April 2004, the Eye Diseases Prevalence Research Group
(EDPRG)(83) published their estimates for low vision and blindness in the U.S. These estimates emanated from a logistic regression model derived from pooled prevalence data collected in seven U.S. and non-U.S. population-based studies. Like Massoff, EDPRG
applied their model to demographic data from the 2000 U.S. Census and estimated that approximately 2.9 million individuals over the age of 65 met their definition for low vision or blindness in the U.S. This prevalence estimate is approximately twice that estimated by
Massoff.
Of the two models mentioned above, we believe that it is the Massoff model that provides the best estimates of the number of individuals in the elderly U.S. Medicare population who might benefit from vision rehabilitation services. There are three reasons for this:
• First, the EDPRG defined low vision as being a best corrected
visual acuity of 20/40 or less in the better seeing eye. In the absence of any other visual disturbance, individuals are not normally considered to be appropriate candidates for vision rehabilitation unless their visual acuity falls below 20/60 in the better seeing eye. Of particular importance to Specific Aim 1 is the fact that individuals with visual acuities of 20/40 or less and who do not have any other visual field disturbances will not meet Medicare’s suggested medical necessity criteria as laid
out in the 2002 PM presented in Appendix A. Consequently, the prevalence figures presented by the EDPRG will grossly
overestimate the number of individuals in the U.S. Medicare population who would be considered as appropriate candidates for vision rehabilitation services.
• Second, only four of the seven population-based studies that
were used to develop the EDPRG model were U.S. based (the Baltimore Eye Survey, the Beaver Dam Eye Study, the Salisbury Eye Evaluation, and Proyecto VER). The remaining three studies were performed in Australia (the Blue Mountains Eye Study(60,84-87) and the Melbourne Vision Impairment Project(60,88)) and in Holland (the Rotterdam Study(89)). Clinical and surgical practices and access to care differ
significantly from the U.S. in these countries. These differences may in turn influence the prevalence (and cause specific
distribution of visual impairment).
• Third, the prevalence estimates derived by the EDPRG include
individuals who have cataract. For example, the study authors reported that 47% of the individuals with low vision in the Proyecto VER study had cataract. Because vision loss due to cataract can, in most cases, be corrected surgically, not all individuals with cataract should be counted in estimates of the prevalence of patients who would be considered to be potential candidates for vision rehabilitation.
Vision Rehabilitation Services
Vision rehabilitation services aim to maximize the use of any residual vision that an individual might have and provide practical adaptations that reduce the disabilities associated with low vision or blindness. Ideally, vision rehabilitation services provide a continuum of care beginning with medical and surgical intervention to control the progression of the underlying disease that has caused vision loss. This may be followed by the prescription of appropriate low-vision devices and access to appropriate low-vision services. Low-vision services for the elderly include:
• Training in the use of low-vision devices
• Rehabilitation teaching
• Rehabilitation counseling
• Orientation and mobility training
• Independent living support
The desired outcome for those who enter a vision rehabilitation program is that they will attain the maximum function of any residual vision that they may have, increase their level of functional ability, increase their degree of independence, and, as a consequence, experience an improvement in their quality of life.
Despite the existence of a number of vision rehabilitation services in the U.S., access to these services has been limited. The reasons for this include inadequate referral rates from optometrists and
impaired concerning the availably of services,(92) and financial and physical barriers.(93) Consequently, access to, and the adoption of, vision rehabilitation services has, to date, been suboptimal.
Training and Credentialing of Vision Rehabilitation Personnel
This section addresses Specific Aim 2 of this report (see “Scope of
Report”) wherein we provide the reader with information regarding the types of personnel that typically provide vision rehabilitation services in the United States along with details of their training and
credentialing.
Comprehensive vision rehabilitation services are interdisciplinary. Most vision rehabilitation programs provide access to a number of different vision rehabilitation personnel. These personnel include both licensed (ophthalmologists, optometrists, occupational therapists, psychologists and counselors, and social workers) and unlicensed personnel (low-vision therapists, vision rehabilitation teachers, and orientation and mobility specialists). Below, we provide a summary of the training and credentialing of personnel who typically provide vision rehabilitation services.
Licensed Vision Rehabilitation Personnel
Ophthalmologists
An ophthalmologist is a licensed medical doctor with a specialization in vision and ocular health. As qualified physicians, ophthalmologists
meet the requirements of a Medicare-defined physician.10
Consequently, vision rehabilitation planning and coordination activities performed by these professionals may qualify for reimbursement from Medicare.
There are approximately 132 ophthalmology residency programs in the U.S.(94) These residency programs are accredited by the
Accreditation Council for Graduate Medical Education (ACGME), which ensures that the resident’s clinical experience includes
exposure to the entire spectrum of ophthalmic diseases. Low vision is one of the clinics specifically mentioned on the program information forms that the Residency Review Committee for ophthalmology uses in its evaluation of the nation’s residency programs in ophthalmology.
Optometrists
A doctor of optometry is a licensed, independent primary health care provider. Doctors of optometry meet the requirements of a Medicare-defined physician. Seventeen universities in the U.S. offer programs in optometry that are accredited by the Accreditation Council on Optometric Education (ACOE). At the present time, there is no
requirement that an optometric program provide a specific curriculum in rehabilitation optometry. However, vision rehabilitation is a track that is included in the programs of all accredited optometry schools and questions on vision rehabilitation are included in the National Board of Examinations that are taken by all optometry students.(94)
10 Relevant Medicare-defined physicians who include doctors of medicine; doctors of osteopathy; and
The content outline for the National Board examinations can be found at the National Board of Examiners in Optometry Web site
(www.optometry.org).
Accredited residencies are available for optometrists who are
interested in vision rehabilitation.(95) Many of these residencies are located within Department of Veterans Affairs Blind Rehabilitation Centers and Visual Impairment Centers to Optimize Remaining Sight programs. In addition, many optometry residents in ocular disease, geriatrics, primary care, and pediatric residency programs will often receive direct experience in patient care during low-vision rotations.
Occupational Therapists
Occupational therapists are licensed professionals with expertise in the cognitive, sensory, physical, and psychological aspects of
disability and aging. Under current Medicare law, services provided by these personnel may qualify for reimbursement through Medicare provided these services are rendered under the supervision of an ophthalmologist or optometrist.
Occupational therapists have a bachelor’s degree or higher degree in occupational therapy. Beginning in 2007, however, a master’s degree or higher will be the minimum educational requirement.(96) To obtain a license, applicants must graduate from an accredited educational program and pass a national certification examination administered by the National Board for Certification in Occupational Therapy
(NBCOT)11.(97,98) Those who pass the exam are awarded the title
“Occupational Therapist Registered (OTR).”
In 2003, entry-level education was offered in 38 bachelor’s degree programs, 3 post-baccalaureate certificate programs for students with a degree other than occupational therapy, and 86 entry-level master’s degree programs. There were 48 programs that offered a combined bachelor’s and master’s degree and 5 offered an entry-level doctoral degree. Most schools have full-time programs, although a growing number also offer weekend or part-time programs.(96)
Occupational therapy coursework typically includes physical, biological, and behavioral sciences and the application of
occupational therapy theory and skills (See Table B-1 of Appendix B for an example). Completion of six months of supervised fieldwork is also required before graduation.
At the present time, formal training in the rehabilitation of individuals with low vision or blindness is not part of any occupational therapy degree. However, post-graduate certification programs specifically designed to prepare occupational therapists for a role in vision rehabilitation are now being established. For example, the
Department of Occupational Therapy of the University of Alabama will begin teaching a post-graduate certification and a post-professional master’s degree in vision rehabilitation in January 2005.(99)
There are currently 65,000 licensed occupational therapists in the U.S. Occupational therapists are regulated in all 50 states and three U.S. territories. Of these 53 jurisdictions, 46 states, the District of Columbia, Guam and Puerto Rico license occupational therapists; two states-Hawaii and Michigan-have registration laws; and one state, Colorado, has a trademark law.(100)
Physical Therapists
According to the American Physical Therapy Association, there were 213 accredited physical therapist programs in 2002.(101) Of these accredited programs, 146 offered master’s degrees, and 67 offered doctoral degrees. All physical therapist programs seeking
accreditation are required to offer degrees at the master’s degree level and above, in accordance with the Commission on Accreditation in Physical Therapy Education (CAPTE).(102)
Typical physical therapy programs begin with basic science courses such as biology, chemistry, and physics and then introduce
specialized courses, including biomechanics, neuroanatomy, human growth and development, manifestations of disease, examination techniques, and therapeutic procedures (See Table B-2 of
Appendix B for more detail). Besides getting classroom and laboratory instruction, students receive supervised clinical
experience. Among the courses that are useful when one applies to a physical therapist educational program are anatomy, biology,
admission, many professional education programs require experience as a volunteer in a physical therapy department of a hospital or clinic.
All States require physical therapists to pass a licensure exam before they can practice, after graduating from an accredited physical
therapist educational program.(103)
Social Workers
Social workers evaluate the patient’s overall living situation, identify vocational and educational barriers, provide family and social
support, and, where needed, evaluate the patient’s coping abilities and psychological state, identify and provide access to local
resources, and act as patient advocates.(104) In some rehabilitation programs, social workers serve as case managers, facilitating
discharge planning, providing help with financial arrangements, etc.
Most social workers have a Master of Social Work degree; after one or two years of supervised practice, social workers are eligible for licensure. The licensed clinical social worker can function as an independent service provider whose services may be eligible for reimbursement from Medicare.(105)
Unlicensed Vision Rehabilitation Personnel
Low-vision Therapists
Low-vision therapists develop and conduct functional assessment tests of visual abilities for everyday tasks that are important to the