FINAL YEAR PROJECT Dissertation Report
An Efficient Clustering Technique for Mobile Wireless Sensor Networks
by
Nurul Syafiqah Binti Azman 14396
Supervisor: Dr Azrina Abd Aziz
Dissertation submitted in partial fulfillment of the requirements for the
Bachelor of Engineering (Hons) (Electrical and Electronics Engineering)
SEPTEMBER 2014
Universiti Teknologi PETRONAS Bandar Seri Iskandar
31750 Tronoh Perak Darul Ridzuan
i CERTIFICATION OF APPROVAL
An Efficient Clustering Technique for Mobile Wireless Sensor Networks
by
Nurul Syafiqah Binti Azman 14396
A project dissertation submitted to the Electrical and Electronics Engineering Programme
Universiti Teknologi PETRONAS in partial fulfillment of the requirements for the
Bachelor of Engineering (Hons) (Electrical and Electronics Engineering)
Approved by,
(Dr. Azrina Abd Aziz)
UNIVERSITI TEKNOLOGI PETRONAS TRONOH, PERAK
ii CERTIFICATION OF ORIGINALITY
This is to certify that I am responsible for the work submitted in this project, that the original work is my own except as specified in the references and acknowledgements, and that the original work contained herein have not been undertaken or done by unspecified sources or persons.
iii ABSTRACT
Wireless applications are emerging in today’s world especially for monitoring purposes. The key issue in handling this type of communication is the battery lifetime. Clustering is implemented where grouping of wireless nodes are done to extend the network lifespan by reducing number of long distance communications. However, this clustering technique are seldom implemented on mobile nodes. This limits the wireless application, making clusters unrealistic to be implemented on wireless mobile application. This paper aims to study the behaviour and performance of clustering technique applied on mobile wireless sensor nodes. LEACH clustering algorithm will be implemented on random mobility network. The simulation is done by MATLAB software. Nodes with higher mobile weightage are proven to work better at its initial lifecycle but degrade faster with time. When compared with static nodes, the performance of mobile nodes is better at an early stage, but worsen with time.
iv ACKNOWLEDGEMENTS
Alhamdulillah, thanks to Allah the Almighty for his guidance and blessings, I am able to carry out this Final Year Project successfully.
I am pleased to express my sincere gratitude to my Supervisor, Dr. Azrina Bt Abd Aziz for her continuous effort to teach and guide me through. I was able to complete this research and experimentation with her willingness to help me whenever I face any troubles and problems throughout implementing this project.
Besides that, I would like to thank all the FYP committees that help all final year students in general by providing briefings and guidelines from time to time. Not to forget my family and friends for their never-ending love and support in everything I do.
v TABLE OF CONTENTS ABSTRACT ... i ACKNOWLEDGEMENTS ... iv LIST OF FIGURES ... vi LIST OF TABLES ... vi CHAPTER 1: INTRODUCTION ... 1 1.1 Background ... 1 1.2 Problem Statement ... 2 1.3 Objectives ... 3 1.4 Scope of Studies ... 3
CHAPTER 2: LITERATURE REVIEW ... 4
2.1 Clustering Technique ... 5
2.1.1 Low-Energy Adaptive Clustering Hierarchy (LEACH) ... 6
2.1.2 Weighted Clustering Algorithm (WCA) ... 7
2.1.3 Highest-Connectivity Cluster Algorithm ... 8
2.2 Mobile Wireless Sensor Network ... 8
2.2.1 Random Walk Mobility Model ... 9
CHAPTER 3: METHODOLOGY ... 11
3.1 Clustering Implementation on Static Nodes ... 11
3.1.1 Flowchart for Clustering Implementation on Static Nodes ... 13
3.2 Clustering Implementation on Mobile Nodes ... 14
3.2.1 Flowchart for Clustering Implementation on Mobile Nodes ... 16
3.3 Gantt Chart ... 17
3.3.1 Final Year Project 1 ... 17
3.3.2 Final Year Project 2 ... 18
CHAPTER 4: RESULTS AND DISCUSSION ... 19
4.1 Number of Alive Nodes vs Mobility Weightage ... 27
4.2 First Die Out Node vs Mobility Weightage ... 27
4.3 Performance of Mobile Network ... 28
CHAPTER 5: CONCLUSION AND RECOMMENDATION ... 29
vi LIST OF FIGURES
Figure 1: Signal transmission in a clustered network [1] ... 5
Figure 2: Nodal movement in Random Waypoint Model [10] ... 9
Figure 3: Random placement of nodes (1) ... 19
Figure 4: Random placement of nodes (2) ... 20
Figure 5: Random placement of nodes (3) ... 21
Figure 6: Graph of Number of Alive Nodes vs Number of Rounds ... 22
Figure 7: Graph of Number of Alive Nodes vs Number of Rounds for various mobile nodes (TRIAL 1) ... 23
Figure 8: Graph of Number of Alive Nodes vs Number of Rounds for various mobile nodes (TRIAL 2) ... 24
Figure 9: Graph of Number of Alive Nodes vs Number of Rounds for various mobile nodes (TRIAL 3) ... 25
LIST OF TABLES Table 1: Parameters used for clustering implementation ... 11
Table 2: Parameters used to create mobile nodes ... 14
Table 3: Different mobility weightage for mobile network ... 26
1 CHAPTER 1: INTRODUCTION
1.1 Background
Wireless sensor networks (WSNs) refer to number of distributed independent sensors placed in a location to monitor its physical or environmental conditions. These autonomous sensors will then send the received monitoring signal to a known location wirelessly. This property allows them to be utilized for various field of applications including health, military, as well as oil and gas industry, especially in remote areas where human interventions are limited.
Since large number of sensor nodes are involved, they require a technique such as clustering technique for organizing these nodes in a right manner. Besides that, to meet the crucial requirement of a sensor network, clustering are applied for energy conservation of the network, which lead to the extension of network lifetime
Many clustering techniques were invented and implemented on these sensor nodes. Trials and experiments are performed to differentiate the effectiveness and efficiency on these techniques, focusing on the network lifespan as the main objective.
As technology evolves, wireless nodes are no longer static. Applications on monitoring purposes such as human and animal’s surveillance, require these wireless nodes to be mobile. With much more energy consumption, these mobiles nodes must also meet the crucial requirement where power conservation is vital to increase its lifetime.
Mobility models are used to simulate the mobility patterns of mobile nodes. Various models are studied focusing on their suitability of the present’s applications. Thus, clustering technique will be implemented on these mobile nodes continuously moving with certain identified models.
2 1.2 Problem Statement
Recent clustering research often focus on static nodes where limited applications are available. Applications involving mobile wireless nodes such as health monitoring for a sick person, migration pattern for animals, and surveillance of unmanned aerial vehicle are set aside although these applications consume much higher energy.
Some research is done on mobility-based clustering algorithms to meet the energy requirement. However, most of the researches strict the mobility pattern to move in a random movement only. The proposed technique may not work in realistic environment where specified mobility patterns for different type of application is required to ensure the clarity and integrity of the result obtained.
Ample research on mobility pattern and clustering technique for mobile wireless sensor nodes are vital in order to widen the implementation for mobile wireless sensor network. As mobile nodes consume more energy than static nodes, clustering execution is a must to be implemented into these wireless mobile network.
3 1.3 Objectives
The main objective of this project is to study the effect of mobility on existing clustering technique. The sub aims of this project can be broken into five (5) which include:
1. To study and classify leading clustering techniques in wireless sensor networks. 2. To propose and simulate clustering technique in MATLAB.
3. To evaluate the performance of the clustering technique and analyze the results. 4. To study the mobility patterns for mobile wireless sensor nodes.
5. To implement proposed clustering technique on number of mobile nodes with different mobility patterns.
1.4 Scope of Studies
1. Study and research about the existing clustering techniques. 2. Implement existing cluster algorithms on MATLAB.
3. Study and research about mobility pattern for mobile networks. 4. Implement the mobility pattern used on MATLAB.
4 CHAPTER 2: LITERATURE REVIEW
A wireless sensor networks (WSNs) is a combination of sensor nodes that are small in size communicating untethered within short distances. Numbers of sensor nodes are connected wirelessly via infrared or radio waves, depending on the application involved [1]. Advances in micro-electro-mechanical systems (MEMS) technology, wireless technology, as well as digital electronics have enabled these sensor nodes to function with low cost, low power, and carry multifunction abilities [2]. They are commonly used for monitoring applications of environments where human access is limited [3]. These sensor nodes carry three (3) major roles including sensing, processing, and communicating.
Many researches and improvements have been added to these sensor nodes to improve its functionalities. Thus, fundamental features of these sensor nodes are crucial in order to make it marketable in today’s applications. One of them is to possess a self-organizing ability where random arrangement are possible since the position of these sensor nodes need not to be engineered [2]. Besides that, sensor nodes must be equipped with an on-board processor that is able to carry simple computations and transmit required data only [2]. These fundamentals features allow sensor nodes to be applied in various applications including health, military, and security system [2].
Since sensor nodes are equipped with many special features, they face another major challenge which is limited power supply since the battery used are commonly irreplaceable and non-rechargeable [3]. To meet this power conservation requirement, various techniques and strategies are developed to minimize its power consumption. For example, multi hop communication are established since they consumed less power than single hop [2]. This is because multi hop communication involve short distance transmission while single hop communication often involve long distance transmission. However, in focusing at the lifetime of these sensor nodes, a trade-off mechanisms are designed where end user can enjoy the prolonged network lifetime at the cost of lower throughput and higher transmission delay [2].
5 2.1 Clustering Technique
One known technique of conserving the energy consumption in wireless sensor network application is called clustering, which denotes the partitioned of sensor network into groups of sensor nodes [4]. Clustering is the main technique utilized to extend the lifetime of a sensor network by reducing sensor node’s energy consumption [1]. Without clustering, each node has to transfer data to the base station individually, leading to immediate die out of the battery especially those who are located far from the base station. Consequently, clusters are formed where each group are equipped with a cluster head and a number of member nodes [1]. Instead of sending data directly to the base station, member nodes have to report only to the respective cluster heads, hence minimizing the number of nodes participated in long distance communication [5]. These cluster head would then transmit the received data to the central station via other cluster heads [1].
Figure 1: Signal transmission in a clustered network [1]
Besides energy conservation, clustering reduces channel contention and packet collisions, resulting in better network throughput under abundance of load [1]. However, the efficiency of cluster sampling will decrease with the increase of quantity of nodes in a cluster sample. Therefore, to maximize the benefits of clustering, quantity of nodes in a cluster should be made small while the total number of clusters in a network should be large. Accordingly, an easier, cheaper, faster, and a more convenient process in collection of data for neighboring elements can be achieved [5]. Looking at its benefits, many clustering techniques and algorithms have been proposed and implemented in today’s wireless application including LEACH, DEEC, SEP, and HEED.
6 Since the prime metric in evaluating performance of a sensor network is the network lifetime, its definition is clarified as the concept used depend on the objective of the application. The common description of network lifetime is the time until the first or the last node in the sensor network depletes and disconnected from the central station [1]. Based on this definition, researches usually measure the time taken for depletion as the responding variable for their experiments. On top of that, some utilize number of active nodes as the indication of residual energy in the sensor network. To differentiate the performance of clustering techniques, energy consumption often used as the resulting parameter while number of round and number of nodes as the manipulating variable [3].
2.1.1 Low-Energy Adaptive Clustering Hierarchy (LEACH)
LEACH is a type of hierarchical protocol where nodes will transmit data to cluster heads, and the cluster heads will compress these received data and transmit it to the central station. This technique is considered as dynamic since it is able to rotate the job of the cluster heads, providing balance energy dissipation throughout the network [6] [1]. To choose a cluster head, a function of percentage of optimal cluster heads is established where it takes into consideration on how often and the last time a given node has become a cluster head. This function is applied at each interval exclusively on each node without the interference of other nodes to minimize overhead in cluster head establishment [1]. The threshold function is defined as below:
𝑇(𝑛) = 𝑃
1−𝑃(𝑟 𝑚𝑜𝑑 𝑃1) 𝑖𝑓 𝑛 ∈ 𝐺 ………….. Equation [1, 7] 𝑂𝑡ℎ𝑒𝑟𝑤𝑖𝑠𝑒 0
Where n is the given node, P is the priori probability of a node being elected as a cluster head, r is the number of rounds, and G is the number of nodes that have not been elected as the cluster head for the last 𝑃1 rounds.
If the number is calculated to be less than the threshold function, the respective node will be selected as a cluster head [1]. Although nodes will take turn in becoming a
7 cluster head, this protocol will not be able to sense the exact energy difference between nodes since it assumes the energy consumption of each node with respect to the overall energy of the network is homogenous.
2.1.2 Weighted Clustering Algorithm (WCA)
WCA is a type of weighted schemes algorithm where it utilize a combination of several desired weighted metrics. It takes into account numerous parameters in concern such as node degree, transmission energy, as well as residual energy in the network [8] [1].
The algorithm focus on minimum energy consumption where it elects a cluster head only when a reconfiguration of a network’s topology is unavoidable. This is because the election process consumes much higher energy as simple computational processes are involved. Since the reelection process will occur less frequently, the algorithm will aim to catch a long-lasting architecture during the original cluster-head election [1].
WCA elects a cluster leader based upon a combined weight of parameters described by [1]:
𝑊𝑣 = 𝑤1∆𝑣 + 𝑤2𝐷𝑣 + 𝑤3𝑀𝑣 + 𝑤4𝑃𝑣 … … … … . 𝐸𝑞𝑢𝑎𝑡𝑖𝑜𝑛 [1]
Where w1, w2, w3, and w4 are the weighing factors for the parameters involved. Factor 𝑤1∆𝑣 refers to the ideal maximum number of nodes in a cluster. Second factor
𝑤2𝐷𝑣 takes into account the neighbouring distance of the clusters. Factor 𝑤3𝑀𝑣 consider the mobility of nodes. The last factor 𝑤4𝑃𝑣 concerns the residual energy of nodes. The mutual weight is then calculated by each node and transmit through the network. After the computation, the node with the smallest 𝑊𝑣 will be elected as the cluster leader.
The advantage of WCA is that, the algorithm can be suited for various applications by selecting appropriate weightage to each factors. However, the induced overhead by WCA is very high as each node will store the information of weightage values of other nodes and other cluster-heads [8]. This may lead to a long delay, however the time required for the election of a cluster leader will always depend on the network itself [1].
8 2.1.3 Highest-Connectivity Cluster Algorithm
Highest-Connectivity Cluster formation is a type of heuristic algorithm that aims in either realistic run-time or practical performance without focusing on certain metrics. It is constructed based on the very first algorithm on clustering namely Linked Cluster Algorithm (LCA). Each node will be equipped with a unique ID number. LCA consider the highest ID number to be elected as the cluster-head when none of its neighbouring nodes is a cluster leader [1].
In addition, highest-connectivity clustering technique takes into account the number of neighbouring nodes and broadcast it to the surrounding nodes. This is to consider the connectivity of the node where nodes connected to the highest number of surrounding nodes will be elected as a cluster-head [1].
2.2 Mobile Wireless Sensor Network
Mobile Wireless Sensor Network (MWSNs) refers to WSNs that composed of moving nodes. These nodes move with a certain pattern based on real-life objects characterized by various possessions such as limitations, dimensions, behaviour, and predictability [9]. The three (3) main mobility patterns include:
i. Padestrian mobility pattern which describe people’s motion characteristics. ii. Vehicular mobility pattern which capture vehicles movement based on traffic
conditions and others.
iii. Dynamic medium mobility pattern which define movement through a medium such as water or gas.
Based on continuous observation of patterns above, mobility models in terms of mathematical description are generated. There are two (2) types of mobility models namely:
i. Individual or Entity mobility models which the movement of nodes are independent of each other. Example for this model include Random Direction, Random Waypoint, and Random Walk
9 ii. Group mobility models which the mobility of nodes are dependent of each other. Example for this model include Column, Pursue, Nomadic, Exponential Correlated, and Reference Point Group Mobility Model.
2.2.1 Random Walk Mobility Model
Random Walk Mobility Model is created based on the pause time when node is experiencing any change in speed or direction [10]. Within a pre-defined period or distance, the model is rapidly expressed as it travels from an initial position to a new position by randomly choose a direction and speed [9].
The main advantage of this model is that, it is very simple and easy to be implemented. Besides simplicity, it is also widely available. However, since mobility is affected by the pause time and speed of nodes, a slow drive of nodes with small pause time will lead to a less stable network.
Figure 2: Nodal movement in Random Waypoint Model [10]
The mobility behaviour is defined by the two main parameters namely the maximum voltage Vmax and Tpause. Small Vmax with long Tpause will create a stable topology whereas large Vmax small Tpause will generate a highly dynamic topology [11]. The relative speed between two (2) nodes will determine the link between them, either break or form. Thus, a mobility metric is proposed to calculate the nodal speed. The relative speed between node I and j is at time is is given by:
10 𝑅𝑆(𝑖, 𝑗, 𝑡) = | 𝑉𝑖 → (𝑡) − 𝑉𝑗 → (𝑡) |………..….Equation [11]
Accordingly, the mobility metric M where n is the total number of nodes is given as below:
𝑀 =|𝑖,𝑗|1 ∑𝑁𝑖=1∑𝑁𝑗=𝑖+1𝑇1∫ 𝑅𝑆(𝑖, 𝑗, 𝑡)𝑑𝑡0𝑇 ….Equation [11]
Using these metrices, the level of speed as well as different mobility situations can be identified based on the mobility level.
11 CHAPTER 3: METHODOLOGY
This chapter discusses the methods used to implement clustering technique on both static and mobile nodes. It illustrates the parameters involve for efficient clustering implementation as well as steps in obtaining various weightage of random mobility pattern.
3.1 Clustering Implementation on Static Nodes
Existing LEACH clustering algorithm is implemented on MATLAB. A total of 100 nodes are distributed on a 100 x 100 meters field dimension. The base station is located at coordinate (50,175). Each node is assigned to have 0.05 prior probability to be elected as a cluster head with 0.9 J of initial energy. Assumptions are made on the energy consumption to run transmitter and receiver (Eelec ) as well as radio energy dissipation consumed in transmitter amplifier in free space and multipath (Ɛfs, Ɛmp ). Summary of initial parameters are as follow:
Table 1: Parameters used for clustering implementation
Parameters Value
Field dimensions 100×100 meters
Coordinates of sink (base station) (50,175)
Number of nodes, n 100
Optimal Election Probability of a node to become cluster head 0.05
Packet length 6400 bps
Control packet length 200
Initial energy per node 0.9 J
Eelec 5×10⁻⁷ J/bit
Ɛfs 1×10-11J/bit/m2
Ɛmp 1.3×10⁻¹⁵J/bit/m4
Max. number of rounds 99999
12 The maximum number of rounds is set to infinity and the program will terminate once all the nodes in the network is dead. Once simulated, the distribution of nodes and cluster-head formation is observed.
The performance metric studied will be the residual energy of the network which is represented in the form of number of alive nodes. To compare the performance of static and mobile nodes, number of alive nodes at round 1200 as well as round which the first node is dead are recorded. Graph number of alive nodes vs number of rounds is plotted.
13 3.1.1 Flowchart for Clustering Implementation on Static Nodes
START INPUT PARAMETERS RANDOM PLACEMENT OF NODES ENERGY = 0.9 COMPUTATION FOR CLUSTERHEAD CLUSTERHEAD SELECTION NO ENERGY-- ENERGY = 0? NUMBER OF ALIVE NODES AT ROUND=1200 ROUND WHICH FIRST NODE IS DEAD END YES
14 3.2 Clustering Implementation on Mobile Nodes
Utilizing the same parameters as static nodes, LEACH Protocol is implemented on mobile network. Nodes are made mobile by changing its initial position. This is done through continuous implementation of “random” function in MATLAB which generate a set of new position for each nodes and random mobility for the network.
Five (5) different trials are conducted by varying the number of times nodes are being restructured. The more frequent nodes being reorganized means nodes possess faster velocity, and therefore higher mobility weightage. Slowest mobility is represented by two (2) times of rearrangement while fastest mobility is represented by twelve (12) times of rearrangement. Number of round is fixed to 1200 to ensure adequate energy is distributed for all the mobility weightage. The parameters to apply mobility weightage are as follow:
Table 2: Parameters used to create mobile nodes
Variables Description
Static variable Number of round (rmax=1200)
Manipulated variable Number of times nodes are being restructured a) 2 times (change every 600 rounds)
b) 3 times (change every 400 rounds) c) 4 times (change every 300 rounds) d) 6 times (change every 200 rounds) e) 12 times (change every 100 rounds) Responding variable Number of alive nodes after maximum round
Number of round which the first node is dead
To validate the performance of mobile network, residual energy of the network represented in term of number of alive nodes at the last round and round which the first node is dead are recorded. Graph of number of alive nodes vs number of rounds is also plotted to observe and compare the how energy in the network depletes over time.
15 In order to ensure clustering implementation is efficient on mobile network, its performance will be compared with static nodes. Graph showing number of alive nodes with increasing number of rounds is plotted for all the mobility weightage as well as static nodes. The variable of number of alive nodes at the last round and round which the first node is dead is compared. The modelling is done three (3) times to get the average value and to enhance the accuracy of data. From this comparison, the performance of both static and mobile network is discussed and concluded.
16 3.2.1 Flowchart for Clustering Implementation on Mobile Nodes
START INPUT PARAMETERS RANDOM PLACEMENT OF ROUND = 0 MAX ROUND = 1200 COMPUTATION FOR CLUSTERHEAD SELECTION NO ROUND++ MOBILITY = MOBILE FREQ?? NUMBER OF ALIVE NODES AT ROUND=1200 ROUND WHICH FIRST NODE IS DEAD END YES MOBILITY = 0 MOBILE FREQ = 12 MOBILITY++ NO YES ROUND % 100 ≠ 0?
17 3.3 Gantt Chart
3.3.1 Final Year Project 1
FYP 1 1 2 3 4 5 6 7 8 9 10 11 12 13 14
Selection of project title Research on wireless sensor network Research on existing clustering techniques Study on performance metrics of clustering techniques Extended Proposal submission Proposal Defense Implement existing clustering techniques on MATLAB Study on clustering algorithms
Study on mobility models of mobile network
Draft Interim Report Submission
18 3.3.2 Final Year Project 2
FYP 2 1 2 3 4 5 6 7 8 9 10 11 12 13 14 15 Implementation of
mobile nodes on MATLAB
Implement different scenarios for mobile nodes
Search for performance metrics for mobile nodes Progress Report Submission Mobile simulation on MATLAB Pre-EDX Draft Report Submission Final Report Submission Viva
19 CHAPTER 4: RESULTS AND DISCUSSION
This chapter discusses on the performance of clustering implementation for both static and mobile nodes.
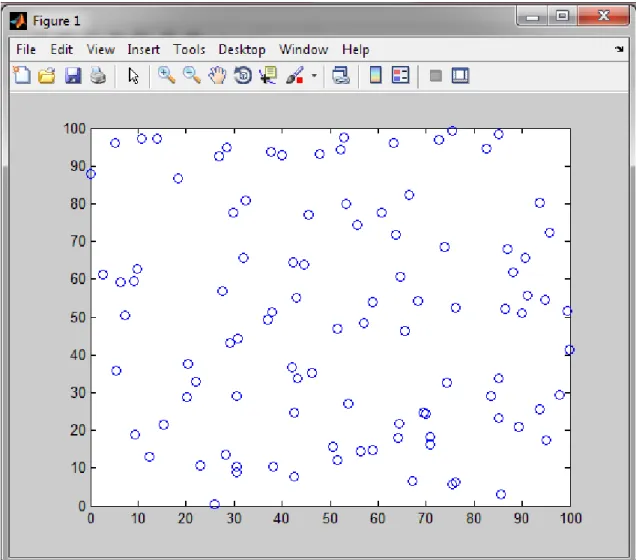
20 Figure 4: Random placement of nodes (2)
21 Figure 5: Random placement of nodes (3)
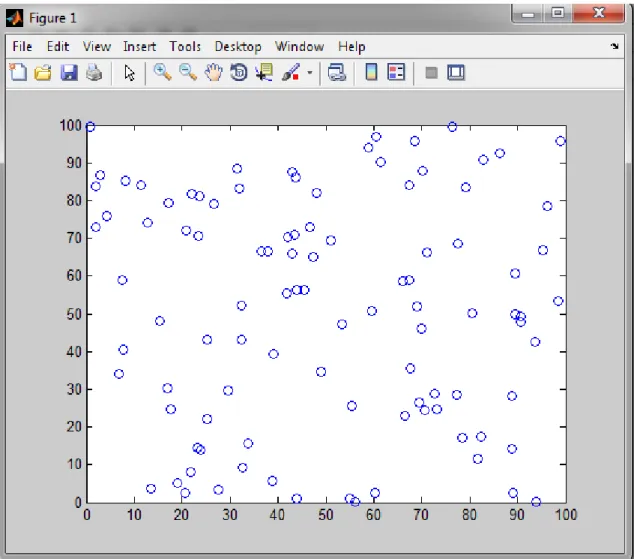
Figure 3, 4, and 5 show the implementation of LEACH protocol on mobile wireless nodes using MATLAB. The three (3) figures show different placement of nodes each time a random function is called. Note that the result of each trial will be different as it depends on location and distance of nodes from each other as well as from the base station.
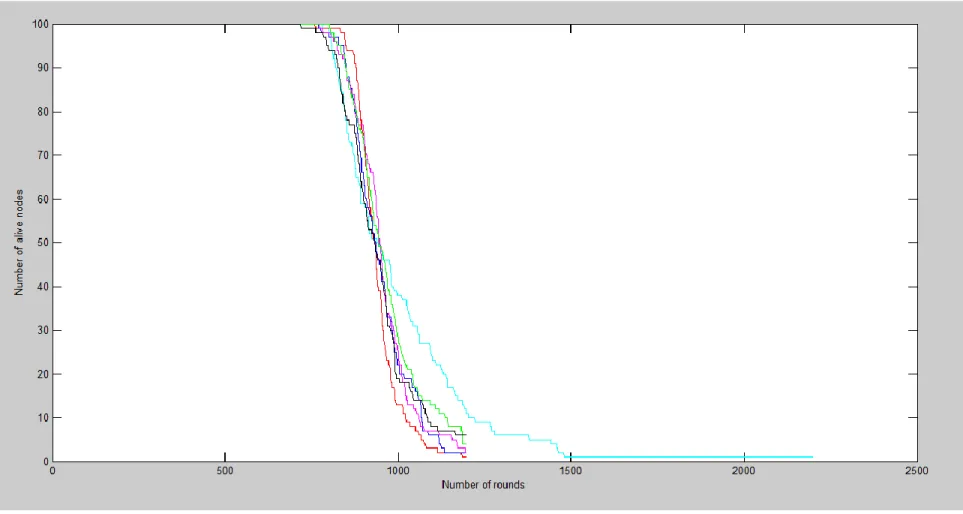
22 Figure 6: Graph of Number of Alive Nodes vs Number of Rounds
Figure shows the number of alive nodes decrease as number of round increases. It is note that at round 781, the first node is dead. As the number of round goes on, numbers of node continue to be dead, but the network is still working until all nodes are dead at round 2201. Although LEACH implementation involve the job of cluster-heads to rotate, this does not guarantee the even energy consumption of the network as it rely on the how often nodes become a cluster head, not the actual residual energy of each node.
23
24
25
26
Table 3: Different mobility weightage for mobile network
Graph colour Mobility
Black Change 2 times Rearrange every 600 rounds Green Change 3 times Rearrange every 400 rounds Pink Change 4 times Rearrange every 300 rounds Blue Change 6 times Rearrange every 200 rounds Red Change 12 times Rearrange every 100 rounds
Cyan Static Static
Table 4: Result on the effect of mobility to energy consumption of the network
Trial 1 Trial 2 Trial 3 Average
Mobility weightage (rearrangeme nt frequency) Number of Alive Nodes at round 1200 First node dead at round Number of Alive Nodes at round 1200 First node dead at round Number of Alive Nodes at round 1200 First node dead at round Number of Alive Nodes at round 1200 First node dead at round 2 6 762 6 719 6 795 6 759 3 7 752 4 803 5 789 5 781 4 3 789 2 773 4 768 3 777 6 4 832 2 769 2 819 3 807 12 2 841 1 801 2 839 2 827 STATIC 11 721 12 748 12 735 12 735
27 Figure 7, 8, and 9 symbolize the energy depletion for a network as number of round increases for different mobility weightage as referred to Table 3. Table 4 shows the tabulated data for number of alive nodes at the last round as well as round which the first node is dead for each mobility weightage.
The maximum round for mobile network is limited to 1200 rounds to ensure the network functions for all the mobile scenarios. At round 1200, number of alive nodes for each mobility scenarios is determined and distinguished. The round which the first node is dead is also determined. These two (2) variables are used to differentiate the performance of clustered network for mobile nodes. The simulation is repeated for three (3) times to get the average value.
4.1 Number of Alive Nodes vs Mobility Weightage
From the graph, it is proven that the higher the mobility weightage, the lower the number of alive nodes at round 1200. Rearrangement of nodes symbolize its velocity inside a network. Thus, nodes with higher frequency of rearrangement are assumed to have greater mobility and move faster. These nodes consume higher energy and consequently, they will die out faster. However, the number of alive nodes vary for each trial as nodes are randomly placed across a network.
Mobile nodes consume much more energy than static nodes. This is proven when mobile network with the lowest weightage (2 times rearrangement) partakes only half number of alive nodes compared to static network at round 1200. Meanwhile, highest mobility nodes possess three (3) times higher energy consumption than lowest mobility nodes. This proves the hypothesis that higher the mobility weightage consume greater energy and thus have shorter lifetime.
4.2 First Die Out Node vs Mobility Weightage
From the graph, first node will die out faster at slower mobility. In addition, the fastest node to die out is the network with static nodes. This shows that the performance of high mobility nodes is better than both low mobile nodes and static nodes.
28 When nodes are made mobile, cluster formation is repeated each time nodes are being rearranged. This improves the clustering implementation whereby high mobility nodes would have the best cluster formation established with higher frequency. This ensure the efficiency and effectiveness of clustering implementation on wireless networks. However, the specific round which the first node dies out differ significantly for each trial due to random placement of the nodes.
4.3 Performance of Mobile Network
From the result, it can be observed that mobile nodes perform great at the beginning of its lifespan. This is because the first node dies out latest for nodes with the highest mobility. After 900th round, nodes with the highest mobility switch from having the highest number of alive nodes to the lowest. Consequently, nodes with highest mobility retain the lowest number of alive nodes at the end of the round.
After half the nodes die out, the clustering implementation started to become unstable. Since few nodes are available, choices on cluster leaders are limited. High mobility nodes would be forced to form different cluster formation each time they are being rearranged. Nodes would still be elected as cluster leaders even though they have been elected for recent previous rounds. Due to this instability, high mobility nodes degrade significantly over time. Hence, it can be concluded that high mobility nodes work best initially, but dies out faster as time goes by.
29 CHAPTER 5: CONCLUSION AND RECOMMENDATION
As for conclusion, advances in wireless technology have emerged the existence of tiny sensor nodes collaborating together to perform complex tasks. Since it involves hundreds or even thousands of nodes, an efficient grouping technique called clustering is developed. Various clustering algorithms are established to meet the prime requirement of this network which is low power consumption.
MWSNs is developed due to limited application for static nodes. Thus, wireless application is broaden to a wider application covering mobile nodes where sensor nodes can be attached to a moving objects or even person. With higher power consumption, surely clustering algorithms is vital to be implemented on these mobile networks to reduce its power consumption increase the network’s lifetime.
Nodes are made mobile by continuously changing its position. With clustering involved, mobile nodes work best during their initial lifespan, but degrade significantly over time. In order to sustain its performance, it is recommended that maintenance including changing the batteries are performed after few nodes has die out, not to wait for all of it. Based on the result, the best solution is to carry out maintenance at least before half the nodes have die out.
As for improvement, ‘time’ parameter should be used instead of ‘rounds’ to enhance the clarity of the project. Besides that, nodes should be made continuously moving with time to get a more accurate and precise data.
30 REFERENCES
[1] R. Mitra and D. Nandy, "A Survey on Clustering Techniques for Wireless Sensor Network," International Journal of Research in Computer Science, vol. 2, no. 4, pp. 51-57, 2012.
[2] I. Akyildiz, W.Su, Y.Sankarasubramaniam and E. Cayirci, "Wireless sensor networks: a survey," Computer Networks, vol. 38, no. 4, p. 30, 12 December 2002. [3] S. J. Dastgheib, H. Oulia and M. R. S. Ghassami, "An Efficient Approach for
Clustering in Wireless Sensor Network Using Fuzzy Logic," in 2011 International Conference on Computer Science and Network Technology, Iran, 2011.
[4] V. V. Deshpande and A. R. B. Patil, "Energy Efficient Clustering in Wireless Sensor Network using Cluster of Cluster Heads," IEEE, p. 5, 3 2013.
[5] A. R. Dutta, B. S. Saha and C. A. K. Mukhopadhyay, "Efficient Clustering Techniques to Optimize the System Lifetime in Wireless Sensor Network," in International Conference On Advances In Engineering, Science And Management, India, 2012.
[6] Reese and Stephanie, "radford," [Online]. Available: www.radford.edu/~nsrl/creu0809/Presentations/LEACH.ppt. [Accessed 20 June 2014].
[7] S.Deng, J.Li and L.Shen, "Mobility-based clustering protocol for wireless sensor networks with mobile nodes," IET Wireless Sensor Systems, vol. 1, no. 1, pp. 39-47, 2010.
[8] W. Choi and M. Woo, "A Distributed Weighted Clustering Algorithm for Mobile Ad Hoc Networks," in Advanced International Conference on Telecommunications and International Conference on Internet and Web Applications and Services, Korea, 2006.
31 [9] Q. Dong and W. Dargie, "A Survey on Mobility and Mobility-Aware MAC Protocols in Wireless Sensor Networks," IEEE Communication Surveys & Tutorials, vol. 15, no. 1, pp. 88-100, 2013.
[10] Vasanthi.V, R. Kumar.M, A. Singh.N and M.Hemalatha, "A Detailed Study of Mobility Models in Wireless Sensor Network," Journal of Theoretical and Applied Information Technology, vol. 33, no. 1, pp. 7-14, 2011.
[11] F. Bai and A. Helmy, "A Survey of Mobility Models in Wireless Adhoc Networks," in Wireless Adhoc Networks, California, University of Southern California, p. 30.
![Figure 1: Signal transmission in a clustered network [1]](https://thumb-us.123doks.com/thumbv2/123dok_us/10128570.2913671/12.918.354.684.510.681/figure-signal-transmission-clustered-network.webp)
![Figure 2: Nodal movement in Random Waypoint Model [10]](https://thumb-us.123doks.com/thumbv2/123dok_us/10128570.2913671/16.918.285.699.566.791/figure-nodal-movement-random-waypoint-model.webp)