sets reveals a shared innate immune
component in autism spectrum
disorder and its co-morbidities
The Harvard community has made this
article openly available.
Please share
how
this access benefits you. Your story matters
Citation
Nazeen, Sumaiya, Nathan P. Palmer, Bonnie Berger, and Isaac S.
Kohane. 2016. “Integrative analysis of genetic data sets reveals a
shared innate immune component in autism spectrum disorder
and its co-morbidities.” Genome Biology 17 (1): 228. doi:10.1186/
s13059-016-1084-z. http://dx.doi.org/10.1186/s13059-016-1084-z.
Published Version
doi:10.1186/s13059-016-1084-z
Citable link
http://nrs.harvard.edu/urn-3:HUL.InstRepos:29626131
Terms of Use
This article was downloaded from Harvard University’s DASH
repository, and is made available under the terms and conditions
applicable to Other Posted Material, as set forth at
http://
nrs.harvard.edu/urn-3:HUL.InstRepos:dash.current.terms-of-use#LAA
Nazeenet al. Genome Biology (2016) 17:228 DOI 10.1186/s13059-016-1084-z
R E S E A R C H
Open Access
Integrative analysis of genetic data sets
reveals a shared innate immune component in
autism spectrum disorder and its
co-morbidities
Sumaiya Nazeen
1†, Nathan P. Palmer
2†, Bonnie Berger
1,3*and Isaac S. Kohane
2*Abstract
Background: Autism spectrum disorder (ASD) is a common neurodevelopmental disorder that tends to co-occur
with other diseases, including asthma, inflammatory bowel disease, infections, cerebral palsy, dilated cardiomyopathy, muscular dystrophy, and schizophrenia. However, the molecular basis of this co-occurrence, and whether it is due to a shared component that influences both pathophysiology and environmental triggering of illness, has not been elucidated. To address this, we deploy a three-tiered transcriptomic meta-analysis that functions at the gene, pathway, and disease levels across ASD and its co-morbidities.
Results: Our analysis reveals a novel shared innate immune component between ASD and all but three of its co-morbidities that were examined. In particular, we find that the Toll-like receptor signaling and the chemokine signaling pathways, which are key pathways in the innate immune response, have the highest shared statistical significance. Moreover, the disease genes that overlap these two innate immunity pathways can be used to classify the cases of ASD and its co-morbidities vs. controls with at least 70 % accuracy.
Conclusions: This finding suggests that a neuropsychiatric condition and the majority of its non-brain-related co-morbidities share a dysregulated signal that serves as not only a common genetic basis for the diseases but also as a link to environmental triggers. It also raises the possibility that treatment and/or prophylaxis used for disorders of innate immunity may be successfully used for ASD patients with immune-related phenotypes.
Keywords: Autism spectrum disorder, Co-morbidities of ASD, Innate immunity pathways, Three-tiered meta-analysis,
Gene expression
Background
While at an organismal level, two or more diseases may appear unrelated, at the molecular level, it is unlikely that they arise entirely independently of one another. Studies of the human interactome—the molecular net-work of physical interactions (e.g., protein–protein, gene, metabolic, regulatory etc.) between biological entities in cells—demonstrate that gene function and regulation are
*Correspondence: [email protected]; [email protected]
†Equal contributors
1Computer Science and Artificial Intelligence Laboratory, Massachusetts
Institute of Technology, 77 Massachusetts Avenue, MA 02139 Cambridge, USA
2Department of Biomedical Informatics, Harvard Medical School, 25 Shattuck
Street, MA 02115 Boston, USA
Full list of author information is available at the end of the article
integrated at the level of an organism. Extensive patterns of shared co-occurrences also evidence molecular com-monalities between seemingly disparate conditions [1].
Indeed, different disorders may share molecular compo-nents so that perturbations causing disease in one organ system can affect another [2]. Yet, since the phenotypes appear so different, medical sub-disciplines address the conditions with sometimes wildly differing treatment pro-tocols. If investigators can uncover the molecular links between seemingly dissimilar conditions, the connections may help explain why certain groups of diseases arise together and assist clinicians in their decision-making about best treatments. Knowledge of shared molecular
© The Author(s). 2016Open AccessThis article is distributed under the terms of the Creative Commons Attribution 4.0 International License (http://creativecommons.org/licenses/by/4.0/), which permits unrestricted use, distribution, and reproduction in any medium, provided you give appropriate credit to the original author(s) and the source, provide a link to the Creative Commons license, and indicate if changes were made. The Creative Commons Public Domain Dedication waiver (http://creativecommons.org/publicdomain/zero/1.0/) applies to the data made available in this article, unless otherwise stated.
pathology may also provide therapeutic insights for repo-sitioning of existing drugs [3].
Such thinking has emerged most recently in neuropsy-chiatry, where many such illnesses do not have clear boundaries in terms of their pathophysiology or diagno-sis [4, 5]. Indeed, there is now growing evidence that rare variants ranging from chromosomal abnormalities and copy number variation (CNV) to single nucleotide variation have implications for autism spectrum disor-der (ASD) and other neuropsychiatric conditions [6–13]. For example, single nucleotide polymorphisms (SNPs), which overlap genes in common molecular pathways, such as calcium channel signaling, are shared in ASD, attention deficit-hyperactivity disorder, bipolar disorder, major depressive disorder, and schizophrenia [14]. CNVs, especially the rare ones, can explain a portion of the risk for multiple psychiatric disorders [10, 13]. For exam-ple, the 16p11.2 CNV encompassing around 600 kb (chr 16:29.5, 30.2 Mb) has been implicated in multiple psychi-atric disorders with the deletions being associated with ASD, developmental delay, and intellectual disability, and duplications being associated with ASD, schizophrenia, bipolar disorder, and intellectual disability [10, 13, 15–19]. However, pathogenic variations are observed in only about 30 % of the ASD-affected individuals [12, 20–23] and these variations often fail to explain the idiopathic (non-syndromic) ASD cases as well as why ASD-affected individuals suffer from many other non-neuropsychiatric conditions.
To complement the evidence of genome-wide
pleiotropy across neuropsychiatric diseases, rather than looking at one neurodevelopmental disease (ASD) and comparing it to other seemingly, brain-related diseases, we expand our exploration outside of the brain to condi-tions related to other organ systems that co-occur with ASD. Recent studies based on electronic health records [24, 25] have identified various co-morbidities in ASD, including seizures [26, 27], gastrointestinal disorders [28, 29], ear infections and auditory disorders, devel-opmental disorders, sleep disorders [30], muscular dystrophy [31–33], cardiac disorders, and psychiatric illness [34, 35].
In this paper, we introduce an integrative gene expres-sion analysis to identify a shared pathophysiological com-ponent between ASD and 11 other diseases, namely, asthma, bacterial and viral infection, chronic kidney dis-ease, cerebral palsy, dilated cardiomyopathy, ear infection, epilepsy, inflammatory bowel disease (IBD), muscular dystrophy, schizophrenia, and upper respiratory infection, that have at least 5 % prevalence in ASD patients [24, 25]. We asked the question, “Do these disease states—which are not included in the definition of ASD but co-occur at a significantly high frequency—illuminate dysregulated pathways that are important in ASD?” We reasoned that
such pathways may offer previously hidden clues to shared molecular pathology.
Other investigators have integrated genomic data from genome-wide association studies and non-synonymous SNP studies for multiple immune-related diseases, reveal-ing that combinreveal-ing genetic results better identified shared molecular commonalities [36]. We believe that adopting an integrative approach not only at the gene level but also at the biochemical pathway and disease levels will power the results still further.
Here we describe results from a novel three-tiered meta-analysis approach to determine molecular similari-ties between ASD and 11 of its co-morbid conditions. For every disease condition, we (i) looked for statistically sig-nificant differentially expressed genes, (ii) identified their enrichment in canonical pathways, and (iii) determined the statistical significance of the shared pathways across multiple conditions. We are unaware of any analyses that go from population-based co-morbidity clusters of ASD to a multi-level molecular analysis at anywhere near this breadth.
Our results unearth several innate-immunity-related
pathways—specifically, the Toll-like receptor and
chemokine signaling pathways—as significant players in ASD and all but three of its examined co-morbidities. Candidate genes in these two pathways significantly overlap in conditions of ASD, asthma, bacterial and viral infection, chronic kidney disease, dilated cardiomyopa-thy, ear infection, IBD, muscular dystrophy, and upper respiratory infection. Candidate genes did not appear to be significantly shared in cerebral palsy, epilepsy, or schizophrenia. Notably, although bacterial and viral infection, respiratory infection, ear infection, IBD, and asthma have well-known connections with the immune system, we demonstrate that innate immunity pathways are shared by ASD and its co-morbidities,irrespectiveof whether they are immunity-related diseases or not.
Since both Toll-like receptor signaling and chemokine signaling pathways play crucial roles in innate immu-nity, the results suggest that this first-line defense system (which protects the host from infection by pathogens and environmental triggers) may be involved in ASD and spe-cific co-morbidities. If the profiles of genetic susceptibility pathways in relation to environmental triggers can be ascertained, they may help in defining new treatments, such as vaccination [37] or other tolerization therapies [38]. Those may help individuals and families who are at high risk for ASD to prevent and/or treat immune-related phenotypes of the illness.
Results
Three-tiered meta-analysis pipeline
We examined ASD and 11 of its most common co-morbidities (Table 1) through a three-tiered lens of gene,
Nazeenet al. Genome Biology (2016) 17:228 Page 3 of 19
Table 1Co-morbidities of autism spectrum disorders
Disease group Clinical manifestations References
Multisystem disorders (congenital anomalies, auditory disorders, Asthma Becker, 2007 [100];
infections, gastro-intestinal disorders, cardiac disorders etc.) Doshi-Velez, Ge,
and Kohane, 2014 [25] Bacterial and viral infections Atladóttir et al., 2010 [78];
Atladóttir et al., 2012 [79]; Garbett et al., 2012 [63]; Hagberg, Gressens, and Mallard, 2012 [101] Chronic kidney disease Curatolo et al., 2004 [102];
Loirat et al., 2010 [103]
Cerebral palsy Surén et al., 2012 [104];
Doshi-Velez, Ge, and Kohane, 2014 [25] Dilated cardiomyopathy Witchel, Hancox,
and Nutt, 2003 [105]; Bilder et al., 2013 [106] Ear infection/otitis media Konstantareas and
Homatidis, 1987 [107]; Rosenhall et al., 1999 [108]; Porges et al., 2013 [109] Inflammatory bowel disease Horvath et al., 1999 [28]; (Crohn’s disease, ulcerative Horvath and Perman, 2002 [29];
colitis) Walker et al., 2013 [110]
Muscular dystrophy Wu et al., 2005 [31];
Hendriksen and Vles, 2008 [32]; Hinton et al., 2009 [33]; Kohane et al., 2012 [24] Upper respiratory infection Shavelle, Strauss,
and Pickett, 2001 [111]; Porges et al., 2013 [109]; Bilder et al., 2013 [106]
Seizures Epilepsy Mouridsen et al., 1999 [26];
Tuchman and Rapin, 2002 [27]; Surén et al., 2012 [104]; Bilder et al., 2013 [106]
Psychiatric disorders Schizophrenia Morgan, Roy,
and Chance, 2003 [34]; Tabarés-Seisdedos and Rubenstein, 2009 [112]; Ingason et al., 2011 [113]; Smoller et al., 2013 [14]; Murdoch and State, 2013 [114]
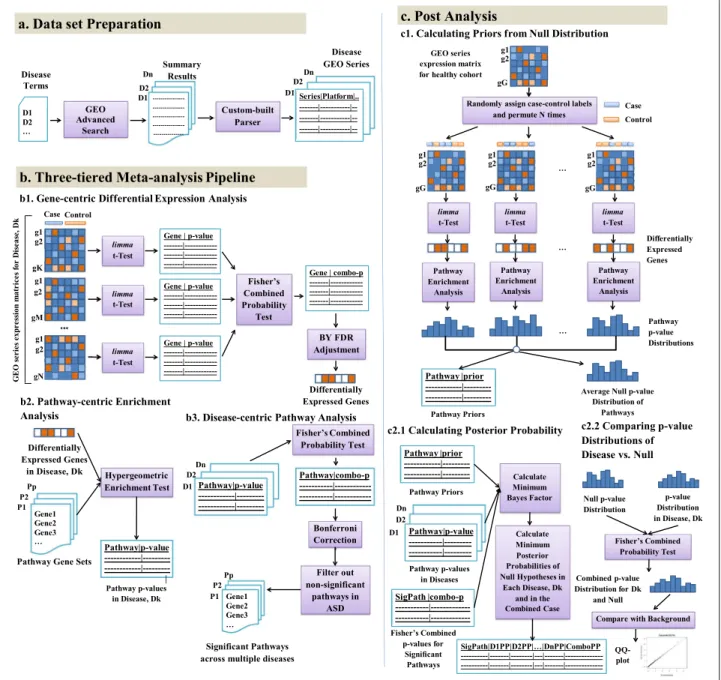
pathway, and disease. Figure 1 shows our three-tiered meta-analysis pipeline. Differential analysis of expression data from 53 microarray studies (see Additional file 1: Table S1) related to the 12 disease conditions revealed
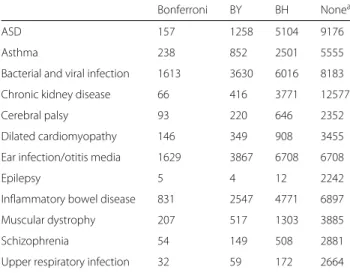
different numbers of significant genes per disease depend-ing on different false discovery rate (FDR) corrections (shown in Table 2). The complete lists ofpvalues per gene per disease under different FDR corrections are given in
Fig. 1Three-tiered meta-analysis pipeline.aData preparation: Select the GEO series relevant to ASD and co-morbid diseases.bThree tiers: (1) For each disease, select significant genes from differential expression analysis of GEO series with a Fisher’s combined test withp<0.05 after
Benjamini–Yekutieli (BY) FDR adjustment. (2) For each disease, select significant pathways from hypergeometric enrichment analysis withp<0.05. (3) Identify significant shared pathways across diseases using Fisher’s combined test withp<0.05 after Bonferroni FDR correction. Exclude the non-significant pathways in ASD.cPost analysis. (1) Using the gene expression data from a healthy cohort, generate a null distribution of pathwayp
values and calculate prior probabilities of pathways being significant by chance. (2.1) Using the prior probabilities, pathwaypvalues in each individual disease, and the Fisher’s combinedpvalues of significant pathways across diseases, calculate minimum Bayes factors and minimum posterior probabilities of null hypotheses for each significant pathway in each disease and in the combined case. (2.2) Combine the pathwaypvalue distribution of each disease with the average null distribution ofpvalues using Fisher’s combined probability test and compare the combinedp
value distribution with the background chi-squared distribution using a QQ plot for significance. Identify the significant pathways using the combinedpvalues, minimum posterior probabilities, and QQ plots.ASDautism spectrum disorder,BYBenjamini–Yekutieli correction,FDRfalse discovery rate,GEOGene Expression Omnibus,QQplot, quantile–quantile plot
Nazeenet al. Genome Biology (2016) 17:228 Page 5 of 19
Table 2Number of differentially expressed genes selected under different FDR corrections for different diseases
Bonferroni BY BH Nonea
ASD 157 1258 5104 9176
Asthma 238 852 2501 5555
Bacterial and viral infection 1613 3630 6016 8183
Chronic kidney disease 66 416 3771 12577
Cerebral palsy 93 220 646 2352
Dilated cardiomyopathy 146 349 908 3455
Ear infection/otitis media 1629 3867 6708 6708
Epilepsy 5 4 12 2242
Inflammatory bowel disease 831 2547 4771 6897
Muscular dystrophy 207 517 1303 3885
Schizophrenia 54 149 508 2881
Upper respiratory infection 32 59 172 2664
Significance cutoff ofp<0.05
ASDautism spectrum disorder,BYBenjamini–Yekutieli,BHBenjamini–Hochberg,
FDRfalse discovery rate
aNo FDR correction
Additional file 2. To select the most informative FDR cor-rection test, we looked at the accuracy of classification of cases vs. controls for each disease using the disease gene sets selected under different FDR corrections. We found the Benjamini–Yekutieli (BY) adjustment to be the most informative and accurate—classification accuracy being at least 63 % using the genes selected under BY adjust-ment as features for a support vector machine (SVM) classifier. This was true for all the diseases examined (see “Methods” section as well as Additional file 3: Figure S1 for details).
Hypergeometric enrichment analysis on individual pathway gene sets from the Kyoto Encyclopedia of Genes and Genomes (KEGG), BioCarta, Reactome, and the Path-way Interaction Database (PID) collections, as well as on the combined gene set of all canonical pathways, helped us to obtain apvalue per pathway per disease. For dif-ferent pathway gene set collections, the complete lists ofpvalues per pathway in each disease are provided in Additional file 4. Combining the p values per pathway across all the diseases using Fisher’s combined probabil-ity test [39] and correcting for multiple comparisons using Bonferroni correction, we measured the shared signifi-cance of pathways across ASD and its co-morbidities (see “Methods” section for details). After selecting any path-way that had an adjusted pvalue < 0.05 as significant and filtering out the pathways that are not significant in ASD, we found a list of pathways that are dysregulated in ASD and at least one of its co-morbidities (see Additional file 4).
To confirm that the presence of multiple significant pathways among ASD and its co-morbidities was due
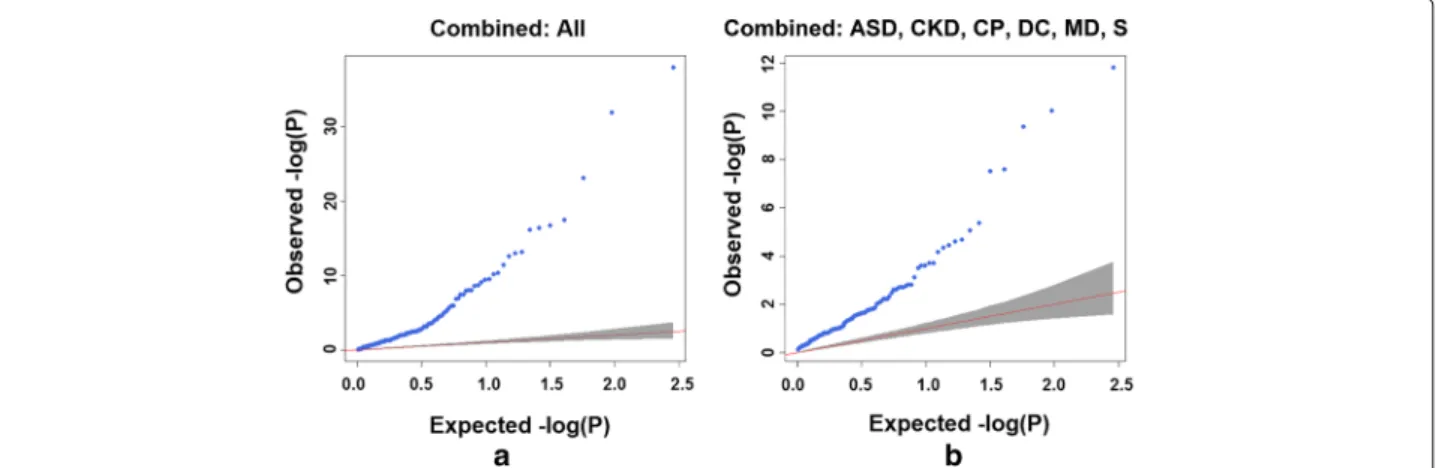
to shared biology, we estimated minimum Bayes factors (BFs) and minimum posterior probabilities of the null hypothesis for each of the significant KEGG pathways in ASD and its co-morbidities (Fig. 1 and Additional file 5). The priors for the pathways were estimated from 100 null distributions ofpvalues generated by differential expres-sion analysis and pathway analysis performed on the gene expression data of a healthy cohort (GEO accession GSE16028) (see Fig. 1 and “Methods” section for details). Looking at the significant pathwaypvalues in each dis-ease and their corresponding posterior probabilities of the null hypothesis, we found that, for the significantp val-ues (p <0.05), the posterior probabilities of thepvalues being significant by chance were always less than 5 %. The quantile–quantile (QQ) plot of combinedpvalues of path-ways across ASD and its co-morbidities shows marked enrichment of significantpvalues indicative of shared dis-ease biology captured by the pathways tested (Fig. 2a). The QQ plots of hypergeometricpvalues of pathways in ASD and its co-morbid diseases against theoretical quantiles also show significant enrichment (see Additional file 3: Figure S2). For contrast, we combined pathwaypvalues from each disease separately with the nullpvalue distribu-tion. When the pathwaypvalue distribution in a disease is combined with the nullpvalue distribution, the QQ plots do not show much deviation from the background distri-bution (see Additional file 3: Figure S3), indicating both that there is a lack of shared biology (as expected) and that our analysis does not cause systematic inflation.
Involvement of innate immunity pathways in ASD and its co-morbidities
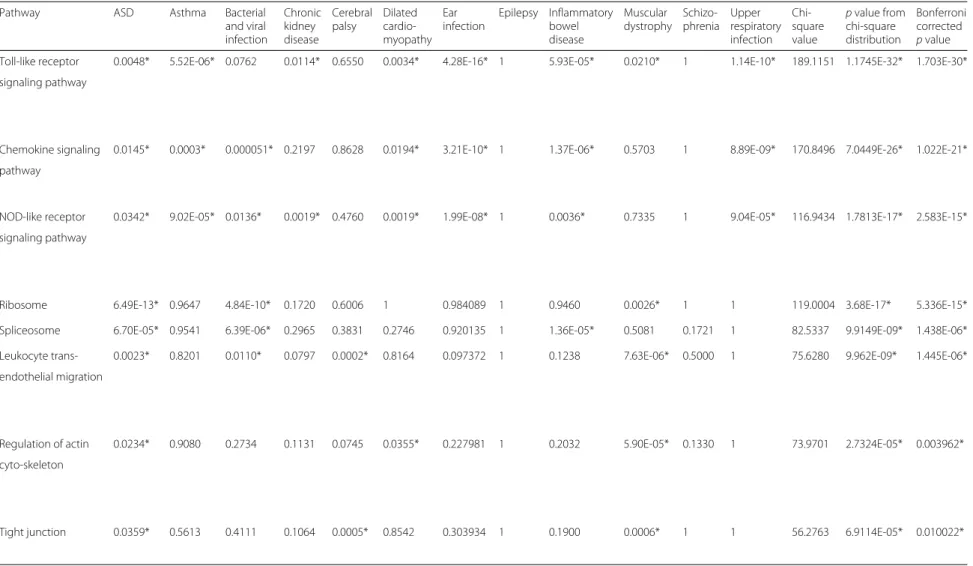
The results demonstrate that pathways that are dys-regulated across ASD and its co-morbidities with the highest statistical significance (i.e., the lowest Bonferroni-corrected combined p value) are all related to innate immunity. For the KEGG, BioCarta, and PID gene sets, the Toll-like receptor signaling pathway was found to be the most significant (Additional file 4). For the KEGG database, the top two significant pathways were Toll-like receptor signaling and chemokine signaling (Table 3 and Additional file 4). The top three significant path-ways, revealed from the analysis of the Reactome data set, include chemokine receptor signaling, innate immunity, and Toll-like receptor signaling (Additional file 4). When we expanded our aperture of analysis to the gene sets from all canonical pathways, the Toll-like receptor signaling and chemokine signaling pathways were still found to be the most significantly dysregulated in the disease conditions (Additional file 4). Thus, we primarily focused our atten-tion on these two pathways in ASD and its co-morbidities and then, for completeness, extended to other innate immunity KEGG pathways that were found significantly dysregulated (Table 3).
Fig. 2Quantile–quantile plots showingpvalue distributions for a combined analysis. It combines pathwaypvalues acrossaASD and all its co-morbidities, andbASD and its non-immune-related co-morbidities.ASDautism spectrum disorder,CKDchronic kidney disease,CPcerebral palsy,DCdilated cardiomyopathy,MDmuscular dystrophy,Sschizophrenia
Both Toll-like receptor signaling and chemokine sig-naling pathways are key pathways in the innate immune response mechanism. Toll-like receptors are the most common pattern recognition receptors that recognize dis-tinct pathogen-associated molecular patterns and partici-pate in the first line of defense against invading pathogens. They also play a significant role in inflammation, immune cell regulation, survival, and proliferation. Toll-like recep-tors activate various signal transduction pathways, which in turn activate expression and synthesis of chemokines, which together with cytokines, cell adhesion molecules, and immunoreceptors, orchestrate the early host response to infection. At the same time they represent an impor-tant link in the adaptive immune response [40]. Our study revealed that the KEGG Toll-like receptor signal-ing pathway, by itself, was significantly dysregulated (with a combinedpvalue of 1.7×10⁻³⁰ after Bonferroni cor-rection) in ASD, asthma, chronic kidney disease, dilated cardiomyopathy, ear infection, IBD, muscular dystrophy, and upper respiratory infection with the minimum poste-rior probability of appearing significant by chance being at most 1 %. In addition, the KEGG chemokine signal-ing pathway was found significantly dysregulated (with a combinedpvalue of 1.02×10⁻²¹after Bonferroni correc-tion) in ASD, asthma, bacterial and viral infection, dilated cardiomyopathy, ear infection, IBD, and upper respira-tory infection with the minimum posterior probability of appearing significant by chance being at most 2.4 % in each case. These findings indicate the role of immune dysfunction in this wide range of seemingly unconnected disease conditions. Although there is some experimen-tal evidence linking an abnormal chemokine response to Toll-like receptor ligands associated with autism [41, 42], no study so far has linked them to the co-morbidities suffered by ASD-affected individuals.
When we looked at the other significant KEGG pathways, we found two others involved in innate immu-nity, namely, the NOD-like receptor signaling and leuko-cyte transendothelial migration pathways. The NOD-like receptor signaling pathway, by itself, was significantly dys-regulated (with a combinedpvalue of 2.6×10⁻¹⁵ after Bonferroni correction and a minimum posterior probabil-ity of the null hypothesis at most 4 %) in ASD, asthma, bac-terial and viral infection, chronic kidney disease, dilated cardiomyopathy, ear infection, IBD, and upper respira-tory infection. The leukocyte transendothelial migration pathway was significantly dysregulated (with a combined pvalue of 1.4×10⁻⁶ after Bonferroni correction and a minimum posterior probability of the null hypothesis at most 1.7 %) in ASD, asthma, cerebral palsy, and muscu-lar dystrophy. Some NOD-like receptors recognize certain types of bacterial fragments; others induce caspase-1 acti-vation through the assembly of multi-protein complexes called inflammasomes, which are critical for generat-ing mature pro-inflammatory cytokines in concert with the like receptor signaling pathway. While the Toll-like receptor, chemokine, and NOD-Toll-like receptor signal-ing pathways have more to do with the recognition of infectious pathogens and initiating response, the leuko-cyte transendothelial migration pathway orchestrates the migration of leukocytes from blood into tissues via a pro-cess called diapedesis, which is vital for immune surveil-lance and inflammation. During this diapedesis of leuko-cytes, the leukocytes bind to endothelial cell adhesion molecules and then migrate across the vascular endothe-lium to the site of infection. Notably, increased permeabil-ity of the blood–brain barrier favoring leukocyte migra-tion into the brain tissue has been implicated in ASD before [43], but not as a shared transcriptomic common-ality among its co-morbidities.
Nazeen et al. Genome Biology (2016) 17:228 Page 7 o f 1 9
Table 3KEGG pathways significantly shared among ASD and its co-morbiditiesa
Pathway ASD Asthma Bacterial Chronic Cerebral Dilated Ear Epilepsy Inflammatory Muscular Schizo- Upper Chi- pvalue from Bonferroni
and viral kidney palsy cardio- infection bowel dystrophy phrenia respiratory square chi-square corrected
infection disease myopathy disease infection value distribution pvalue
Toll-like receptor 0.0048* 5.52E-06* 0.0762 0.0114* 0.6550 0.0034* 4.28E-16* 1 5.93E-05* 0.0210* 1 1.14E-10* 189.1151 1.1745E-32* 1.703E-30*
signaling pathway
Chemokine signaling 0.0145* 0.0003* 0.000051* 0.2197 0.8628 0.0194* 3.21E-10* 1 1.37E-06* 0.5703 1 8.89E-09* 170.8496 7.0449E-26* 1.022E-21*
pathway
NOD-like receptor 0.0342* 9.02E-05* 0.0136* 0.0019* 0.4760 0.0019* 1.99E-08* 1 0.0036* 0.7335 1 9.04E-05* 116.9434 1.7813E-17* 2.583E-15*
signaling pathway
Ribosome 6.49E-13* 0.9647 4.84E-10* 0.1720 0.6006 1 0.984089 1 0.9460 0.0026* 1 1 119.0004 3.68E-17* 5.336E-15*
Spliceosome 6.70E-05* 0.9541 6.39E-06* 0.2965 0.3831 0.2746 0.920135 1 1.36E-05* 0.5081 0.1721 1 82.5337 9.9149E-09* 1.438E-06*
Leukocyte trans- 0.0023* 0.8201 0.0110* 0.0797 0.0002* 0.8164 0.097372 1 0.1238 7.63E-06* 0.5000 1 75.6280 9.962E-09* 1.445E-06*
endothelial migration
Regulation of actin 0.0234* 0.9080 0.2734 0.1131 0.0745 0.0355* 0.227981 1 0.2032 5.90E-05* 0.1330 1 73.9701 2.7324E-05* 0.003962*
cyto-skeleton
Tight junction 0.0359* 0.5613 0.4111 0.1064 0.0005* 0.8542 0.303934 1 0.1900 0.0006* 1 1 56.2763 6.9114E-05* 0.010022*
ASDautism spectrum disorder,KEGGKyoto Encyclopedia of Genes and Genomes
aThe entries with value ‘1’ indicate where there was no overlap between the pathway and the disease gene set *Entries with significantpvalues
To confirm that the presence of multiple significant innate-immunity-related pathways among ASD and its co-morbidities was due to shared biology, we repeated the combinedpvalue analysis excluding the immune-related diseases (bacterial and viral infection, asthma, IBD, upper respiratory infection, and ear infection). Innate immunity pathways (leukocyte transendothelial migration, Toll-like receptor signaling, and NOD-like receptor signaling path-ways) still appeared among the most significant dysreg-ulated pathways shared by ASD, cerebral palsy, chronic kidney disease, and muscular dystrophy. The QQ plot of combinedpvalues of pathways across ASD and its non-immune-related co-morbidities shows marked enrich-ment of significant p values indicative of the shared disease biology of these conditions (Fig. 2b). Additional file 1: Table S2 shows the most significant KEGG pathways that are shared by ASD and its non-immune-related co-morbidities. For other pathway gene set collections, the complete lists of Fisher’s combinedpvalues per pathway per disease are provided in Additional file 6.
Disease–innate immunity pathway overlap at gene level
To examine the shared innate immunity KEGG path-ways through a finer lens, we examined the genes that overlapped with them (Table 4 and Additional file 3: Figure S4). Although these pathways have a broad involve-ment in a variety of diseases, a small number of genes in these pathways appear dysregulated most often in ASD and its co-morbidities. Thus, we took a closer look at the genes that are shared by ASD and at least one of its co-morbid conditions.
In the Toll-like receptor signaling pathway, as shown in Fig. 3a, commonly shared, differentially expressed genes include CD14 and LY96 (also known as MD-2), responsi-ble for mediating the lipopolysaccharide response, which itself has been shown to create an autism-like phenotype in murine model systems [44], but has never been linked to the shared biology of ASD, cerebral palsy, dilated car-diomyopathy, muscular dystrophy, and IBD. The widely expressed Toll-like receptors, especially, TLR1, TLR2, and TLR9, mediate the recognition of foreign substances, including infectious pathogens, and the regulation of the subsequent cytokine production required for the immune response. Although these genes have been known to be involved in immunity-related conditions, they have not been implicated in the co-occurrence of such conditions in ASD patients. Other genes involved were CCL4, also
known as Macrophage inflammatory protein 1β
(MIP-1β), which is the most upregulated chemokine in natu-ral killer cells of children with autism [45]; MAPK21, a gene upstream of the MAP-kinases that mediates multiple intra- and extra-cellular signals; JUN (a subunit of tran-scription factor AP-1), which regulates gene expression in response to a variety of stimuli, including cytokines,
growth factors, stress, and bacterial and viral infections; SPP1 (also known as OPN), a cytokine that upregulates expression of interferon-γ (IFN-γ), which itself has been implicated in ASD and other diseases characterized by social dysfunction [46]; and TBK1, a gene that can medi-ate NFκB activation in response to certain growth factors and is often considered as a therapeutic target for inflam-matory diseases.
In the chemokine pathway, as shown in Fig. 3b, the com-monly shared genes include the chemokines (e.g., CCL4, which had altered expression levels in asthma and ear infection) and MAP-kinases (e.g., MAP2K1, which had altered expression levels in ASD, dilated cardiomyopa-thy, ear infection, and muscular dystrophy). The HCK gene, which belongs to the Src family of tyrosine kinases, showed altered expression levels in ASD, asthma, IBD, ear infection, bacterial and viral infection, and muscu-lar dystrophy. Considering HCK’s role in microglia and macrophages in controlling proliferation and cell sur-vival [47], this finding is not surprising. JAK2, which is dysregulated in ASD and its multiple immune-related co-morbidities, regulates STAT3 activity, which in turn transduces interleukin-6 (IL-6) signals. Increased IL-6 in the maternal serum has been known to alter fetal brain development, impairing social behaviors in the offspring [48, 49]. The alpha and beta subunits of G-proteins, dys-regulated in ASD, asthma, IBD, and bacterial and viral infections, are important signaling molecules, which are often considered to have weak links to a number of brain conditions. The RAP1B gene, a member of the RAS family, regulates multiple cellular processes includ-ing cell adhesion, growth and differentiation, and integrin-mediated cell signaling. This protein also plays a role in regulating outside-in signaling in platelets, and G-protein coupled receptor signaling. Thus, it may be of importance.
In the NOD-like receptor signaling pathway, the genes
NOD1 and NOD2 drive the activation of NFκB and
MAPK, the production of cytokines, and apoptosis. The BIRC2 and BIRC3 genes (which had altered expressions in ASD, asthma, ear infection, and bacterial and viral infections) are members of the inhibitor-of-apoptosis pro-tein family and are key regulators of NOD1 and NOD2 innate immunity signaling. In the leukocyte transendothe-lial migration pathway, the TXK gene, which is a non-receptor tyrosine kinase (with altered expression in ASD, ear infection, IBD, and bacterial and viral infections), specifically regulates IFN-γ gene transcription and the development, function, and differentiation of conven-tional T cells and nonconvenconven-tional NKT cells. Mutation of the TXK gene has been identified to be a segregat-ing factor for a number of neurodevelopmental disor-ders, including ASD, bipolar disorder, and intellectual disabilities [50].
Nazeen et al. Genome Biology (2016) 17:228 Page 9 o f 1 9
Table 4Differentially expressed genes in ASD and co-morbidities that overlap with innate immunity pathways
Toll-like receptor signaling pathway Chemokine signaling pathway NOD-like receptor signaling pathway Leukocyte transendothelial migration pathway
Autism spectrum disorder TLR9, MAP2K4, CCL4, LY96, CCL4, JAK2, GRK7, CCL17, BIRC3, MAPK13, SUGT1, PSTPIP1, TXK, NCF2, JAM2, GNAI2, GNAI3,
CD14, TAB2, MAP2K2, MAPK13, CCL21, CCL22, GNB3, GNAI2, PYCARD, TAB2, BIRC2 CLDN23, ACTN3, ICAM1, ACTN1, MAPK13,
MAP2K1, TBK1, TLR1, TLR2 CCR2, CXCR3, GNAI3, CCR10, CD99, RAP1B, CLDN14, MSN
ADCY6, PREX1, HCK, MAP2K1, RAP1B
Asthma STAT1, IKBKE, NFKB1, RELA, STAT1, CCL2, GNB4, JAK2, CXCL1, RIPK2, BIRC3, CCL2, TXK, ACTN2, ICAM1
TLR7, TICAM1, IL8, IFNAR1, CCL20, NFKB1, RELA, CXCL5, IL8, CASP5, NFKB1, RELA,
IFNAR2, TICAM2, CD40, CXCL9, XCR1, PLCB1, CXCL1, PRKCD, CXCL2, IL6
TLR3, IL6, IRF7 HCK, IL8, CCL1, CXCL2,
CXCL9, LYN
Chronic kidney disease JUN, CTSK, NFKBIA, FOS CCL17, NFKBIA, CXCR6 NFKBIA, HSP90AA1, NLRC4, CLDN16, ACTN4, CLDN9
HSP90AB1
Cerebral palsy CD14 CCL2 CCL2 JAM3, MMP2, VCAM1, ACTN4, ACTG1,
MSN, CTNNA3
Dilated cardiomyopathy MYD88, LY96, CD14, NFKBIA, CCL2, CCL11, CCL8, NFKBIA, RIPK2, CCL2, CCL11, CCL8, PIK3R1
MAP2K1, PIK3R1 MAP2K1, CCR1, PIK3R1 NFKBIA
Ear infection JUN, CD86, STAT1, CCL3, STAT3, STAT1, STAT2, CCL2, CASP8, CXCL1, RIPK2, TNF, TXK, NCF4, VCAM1, PIK3R5, CLDN23,
MYD88, CCL5, CCL4, LBP, CCL3, CCL5, CCL4, CX3CR1, BIRC3, CCL2, CCL5, CCL11, CLDN10, CLDN8, MYL9, CLDN5, ICAM1,
TLR6, MAP3K8, CD14, IKBKE, CCL11, CCL7, CXCL14, JAK3, CCL7, MEFV, CASP1, TNFAIP3, ACTN4, CLDN19, CLDN22, RASSF5,
NFKB1, NFKBIA, PIK3R5, TLR5, JAK2, CCL17, CCL20, CCL19, MAPK3, NFKB1, NFKBIB, NFKBIA, CLDN7, CLDN4, PIK3R2
ITIRAP, RELA, TOLLIP, CXCL11, CCL22, NFKB1, NFKBIB, NFKBIA, IL18, RELA, IL1B, NLRP3,
TLR7, TLR8, CXCL10, CASP8, PIK3R5, RELA, GNG7, FGR, GNG11, BIRC2, CXCL2, IL6
TNF, IL12B, MAP2K3, MAP2K1, GNGT2, XCL1, CXCL5, ADCY3, CXCL11,
MAP2K6, MAPK3, IL1B, CD40, ADCY2, CXCL10, CXCL1, PLCB3,
TBK1, CXCL9, TLR3, TLR4, CXCR5, CXCR2, GNG8, HCK,
TLR1, FOS, TLR2, IL6, MAP2K1, CCR5, CCR7, MAPK3,
IRF7, PIK3R2 CXCL16, CCR1, CXCL13, CXCL2,
CXCL3, CXCL9, LYN, PIK3R2
Genome Biology (2016) 17:228 Page 10 of 19
Inflammatory bowel disease CD86, MYD88, CCL4, LY96, CCL2, CCL4, CCL11, CCL7, CHUK, CXCL1, BIRC3, CCL2, TXK, ITGA4, NCF4, MMP9, NCF2,
MAP3K8, AKT1, CD14, CTSK, AKT1, CCL18, ARRB2, CCL20, CARD6, CCL11, CCL7, IL8, MYL12A, THY1, GNAI2, MYL5, RHOH,
SPP1, TOLLIP, CXCL11, TLR8, GNG5, GNB3, GNB2, CCL24, CASP5, CASP1, MAPK3, IL1B, CLDN8, MYL9, CLDN15, MYL12B, RAP1A,
CXCL10, TICAM1, CHUK, IL8, PRKX, GNG10, GNAI2, GNG11, NLRP1, CXCL2, HSP90AB1 PIK3CA, MSN, VAV3
MAP2K3, IL12A, MAPK3, IRF3, XCL1, CXCL11, CXCL6, CCR10,
IL1B, PIK3CA, CXCL9, TLR4, CXCL10, ADCY6, CHUK, CXCL1,
TLR1, TLR2 PLCB3, CXCR2, CXCR1, HCK,
IL8, ADCY4, PRKCZ, MAPK3, CCR1, XCL2, CXCL13, RAP1A, PF4, CXCL2, CXCL3, PF4V1, PIK3CA, CXCL9, PPBP, VAV3, LYN
Bacterial and viral infection TLR9, MYD88, CCL5, LY96, STAT3, STAT2, CCL5, DOCK2, CHUK, RIPK2, CCL5, NOD1, TXK, ITGAM, NCF4, MMP9, NCF2, VAV1,
CD14, NFKBIA, TLR5, TLR8, JAK2, VAV2, NRAS, NFKBIA, CARD6, CCL8, CARD8, CASP5, VASP, MYL12A, VAV2, ITGB2, CTNNA1,
CHUK, IRAK4, MAP2K7, IRF3, GNG7, GNG5, GNB2, GNG10, NOD2, NFKBIA, IKBKG, PYCARD, GNAI3, EZR, PLCG1, RHOH, PRKCA,
IKBKG, TICAM2, IL1B, TBK1, GNG11, ADCY3, CXCR3, CCL4L1, NLRC4, IL1B, BIRC2 ESAM, RAC2, CD99, ITK, NCF1, CYBA,
TLR4, TLR1, FOS, TLR2, GNAI3, GNB1, SOS2, CHUK, CYBB, MYL5, RHOA
IRF7 RAF1, RHOA, CXCR2, CXCR1,
PRKCD, HCK, RAC2, RASGRP2, ADCY4, CCR3, CCR4, CXCR6, CCR7, GRB2, IKBKG, HRAS, GSK3B, CCR1, ITK, NCF1, PPBP, LYN
Muscular dystrophy LY96, CD14, CTSK, SPP1, GNG10, HCK, MAP2K1, GNG12 PYCARD JAM3, MMP2, NCF2, VCAM1, ITGB2,
MAP2K1, FOS JAM2, MYL5, CD99, ACTG1, MYL12B,
MSN, CYBA
Schizophrenia – – – CD99
Upper respiratory infection CCL4, CXCL11, CXCL10, IFNB1, STAT2, CCL2, CCL4, CCL7, CCL2, CCL7, IL6 –
CXCL9, IL6, IRF7 CXCL11, CXCL10, CXCL9
Nazeenet al. Genome Biology (2016) 17:228 Page 11 of 19
Fig. 3 aToll-like receptor signaling pathway color-tagged by co-morbidity findings.bChemokine signaling pathway color-tagged by co-morbidity findings. Genes were mapped onto corresponding KEGG pathway using the “user data mapping tool” from KEGG [91, 92]. Genes are represented by
rectangular boxeson KEGG pathways. We put color tags on a gene to indicate in which diseases it is differentially expressed. Sometimes a set of genes are mapped onto a singlebox. In that case, the color tags on thatboxrepresent the union set of all diseases in which those genes are differentially expressed.ASDautism spectrum disorder,CKDchronic kidney disease,CPcerebral palsy,DCdilated cardiomyopathy,EIear infection,
IBDinflammatory bowel disease,Infectionbacterial and viral infection,KEGGKyoto Encyclopedia of Genes and Genomes,MDmuscular dystrophy,
URIupper respiratory infection
Besides the immune-related ones, Table 3 documents several other pathways and gene sets including the ribo-some and spliceoribo-some gene sets, which have roles in genetic information processing and translation and the
actin cytoskeleton regulation pathway, which controls var-ious cellular processes like cell motility. Neuronal signal processing and neuron motility have often been associ-ated with ASD, thus these findings are not surprising. The
genes in the tight junction pathway mediate cell adhesion and are thought to constitute the intra-membrane and para-cellular diffusion barriers. These findings implicate the involvement of these cellular processes in the shared pathology of ASD and its co-morbidities.
Discriminatory power of innate immunity pathway genes
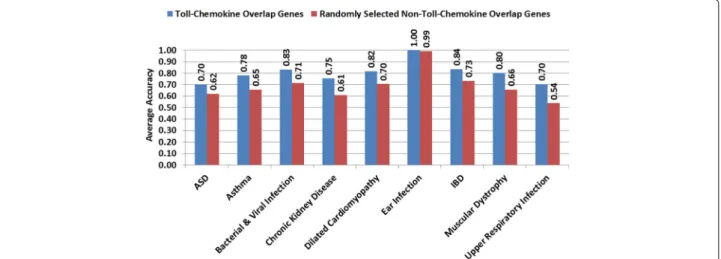
We assessed the discriminatory power of the innate immunity pathway genes, by taking the union of the genes from the chemokine signaling and Toll-like receptor signaling pathways and performing threefold SVM classi-fication of cases vs. controls for each of the 12 disease con-ditions. We could achieve an average accuracy of at least 70 % (Fig. 4). We also performed the same classification using the same number of randomly selected genes that do not overlap with these pathways. With randomly selected genes, the classification accuracy was much lower. This result suggests that the genes that have altered expres-sions in the diseases examined and are present in these innate immunity pathways were sufficient to partially dis-tinguish the disease states from the controls. When we included the overlapping genes in the NOD-like recep-tor signaling and transendothelial migration pathways in this analysis, the classification accuracy was at least 65 % (see Additional file 3: Figure S5), which was still bet-ter than for the randomly selected non-immune genes. In fact, a recent functional genomic study showed that immune/inflammation-related genes can provide reason-able accuracy in the diagnostic classification of male infants and toddlers with ASD [51].
Discussion
This study bridges previous analyses based on the elec-tronic health records of the co-morbidities of large
populations of individuals with ASD and the gene expres-sion profiles of each of these co-morbid diseases as well as ASD against their respective control cases. We have identified that the most significantly and consistently dys-regulated pathways shared by these diseases are the innate immunity signaling pathways. For most of these disor-ders, the genes in these pathways can classify the disorders with respect to their controls with moderate accuracy, fur-ther evidence of the extent of the dysregulation in these pathways.
In contrast to traditional approaches that look at a group of disorders of the same organ system, we have focused on ASD and its co-morbidities, which often occur in different organ systems, with a view to finding their shared genetics. It would have been ideal to perform the study on a sufficiently large cohort of ASD patients hav-ing enough representatives of all the co-morbid diseases, but in practice, such a study is currently infeasible due to cost constraints and/or patient availability. Thus, to per-form this study with existing data sets for ASD and its co-morbidities, we make use of the power of statistics and computation. First, we look at the functional genomic makeup of patients with ASD and its co-morbid dis-eases separately, and then find the commonalities between them. Some of the microarray studies we looked at have small sample sizes, which gives rise to the possibility of poor random error estimates and inaccurate statisti-cal tests for differential expression. For this reason, we selected limma t-statistics, an empirical Bayes method [52], which is reportedly one of the most effective meth-ods for differential expression analysis even for very small data sets [53]. To find the combined significance of the pathways across multiple diseases, we used Fisher’s com-bined probability test [39], because, it gives a single test
Fig. 4Accuracy of classification for case–control groups in different diseases using differentially expressed genes that overlap in the KEGG Toll-like receptor signaling and chemokine signaling pathways versus randomly selected disease genes that do not overlap in the innate immunity pathways. Diseases for which the differentially expressed genes are not over-represented in the Toll-like receptor signaling and chemokine signaling pathways, are omitted here.ASDautism spectrum disorder,IBDinflammatory bowel disease,KEGGKyoto Encyclopedia of Genes and Genomes
Nazeenet al. Genome Biology (2016) 17:228 Page 13 of 19
of significance for a number of not-so-correlated tests of significance performed on very heterogeneous data sets. When the individual tests do not appear as significant, yet have a combined effect, Fisher’s combinedpvalue can indicate whether the probability of the combined effect is on the whole lower than would often have been obtained by chance. Notably, a significant statistic from Fisher’s test implies that the pathway is involved in the biology of at least one of the diseases. Thus, to ensure that the com-bined significant statistic is due to the shared biology of multiple diseases, we calculate minimum BFs and mini-mum posterior probabilities of significance by chance for each significant pathway, and also compare the combined pvalue distributions of diseases and the null data set using QQ plots. We draw our conclusions using a combination of thepvalues and the posteriors to avoid any systematic bias inherent to the methods used.
As expected for a neurological disease, the pathways that are most significantly dysregulated in ASD are often the pathways involved in neuronal signaling and devel-opment, synapse function, and chromatin regulation [12]. Similarly, for immune-related diseases, like, asthma, IBD, and various infections, the role of innate immunity path-ways is well documented in individual studies [54–60]. Despite some controversy, in the last 15 years, exper-imental evidence has also pointed in the direction of dysregulated immunological signaling in at least some subsets of individuals with autism. This evidence includes findings of an abnormal chemokine response to Toll-like receptor ligands associated with autism in experimental studies [41, 42], and differential gene and protein expres-sion in the central nervous system and peripheral blood of patients with ASD [35, 41, 61–68]. Many reports suggest the alteration of the activation, amount, and distribu-tion of microglia, a representative immune cell in the brain, and its autophagy to be involved in ASD [69–72]. A recent study implicates adaptive immune dysfunction, in particular, disruption of the IFN-γ signaling driven anti-pathogen response, to be related to ASD and other dis-eases characterized by social dysfunction [46]. However, that dysregulation of innate immunity pathways connects ASD with some of its non-immune-related co-morbidities (e.g., chronic kidney disease, cerebral palsy, and muscular dystrophy) is rather intriguing.
That the innate immunity pathways are shared between ASD and the other co-morbid states does not mean that all cases of ASD are characterized by a disorder in these path-ways. For example, in our previous work we have shown that although, on average, the gene expression profile of children with ASD shows dysregulated innate immunity signaling, this is a reflection of the smaller number of individuals with ASD who are outliers in this pathway [73]. With our growing understanding of the heterogene-ity of ASD and the characterization of ASD populations
with distinct co-morbidity associations [25], the integra-tive analysis we describe here may, therefore, implicate a subset of individuals with ASD with innate immune dys-regulation that is either the result of genetic vulnerabilities [74] or particular exogenous stimuli such as infections or disordered microbiome ecologies [75].
Although it is tempting to consider that innate immu-nity signaling is primarily driven by external environ-mental stimuli such as infection, we have to recognize that the same signaling mechanisms may be repurposed by different organs for different purposes. For example, 21 % of the genes described in the KEGG long-term potentiation pathway (one of the mechanisms underlying synaptic plasticity) overlap with the genes in the Gene Ontology’s collection of immune genes. It may be, as suggested by large epidemiological studies, that some-times the disorder is in the signaling system and at other times it is because of an external stimulus. Specifically, nationally scaled studies have demonstrated increased autoimmune disease frequency in the parents of children with ASD [76], increased gestational C-reactive protein in mothers of children with ASD [77], and increased fre-quency of ASD after pregnancies complicated by infection [78, 79]. Some early studies also suggest the infectious exposure may be directly from the gastrointestinal micro-biome [80–84], which also can engage the innate immune system. The success of treatment and/or prophylaxis for disorders of innate immunity in some of the diseases that are co-morbid with ASD raises the possibility that similar treatments may also be successful for subsets of those with ASD.
Conclusions
Over the years, ASD has baffled researchers not only with its heterogeneity, but also its co-occurrence with a number of seemingly unrelated diseases of different organ systems. In this study, we introduced a three-tier meta-analysis approach to capture the shared genetic sig-nals that form the basis of ASD’s co-occurrence with other diseases. For ASD and 11 of its most frequently occurring co-morbidities, we extracted significant differ-entially expressed genes, measured their enrichment in canonical pathways, and determined the pathways that are shared by the diseases in question in a statistically rigorous fashion. An analysis of this scale for studying ASD and its co-morbidities is unheard of as per our knowledge. Our results reveal the involvement of two disrupted innate immunity pathways – Toll-like receptor signaling and chemokine signaling – in ASD and sev-eral of its co-morbidities irrespective of whether they are immune-related diseases or not. We also showed that the disease genes that overlapped with these pathways could discriminate between patients and controls in each dis-ease with at least 70 % accuracy, further proving their
importance. As innate immunity pathways are impera-tive in orchestrating the first line-of-defense mechanism against infection-causing pathogens and environmental triggers, their involvement in ASD and its co-morbidities can be thought of as the missing genetic link for environ-mental factors in the pathophysiology of ASD. This mind-set also raises the possibility that successful treatments for innate immunity disorders may help ASD patients. Methods
Overview of the three-tiered meta-analysis
To analyze genome-wide expression studies across ASD and 11 of its co-morbidities (Table 1), we introduced a step-wise three-tiered meta-analysis pipeline (Fig. 1). Our meta-analysis started at the gene level, in which we first identified the genes that are differentially expressed among cases and controls for a given disease. We then extended this analysis to the pathway level, where we investigated the pathways that were significantly enriched in candidate genes for a given disease. Finally, we iden-tified the pathways that were significant across multiple diseases by newly combining pathway-level results across diseases and performing a Bayesian posterior probability analysis of null hypotheses for pathways in each disease as well as in the combined case. Details are described below.
Gene-centric expression analysis per disease
Using the GEOquery package [85] from Bioconductor in R, we downloaded the gene expression data for each dis-ease in gene matrix transposed (GMT) format from the Gene Expression Omnibus (GEO). The accession identi-fiers for the disease studies are listed in Additional file 1: Table S1. We removed ‘NA’ values from the data and log-normalized the expression values for subsequent analysis. Then, we performed differential expression analysis on each data set using the limma package [52] from Biocon-ductor in R, and obtainedpvalues for each gene in each experiment.
To determine the degree of correlation between the dif-ferential expression analyses of thepvalues of data sets selected under each disease, we calculated the pairwise Pearson correlation coefficient of p values (Additional file 1: Table S3). Considering a Pearson correlation coeffi-cient of at least 0.30 withp<0.05 as significant, we found that thepvalues are not significantly correlated. This lack of correlation allowed us to use Fisher’s combined prob-ability test to calculate combinedpvalues for the genes in each disease condition. We used Fisher’s combined probability test as follows:
P∼χ2= −2 k
i=1 ln(pi).
Here, pi is thepvalue of test i, χ2is the chi-squared distribution,kis the number of tests, andPis the adjusted pvalue (p<0.05 was considered significant).
Selecting the most informative FDR correction test for multiple comparisons
To adjust the combined pvalues, we considered differ-ent FDR corrections [i.e., Bonferroni, Benjamini–Yekutieli (BY), and Benjamini–Hochberg (BH)]. We also considered the ‘no correction’ case for completeness. We selected the most informative one, based on the level of accuracy we could achieve in classifying cases of a particular dis-ease, vs. controls, using the genes selected under a specific test with a significance cutoff of p < 0.05. We tested the accuracy of the case–control classification for each of the 53 disease data sets using four different classifica-tion methods, namely, naive Bayes method, Fisher’s linear discriminant analysis,knearest neighbor, and SVM. The set of significant genes selected under different FDR cor-rections was considered as a feature of the classification methods. We performed threefold cross validation and calculated the average accuracy. We selected the FDR cor-rection test that produced the best average accuracy in each disease. See Additional file 3: Figure S1 and the sup-plementary text on different classification techniques for microarray gene expression data provided in Additional file 7 for more details.
Pathway-centric enrichment analysis per disease
From the disease-level gene-centric expression analysis, we obtained a list of significant genes per disease. For each disease, we then performed a hypergeometric enrichment test for each pathway. This test uses the hypergeomet-ric distribution to calculate the statistical significance of kor more significant disease genes, out ofntotal genes, appearing in a specific pathway gene set. It helps identify whether or not the specific disease gene set is over-represented in a certain pathway, by providing apvalue per pathway per disease.
Disease-centric analysis of pathways
Once we obtained the p values for the pathways per
disease, first we calculated the pairwise Pearson corre-lation of pathway p values across diseases (Additional file 1: Table S4). Since the distributions were not signif-icantly correlated (Pearson correlation coefficient<0.30 withpvalue<0.05), we safely assumed the distributions to be independent. Next, we calculated combined p val-ues for each pathway across all the diseases using Fisher’s combined probability test. We corrected for multiple comparisons using Bonferroni correction. We defined a significance threshold of adjustedpvalue<0.05 and called any pathway that passed this threshold, significant. We restricted our results to the pathways that appeared sig-nificant in ASD.
Nazeenet al. Genome Biology (2016) 17:228 Page 15 of 19
Calculation of priors, minimum BFs, and minimum posterior probabilities of null hypotheses
To estimate the prior probability of pathways, we selected a publicly available GEO study of 109 gene expression pro-files of blood drawn from healthy individuals enrolled at a single site (GEO accession: GSE16028). We assigned case– control labels randomly to the samples and performed differential expression analysis using R package limma. We selected differentially expressed genes using uncor-rectedpvalues (<0.05), because after BY correction none of the genes remained significant. On the significant gene list, we performed hypergeometric enrichment analysis to obtain a pathwaypvalue distribution. We repeated this process 100 times to obtain 100 nullpvalue distributions. We calculated the prior for each pathway by looking at how many times the pathway appeared significant (pvalue
<0.05) during these 100 runs. We took an average of the 100 distributions to obtain the nullpvalue distribution.
The null hypothesis for pathwaypvalues is thatpvalues are uniformly distributed and the alternative hypothesis is that smallerpvalues are more likely than largerp val-ues. Following the approach of Sellke, Bayarri, and Berger [86], we estimated the minimum BFs using the following formula:
BF=
−eplog(p), ifp< 1e,
1, otherwise,
whereeis Euler’s constant.
For calculating minimum BFs for χ2-distributed test statistics, we used Johnson’s formula [87]:
BF= (v x)− v 2exp(−x−v 2 ), forx>v, 1, otherwise,
where x is the chi-square statistic that gave rise to the observedpvalue andvis the degrees of freedom.
Following Goodman’s approach [88], we used the prior probability distribution drawn from the null data set and the minimum BF to estimate a lower bound on the pos-terior probability of the null hypothesis based on Bayes’ theorem as follows:
Minimum Posterior Probability= 1+ BF×q 1−q −1−1
whereqis the prior probability.
The null distributions and priors for all KEGG pathways and the minimum BFs, and minimum posterior probabil-ities of null hypotheses for KEGG pathways are given in Additional file 5.
Measuring the discriminatory power of overlapping innate immunity genes
We performed threefold classification and measured the average accuracy of the case–control classification for
each disease with the SVM classifier using the union set of the genes from KEGG Toll-like receptor signal-ing and chemokine signalsignal-ing pathways shared across ASD and its co-morbidities to see how well the over-lapping genes could distinguish the disease state from controls and compared it with the classification accu-racy using randomly selected genes that do not over-lap with these two pathways (Fig. 4). We repeated the same test for the overlapping genes in the four innate immunity KEGG pathways and compared the classifi-cation accuracy with the discriminatory power of ran-domly selected non-immunity genes (Additional file 3: Figure S5).
Data set selection
Gene expression data sets
We selected 11 disease conditions that co-occur most commonly in ASD patients. Each of these diseases has at least 5 % prevalence in ASD patients [25]. The prevalence of a co-morbid condition can be defined in two ways: (i) the percentage of ASD patients having a co-morbid dis-ease and (ii) the percentage of patients with a co-morbid disease having ASD [24]. The diseases that satisfy either of these criteria include asthma, bacterial and viral infection, cerebral palsy, chronic kidney disease, dilated cardiomy-opathy, ear infection/otitis media, epilepsy, IBD, muscular dystrophy, schizophrenia, and upper respiratory infection. Table 1 shows the disease groups along with the literature references.
To identify publicly available studies relevant to these co-morbidities, we performed an extensive literature search of the GEO of the National Center for Biotech-nology Information (NCBI) [89, 90]. Using the advanced search tool provided by GEO, we searched series data sets from studies that performed expression profiling by array on either human or mouse. The search results were parsed using a custom-built parser. It identified 1329 GEO studies for ASD and 11 of its co-morbidities that have been pub-licly available since 2002. We verified the search results by hand to remove false positives. From the hand-curated results, we retained only those series that corresponded to case–control studies and had complete gene annotations supplied by either NCBI or the submitter. We investigated whether case–control studies had matched controls for the disease cases as well as to reduce noise. We made sure that we had at least 30 samples under each disease. For each selected GEO series, the accession identifier as well as abridged study details including the organism, tis-sue type, platform, and number of samples is provided in Additional file 1: Table S1. To remove the potential for biases that could arise from using gene expression data sets from different array platforms, tissues, and species, we avoided combining the actual measurements of expression values across platforms, tissues, and diseases.
Instead, we performed differential expression analysis on each study separately and then combined the p values only.
Pathway gene sets
We collected 1320 curated pathway gene sets, includ-ing those from the KEGG pathways [91, 92], Reac-tome pathways [93, 94], BioCarta pathways [95], PID pathways [96], SigmaAldrich gene sets, Signaling Gate-way gene sets, Signal Transduction KE gene sets, and SuperArray gene sets from the Molecular Signatures Database (MSigDb) version 4.0 [97]. The gene sets were downloaded in GMT format. Of the available gene sets, we used those that were expert-curated: C2:CP (canonical pathways), C2:CP-BioCarta (BioCarta gene sets), KEGG (KEGG gene sets), C2:CP-Reactome (C2:CP-Reactome gene sets), and PID (Pathway Inter-action Database gene sets extracted from C2). From the KEGG collection, we excluded the disease- and drug-related gene sets. After excluding too large (>300 genes) and too small (<10 genes) gene sets, 1261, 146, 211, 629, and 196 gene sets remained in these categories, respectively.
Additional files
Additional file 1: Supplementary tables. This PDF file contains supplementary Tables S1 through S4. (PDF 218 kb)
Additional file 2: Differential expression analysis of genes. This Excel file contains differential expression analysispvalues per gene per disease under different FDR corrections [i.e., Bonferroni, Benjamini–Yekutieli (BY), and Benjamini–Hochberg (BH)] as well as ‘no correction’. For presentation purposes, the genes that are not significant even under the ’no correction’ case, have been omitted. (XLS 54 kb)
Additional file 3: Supplementary figures. This PDF file contains supplementary Figures S1 through S5 and their captions. (PDF 8110 kb)
Additional file 4: Pathway enrichment analysis. This Excel file contains hypergeometric testpvalues per pathway per disease for KEGG, BioCarta, Reactome, and PID pathway collections as well as all canonical pathway gene sets collected from MSigDB version 4.0., and Fisher’s combinedp values for ASD and its co-morbidities. (XLS 1444 kb)
Additional file 5: Posterior probability analysis. This Excel file contains the minimum Bayes factors and minimum posterior probabilities for null hypotheses for the significant KEGG pathways. It also contains the 100 pathwaypvalue distributions generated by permuting the null data set. Finally, it has Fisher’s combinedpvalues for ASD and its co-morbidities with the nullpvalue distribution (one sheet per disease). (XLSX 380 kb)
Additional file 6: Pathway enrichment analysis for non-immune diseases.
This Excel file contains hypergeometric testpvalues per pathway per disease for KEGG, BioCarta, Reactome, and PID pathway collections as well as all canonical pathway gene sets collected from MSigDB version 4.0, and Fisher’s combinedpvalues for ASD and its co-morbidities excluding the immune-related diseases: bacterial and viral infection, asthma, inflammatory bowel disease, upper respiratory infection, and ear infection. (XLS 673 kb)
Additional file 7: Supplementary text. This PDF file contains the supplementary text describing the four different classification techniques we used for classifying cases vs. controls in microarray gene expression data from ASD and its co-morbidities. (PDF 196 kb)
Abbreviations
ASD: Autism spectrum disorder; BF: Bayes factor; BH: Benjamini–Hochberg correction; BY: Benjamini–Yekutieli correction; CNV: Copy number variation; FDR: False discovery rate; GEO: Gene Expression Omnibus; GMT: Gene matrix transposed; IBD: Inflammatory bowel disease; IFN: Interferon; IN interleukin; KEGG: Kyoto Encyclopedia of Genes and Genomes; MSigDB: Molecular Signatures Database; NCBI: National Center for Biotechnology Information; PID: Pathway Interaction Database; QQ plot: Quantile–quantile plot; SNP: Single nucleotide polymorphism; SVM: Support vector machine
Acknowledgments
The authors thank Prof. Finale Doshi-Velez for providing an initial list of key co-morbid diseases of ASD to consider and initial discussions as well the reviewers and the editor for their very valuable comments, which improved the presentation of the paper significantly.
Funding
SN gratefully acknowledges support from the International Fulbright Science and Technology Fellowship and the Ludwig Center for Molecular Oncology Graduate Fellowship. SN and BB are partially supported by the National Institutes of Health (grant GM081871). IK is supported in part by the National Institutes of Health (grants P50MH106933, P50MH94267, and U54LM008748).
Availability of data and materials
All microarray expression studies included in this analysis are publicly available via the GEO website [98]. The accession ID for each study is provided in Additional file 1: Table S1. All the pathway gene sets used for the analysis are publicly available from the MSigDB website upon registration [99]. All calculations were performed in R version 2.15.1 and Microsoft Excel 2010. Some pre- and post-processing was performed in Python version 2.7.6. The source code and instructions for performing the analysis are licensed under the terms of the MIT License (https://opensource.org/licenses/MIT), and are available from https://github.com/snz20/3TierMA (DOI:10.5281/zenodo.159288).
Authors’ contributions
SN contributed to the study design and data set curation, performed statistical analyses, and wrote the manuscript. NP contributed to the study design and data curation, and advised on statistical analyses. BB and IK led the study design, advised on statistical analyses, and wrote the manuscript with SN. All authors have read and approved the manuscript for publication.
Competing interests
The authors declare that they have no competing interests.
Ethics approval and consent to participate
No ethical approval was required for this study. This study analyses only existing publicly available data generated by others who obtained ethical approval.
Author details
1Computer Science and Artificial Intelligence Laboratory, Massachusetts
Institute of Technology, 77 Massachusetts Avenue, MA 02139 Cambridge, USA.
2Department of Biomedical Informatics, Harvard Medical School, 25 Shattuck
Street, MA 02115 Boston, USA.3Department of Mathematics, Massachusetts Institute of Technology, 77 Massachusetts Avenue, MA 02139 Cambridge, USA. Received: 24 July 2016 Accepted: 12 October 2016
References
1. Loscalzo J, Kohane I, Barabási AL. Human disease classification in the postgenomic era: a complex systems approach to human pathobiology. Mol Syst Biol. 2007;3(1):124.
2. Barabási A-L, Gulbahce N, Loscalzo J. Network medicine: a
network-based approach to human disease. Nat Rev Genet. 2011;12(1): 56–68.
3. Sirota M, Dudley JT, Kim J, Chiang AP, Morgan AA, Sweet-Cordero A, et al. Discovery and preclinical validation of drug indications using compendia of public gene expression data. Sci Transl Med. 2011;3(96):77. 4. Cuthbert BN, Insel TR. Toward the future of psychiatric diagnosis: the