Page 1 of 68
aims to “define the maturity of the technology currently available for offshore wind farms”. This aim is to be achieved through collation and interpretation of relevant information in relation to the following key technological issues (a “state-of-the-art” summary):
• Size and configuration of wind turbines suitable for offshore installations • Support structure design
• Installation, decommissioning and dismantling • Operation and maintenance (O&M), reliability • Electrical transmission and grid connection
The following companies are involved in Work Package 2.1, having responsibilities as stated. • Garrad Hassan and Partners (GH) – work package co-ordinator and electrical
transmission and grid connection
• ENEA – size and configuration of wind turbines • Kvaerner Oil and Gas (KOG)– support structure • Germanischer Lloyd WindEnergie GmbH - standards • VTT – installation and decommissioning
• Vindkompaniet (VKAB) – O&M
CONTENTS
1 INTRODUCTION 1
2 SIZE AND CONFIGURATION 4
2.1 Scaling Trends 4
2.1.1 Scaling laws 4
2.1.2 Summary review of large turbines 5 2.1.3 Size and mass trends in offshore context 9
2.1.4 Large wind turbine cost trends 12
2.1.5 Summary of trends in offshore wind technology 15
2.2 Manufacturers 16
2.2.1 General data sources on manufacturers 16
2.2.2 Geographical regions 21
2.2.3 Summary of blade manufacturers 22
2.2.4 Current status of blade technology 23
2.3 Offshore Prototypes 24
2.3.1 Offshore projects 24
2.4 Gearboxes in the Offshore Context 26
2.5 Future Trends 26 2.6 Bibliography 27 2.6.1 R&D plans/needs 27 2.7 References 28 2.7.1 ENEA 28 2.7.2 GH 28 3 SUPPORT STRUCTURE 29
3.1 Design Development – Piled Foundations 29
3.1.1 Operational experience 29
3.1.2 Piling techniques 29
3.2 Design Development – Gravity Foundations 30
3.2.1 Operational experience 30
2 of 72 3.3.3 Structure types 32 3.4 Icing 33 3.5 Breaking Waves 33 3.5.1 Operational experience 33 3.5.2 Modelling 34
3.5.3 Research for offshore wind 34
3.6 Design Developments 34
4 STANDARDS 36
4.1 General 36
4.2 GL Offshore Standard 37
4.3 Danish Recommendation for Technical Approval of Offshore Wind Turbines (Rekommandation for Teknisk Godkendelse af Vindmøller på Havet) 38 4.4 IEC Offshore Wind Turbine Standards 39
4.4.1 Review 39
4.4.2 Objective of WG03 39
4.4.3 Contents 39
4.5 Offshore Environment 40
4.6 Offshore Industry Standards 41
4.7 EU-Project Recommendations for Design of Offshore Wind Turbines (RECOFF) 43
4.8 References 45 5 PROJECT EXPERIENCE 47 5.1 Methods Used 47 5.2 Problems Encountered 47 5.3 Design Options 48 5.3.1 Assembly design 48 5.3.2 Transportation 48 5.3.3 Erection 49
5.4 Other Sources, Further Area of Work 50
5.5 RTD Priorities 50
5.6 References 51
6 OPERATION AND MAINTENANCE 52
6.1 Introduction 52
6.2 Land Based Comparative Data 52
6.3 Offshore O&M Models 53
6.4 Maintenance Strategies 53
6.5 O&M Offshore Experience 54
6.5.1 Availability 54
6.5.2 Operational expenditure 54
6.5.3 Serviceability 55
6.5.4 Access for maintenance 55
6.6 Designs for Reduced Maintenance 57
6.6.1 Component reliability 57
6.6.2 Corrosion protection 59
6.6.3 Control and condition monitoring 59
6.6.4 Back-up power 59
6.6.5 Conclusions 60
6.7 References 60
7 ELECTRICAL 61
7.1 Electrical Systems within the Wind Turbine 61
7.1.1 Variable or fixed speed 61
7.1.2 Direct drive 63
7.1.3 Scanwind: Windformer concept 63
7.1.4 Voltage level for output 64
7.1.5 Control system and SCADA 64
7.1.6 Robustness 64
3 of 72 7.3 Transmission to Shore 66 7.3.1 Voltage level 66 7.3.2 Offshore substations 66 7.3.3 HVDC 67 7.3.4 Cable installation 69 7.3.5 Energy storage 70 7.4 Summary 70 7.5 References 70 8 GENERAL REFERENCES 72
4 of 72
2.1 Scaling Trends 2.1.1 Scaling laws
Considering all designs upwards of 30 kW (and not exclusively the largest which are demanded for offshore projects), there are approximately 75 commercially marketed wind turbine designs. This number counts as distinct designs of different scale and type of a particular manufacturer but excludes minor variations like the same having the same tower top system on alternative towers (higher or lower, steel or concrete, tubular or lattice type etc.)
Scaling trends need to be interpreted with great care. Data indiscriminately lumped together may suggest spurious trends or at least provide only superficial descriptions rather than insight into basic issues like the inherent specific costs (cost per kW or cost per kWh) trend with up-scaling. Some of the main issues are:
• Geometric similarity – with strict geometric similarity, volume, mass and cost of items will tend to scale as the cube of any characteristic dimension. Very small turbines (say < 30 kW output power rating) are generally too dissimilar to the larger turbines for valid interpretation of inherent scaling rules if all sizes are grouped together.
• Parametric similarity – designs basically similar in concept (e.g. 3 bladed, pitch regulated with glass epoxy blades and tubular tower) may have significantly different choice of key parameters. Tip speed is a key parameter that very directly influences the tower top mass and cost of a wind turbine. Different ratios of power rating or tower height to diameter will also clearly influence mass and cost. These influences can sometimes be effectively considered by normalisation processes allowing more data sets to be grouped together.
• Duty similarity – machine designs, mass and cost are influenced by the class of design site, i.e. the severity of the design wind conditions.
• Stage of development – the latest and largest wind turbines are at the most advanced state of knowledge of the manufacturers with ever increasing emphasis on cost and mass reduction inducing minor and sometimes more major innovations in the design. This can obscure intrinsic scaling trends that would apply if all sizes were at the same stage of technical maturity.
Needless to say there are also many other factors which complicate scaling comparisons like manufacturers prejudices for electric or hydraulic systems, for simple heavy structures or more lightweight optimised structures and more flexible blades etc. Finally in moving beyond technical issues to costs – and the main motive in addressing the technicalities of scaling is to get insight into how they will influence costs of large offshore wind turbines – a large number of non-technical factors are added (exchange rates, labour cost variations globally, marketing ploys, etc.)
It is not intended or appropriate to produce an extended technical discussion on wind turbine scaling issues which has been much addressed in the literature, but it is necessary to update information especially when this project is focused on offshore and the most relevant
5 of 72
2.1.2 Summary review of large turbines
In order to get a snapshot of the current maturity of wind technology especially as it affects large offshore wind turbines, summary information has been extracted (excepting Table 2.1.2.1) from Windkraftanlagen Markt 2000 & 2001 [GH Ref. 1] and from Windenergie 2000 & 2001 [GH Ref. 2]. It represents in part an up-date of material provided [GH Ref. 3] (P Jamieson, GH) to the document [ENEA Ref. 3].
Diameter
Blade manufacturer Largest blade size
1 Abeking & Rasmussen Rotec Largest blade 40m for MBB, Aeolus II wind turbine. 2 Aerpac (recently purchased
by Enron)
Size range up to 48 m
3 Borsig Rotor 39 m blade for Nordex 2.5 MW is the next prototype. 4 LM Glasfiber Up to 38.8 m available– larger blades planned. 5 NEG Micon Aerolaminates 50 m blade about to be made and tested.
6 NOI Rotortechnick GmbH Currently working on 39 m blades with 55 m blade for a 5 MW turbine planned this year.
7 Polymarin-Bolwell Composites
Latest blades up to 37 m length.
8 TECSIS Currently supplying 34 m blades.
Table 2.1.2.1 Large rotor blades (GH Review)
The upward trend in machine diameter is well illustrated by examination of the activities of rotor blade suppliers (Table 2.1.2.1). In addition to those companies specifically manufacturing rotor blades, companies like Enercon and Vestas who manufacture their own blades are clearly interested in large offshore machines and wind turbine systems with rotors up to 120 m diameter for 5 MW rating and perhaps as high as 140 m for 6 MW rating are under consideration.
6 of 72
P = 0.0664D
2.430
200
400
600
800
1000
1200
1400
0
10
20
30
40
50
60
70
rotor diameter, D [m] rated output power P [kW]Figure 2.1.2.1 Power rating of wind turbines up to 62 m diameter
The power rating of wind turbines has typically been based on the assumption of a wind shear typical of European land based sites with a 1/7 power law applying to variation of wind speed with height above ground. This implies a rotor power variation as diameter to the power (2 + 3/7) i.e. 2.43, and it can be seen (Figure 2.1.2.1) that for a wide range of land based turbines up to 62 m rotor diameter there is an exponent of 2.4 in reasonable conformity with this.
P = 0.1215D
2.230
500
1000
1500
2000
2500
3000
0
10
20
30
40
50
60
70
80
rotor diameter, D [m]rated output power, P [kW]
Figure 2.1.2.2 Power rating of wind turbines
It is apparent, however, (Figure 2.1.2.2) with the largest offshore wind turbines included, that the exponent in the rating trend has reduced. This is logical since there is reduced wind shear on offshore sites and certainly the 80 m turbines are targeted for such sites. It is also the case that unnecessarily high towers offshore will only exacerbate the problem of larger machines having low fundamental frequencies approaching the peak in the wave spectrum.
7 of 72 0 20 40 60 80 100 120 0 10 20 30 40 50 60 70 80 90 rotor diameter [m]
blade tip speed [m/s]
Figure 2.1.2.3 Design tip speed (maximum steady state)
The tip speed of wind turbines is relatively constant (Figure 2.1.2.3) being limited on European land based sites primarily by acoustic noise. Most machines of the leading manufacturers have tip speed lower than 70 m/s although a few machines, not generally market leaders, adopt high tip speeds above 100 m/s. Apart from acoustic considerations, a higher tip speed is advantageous, implying lower torque for a given power rating and lighter and cheaper tower top systems.
Design Power [kW] Control concept Tip speed [m/s] Ratio (offshore/land)
Vestas V66 (land) 1650 Pitch reg.,
variable slip
66 Vestas V80 (offshore) 2000 Pitch reg.,
variable speed
80
1.21
Nordex N60 1300 Stall reg.,
fixed speed
60 Nordex N80 (offshore) 2000 Pitch reg.,
variable speed
80
1.33
Bonus 1300 (land) 1300 Active stall, fixed speed
62 Bonus 2000 (offshore) 2000 Active stall,
fixed speed
68
1.10
NEG Micon 1000/60 (land) 1000 Stall reg., fixed speed
57 NEG Micon 2000/72 (offshore) 2000 Active stall,
fixed speed
68
1.19
Table 2.1.2.2 Trends in tip speed comparing offshore and land based turbines The largest machines that are exclusively directed at the offshore market (Table 2.1.2.2) exploit significantly higher tip speed. Acoustic noise is probably much less of an issue for
8 of 72 machines in the 5 MW range.
Hub height
0
20
40
60
80
100
120
140
0
10
20
30
40
50
60
70
80
rotor diameter [m] hub height [m]Figure 2.1.2.4 Hub height variation of wind turbines
For land based wind turbines, hub height rises in proportion to diameter (Figure 2.1.2.4) with the caveat that, at any given diameter, there will often be a wide range of alternative tower heights available to suit the demands of specific sites. The data (Figure 2.1.2.4) shows a levelling in the increase of hub height with diameter at the largest sizes. It is suggested that for best economics, offshore wind turbines in an environment with reduced wind shear will have hub heights that are minimal for safe clearance of the blade tips from extreme waves. Safety and control
Pitch control (with independent actuators on each blade) in combination with variable speed predominates among the largest wind turbine designs. Of 16 distinct machine designs on or over 70 m diameter 14 adopt this configuration. The two exceptions are the designs of NEG Micon and Bonus which use stall regulation with dual speed operation.
Less than 10% of designs over the whole size range from 30 kW upwards are fixed speed. Many different options are exploited in order to achieve some degree of speed variation – dual speed with pole switching, high slip as with Vestas Optislip, doubly fed induction generators giving moderate range of variable speed and direct drive systems with wide range variable speed.
Over the whole size range there are still roughly equal numbers of pitch regulated and stall regulated designs but, as has been mentioned, pitch regulation dominates among the largest wind turbine designs.
9 of 72
diameter range 45-80 m (rated power, 600-2500 kW). Semi-offshore wind turbines from 1990 up to now have been in the rotor diameter range of 30-45 m (rated power 220-600 kW). Commercial offshore wind turbines, up-scaled from the onshore turbines, are today made by 10 manufacturers, in the rotor diameter size range of 65-80 m (rated power 1500-2500 kW). New offshore turbine prototypes are under design with rotor diameters up to 120 m. It remains to be seen however where the technical and economic barriers to further up-scaling exist, i.e. rotor diameters greater than 120m.
Offshore designs which exploit higher tip speeds than land based machines of similar diameter or rating should become less rather than more expensive even accounting for marinisation.
In Fig 2.1.3.1 the power ratings of onshore wind turbines, installed in Germany Ref.[2], are reported against year of installation (dots). For comparison in the same time scale, the power rating of existing turbines is shown (squares) for semi-offshore conditions up to 1998, while afterward the applications are real offshore. The much increased rating of the offshore designs is very evident.
0 500 1000 1500 2000 2500 1988 1990 1992 1994 1996 1998 2000 2002 kW Offshore Onshore Germany
Figure 2.1.3.1 Rating trends in land based and offshore wind turbines
Fig 2.1.3.2 compares current commercial offshore turbines, derived by up-scaling and marinisation of onshore ones, with new prototypes most of which are still in the design phase. A further large increase in turbine size is evident with the new offshore models.
10 of 72 0 1 2 3 4
Bonus DeWind Enercon NEG Micon NM 2000/72 Nordex Tacke TW 2.0 Vestas Aerodyn Multibrid MW Commercial turbines Prototypes (design)
Figure 2.1.3.2 Commercial offshore turbines and forthcoming prototypes Figure 2.1.3.3 shows substantial technology progress in reducing blade weight and cost. This inference comes from the trend line exponent being 2.3 rather than 3 as would apply from simple scaling rules relating design bending moment and structural material demands to rotor diameter. Higher tip speed of offshore turbines will result in relatively lighter rotors.
y = 0.2699x2.3448 0 1,000 2,000 3,000 4,000 5,000 6,000 7,000 8,000 0 10 20 30 40 50 60 70 80 rotor diame te r D, [m] blade w e ight [kg]
Figure 2.1.3.3 Blade mass related to rotor diameter
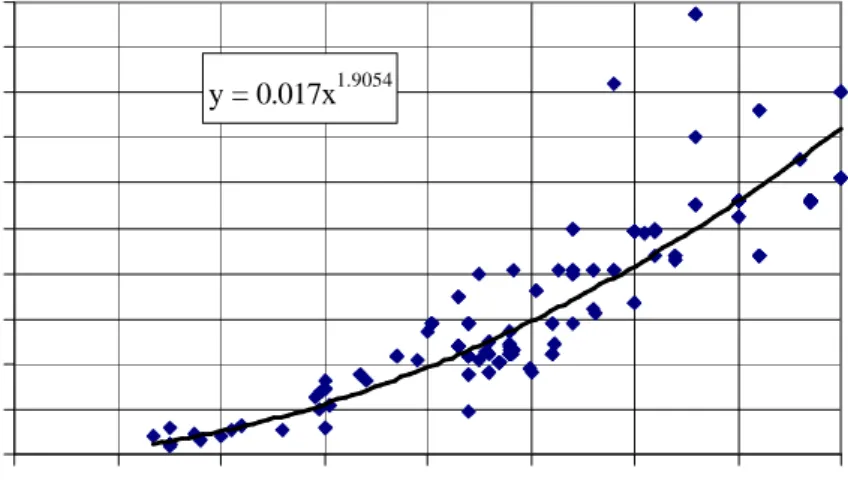
In Figure 2.1.3.4, the nacelle mass appears to increase as about square of diameter rather than diameter cubed as might be expected from a torque related component. This again reflects substantial ongoing technology progress and the trends already mentioned towards higher tip speed for the largest offshore wind turbines. It should however be noted that the data of Figure 2.1.3.4 includes both direct drive and gearbox based drive trains. Extrapolation of nacelle mass to large scale offshore wind turbines should treated with some caution.
11 of 72 y = 0.017x1.9054 0 10 20 30 40 50 60 70 80 90 100 0 10 20 30 40 50 60 70 80 rotor diameter, D [m] nac e ll e w e ight [tonn es]
Figure 2.1.3.4 Nacelle mass v rotor diameter
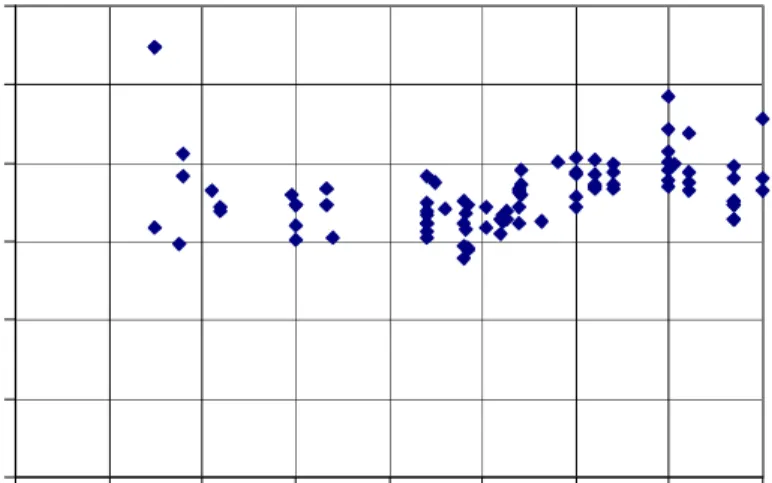
In Fig 2.1.3.5, the ratio of blade mass to swept area is only slowly increasing whereas a linear increase would be expected from a mass or volume to area ratio. This is essentially an alternative presentation of the trend in Figure 2.1.3.3. The results depend on the blade number (almost always 3) and material used, generally glass composite. Lower specific rotor weights are expected from carbon fibre blades (especially in the context of increased tip speed of offshore machines) and two bladed turbines. The dispersion of data about the best-fit value is considerable but decreasing for the large size turbines, where design is better optimised.
y = 0.3192x0.3634 0.0 0.5 1.0 1.5 2.0 2.5 3.0 0 10 20 30 40 50 60 70 80 rotor diameter, D [m] blad e w e ight/swept ar e a (kg/m 2 )
Figure 2.1.3.5 Rotor mass/ swept area ratio
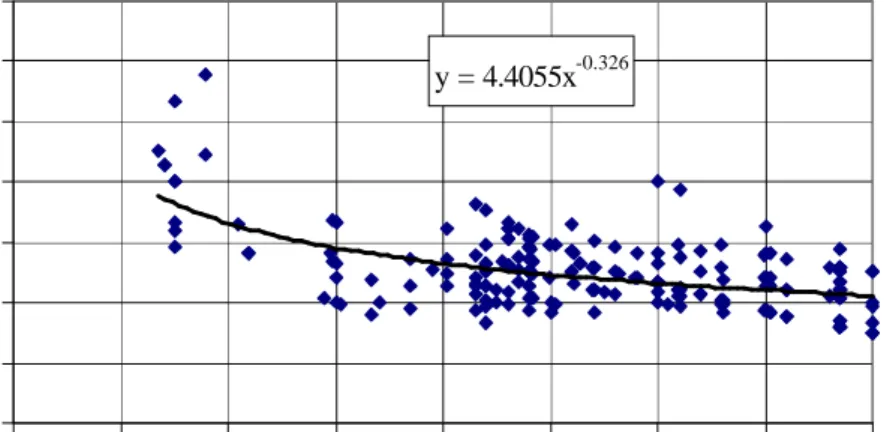
In Fig 2.1.3.6, the hub height to rotor diameter ratio, for onshore turbines, is constant (about 1) above 40 m rotor diameter. With reduced wind shear offshore, the ratio may even
12 of 72 y = 4.4055x-0.326 0.0 0.5 1.0 1.5 2.0 2.5 3.0 3.5 0 10 20 30 40 50 60 70 80 rotor diame te r D, [m] hub h e ight/rotor diameter
Figure 2.1.3.6 Hub height/rotor diameter ratio
2.1.4 Large wind turbine cost trends
Fig 2.1.4.1 from ENEA Ref.. [4] is shows the breakdown of capital cost of a typical offshore wind farm. In terms of CAPEX alone, turbines are about 40 – 45% of cost, much less than about 70% which is typical for land based projects, but clearly still a major item. Taking into consideration O&M costs, turbine costs are about 65% of total lifetime costs onshore and are expected to be about 30% offshore (Opti-OWECS reference).
Turbines 45% Support structure 25% Power transmission 8% Installation 7% Project Management 2% Power collection 13%
13 of 72 0 100 200 300 400 500 0 10 20 30 40 50 60 70 80 rotor diameter, D [m] euro/m 2
Figure 2.1.4.2 Cost per unit swept area v diameter
Figure 2.1.4.2 reveals a rising trend of medium and large size (30 – 70 m diameter) land based machines in cost/m2 with increasing rotor diameter. This may not be immediately obvious, but the key is to discount the data above 75 m diameter which applies to the offshore designs with increased tip speed. It is expected that the offshore machines (at a given tip speed) will display the same rising cost trend but on separate curves (ref. EWEC NICE 1999) related to design tip speed. Much of the vertical dispersion in Figure 2.1.4.2 and many other cost curves is due to the same turbines being offered with different tower heights. Normalisation to take account of tower height and tower cost could considerably reduce the apparent scatter.
0 100 200 300 400 500 600 0 500 1000 1500 2000 2500 rate d powe r [kW] e uro/m 2
14 of 72
The same type of trend is apparent (Figure 2.1.4.3) in relation to rated power.
0 500 1000 1500 2000 2500 0 500 1000 1500 2000 2500 rated powe r [kW] e uro/kW
Figure 2.1.4.4 Cost per kW v rated power
The appearance of reduced costs of the largest offshore machines is even more striking in Figure 2.1.4.4. The costs are based on list prices published in the same year (Windkraftanlagen 2001 and Windenergie 2001) and the 2 and 2.5 MW machines come out very well in terms of cost per kW because of the higher tip speeds (Table 2.1.2.2) and especially the higher ratio of rating to rotor diameter.
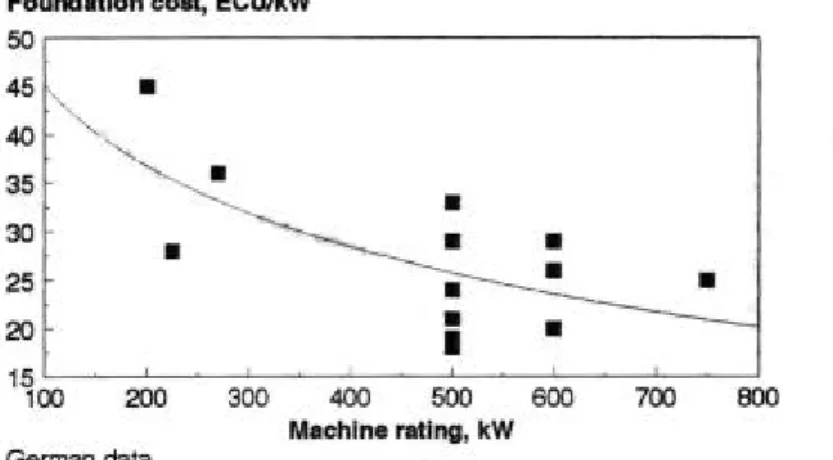
For onshore turbines the specific cost of foundation (ECU/kW) is decreasing with power rating as form Fig 2.1.4.5 of ENEA Ref.[3]. A similar trend is expected in offshore projects especially when it is argued that a driver for having much larger unit turbines offshore is to have cost efficient foundations.
15 of 72
clearly that much improved reliability is demanded if reduced accessibility is not to impact strongly on availability. Current operational experience and offshore O&M is discussed in detail in Section 6. O&M demands will impact considerably on costs of offshore wind turbine systems and affect optimum scale for minimum cost of energy.
Figure 2.1.4.6: Availability vs. improved reliability
2.1.5 Summary of trends in offshore wind technology
Summarising the evaluations of size and cost trends;
• By turbine designers choice and reflecting wind shear conditions, rated power is generally scaling as D2.4 on land and a bit closer to D2 offshore. With lower wind shear offshore, specific power (W/m2) is increasing up to around 500 W/m2. It should be noted, however, that the choice of specific power (or rated wind speed) is also driven by the site annual mean wind speed, the breakdown of cost of energy and the predictability of power production in the future spot market.
• Under conditions of true similarity in design style, state of technological progress and design specification, it remains that costs of large turbines are expected to scale cubically with rotor diameter
• Considering historical data over the range of machine sizes, the cubic scaling law regarding system masses and costs appears closer to a square law with ongoing technology development
• The trends in published price data of machine for land based projects shows a gently rising cost/kW for rotor diameters of 40 m and greater. (This does not conflict with the circumstance, that after consideration of balance of plant and maintenance costs, the best overall project economics on land may come from utilisation of MW scale turbines)
16 of 72
• Rotor diameter and power rating is increasing. Commercial turbines are available in the diameter range 65 - 80 m and 1.5 - 2.5 MW. Prototypes are under development with respective values up to 120 m and up to 5 MW.
• The turbine cost is around 45% of initial capital cost of an offshore wind farm and, as a proportion of cost, is likely to be less on demanding sites with challenging wave climates.
• The increase of offshore turbine size is primarily driven by foundations and power collection costs. Very large unit size does not favour the inherent economics (cost/kW or cost per kWh ex factory) of the wind turbine in isolation.
• Reliability in parallel with accessibility are priority concerns for satisfactory economics of offshore wind turbines.
2.2 Manufacturers
2.2.1 General data sources on manufacturers
A list of most wind turbine manufacturers with contact details including web site references is available from Windkraftanlagen 2001 and Windenergie 2001. Salient data on all commercial wind turbines above 52 m diameter, which are considered to be large enough for offshore use and some of which are specifically offshore designs, is presented in Table 2.2.1.1
17 of 70
Table 2.2.1.1 Wind turbines above 52 m diameter
TYPE RATED HUB SWEPT DIA. SPEED TOWER
WT
NACELLE MASS
BLADE WT
EURO/ EURO/ PRICE
POWER kW
HEIGHT m AREA m2 M rpm kg kg kg kW m2 EURO
Nordex N-80 2500 60 5026 80 19 80,000 736.3 366.2 1,840,651 Nordex N-80 2500 80 5026 80 19 179,000 80,000 766.9 381.5 1,917,345 Nordex N-80 2500 100 5026 80 19 80,000 920.3 457.8 2,300,813 AN Bonus 2 MW/76 2000 80 4,536 76 17 162,000 65,000 AN Bonus 2 MW/76 2000 98 4,536 76 17 162,000 65,000 NEG Micon NM 2000/72 2000 64 4072 72 18 113,000 76,000 6,800 889.6 437 1,779,296 NEG Micon NM 2000/72 2000 80 4072 72 18 130,000 76,000 6,800 Vestas V80/2.0 MW 2,000 60 5,027 80 19 110,000 61,200 12,000 Vestas V80/2.0 MW 2,000 67 5,027 80 19 130,000 61,200 12,000 Vestas V80/2.0 MW 2,000 78 5,027 80 19 170,000 61,200 12,000 Vestas V80/2.0 MW 2,000 100 5,027 80 19 200,000 61,200 12,000 Enercon E-66/18.70 1800 65 3848 70 22 122,000 101,000 4,200 886.2 414.6 1,595,231 Enercon E-66/18.70 1800 85 3848 70 22 191,000 101,000 4,200 950.2 444.5 1,710,271 Enercon E-66/18.70 1800 98 3848 70 22 101,000 4,200 1036.8 485 1,866,215 Vestas V66/1.65 MW 1,650 60 3,421 66 19 87,000 55,000 4,000 Vestas V66/1.65 MW 1,650 67 3,421 66 19 102,000 55,000 4,000 Vestas V66/1.65 MW 1,650 78 3,421 66 19 141,000 55,000 4,000 BWU/Jacobs MD 70 1,500 65 3,850 70 19 56,000 5,400 BWU/Jacobs MD 70 1,500 80 3,850 70 19 56,000 5,400 BWU/Jacobs MD 70 1,500 85 3,850 70 19 56,000 5,400 BWU/Jacobs MD 77 1,500 61.5 4,656 77 17 56,000 5,400 BWU/Jacobs MD 77 1,500 85 4,656 77 17 56,000 5,400 BWU/Jacobs MD 77 1,500 90 4,656 77 17 56,000 5,400 BWU/Jacobs MD 77 1,500 100 4,656 77 17 56,000 5,400 Enercon E-66/15.66 1500 67 3421 66 22 130,000 97,400 3,900 Enercon E-66/15.66 1500 85 3421 66 22 191,000 97,400 3,900 Enercon E-66/15.66 1500 98 3421 66 22 97,400 3,900
18 of 70
TYPE RATED HUB SWEPT DIA. SPEED TOWER
WT
NACELLE MASS
BLADE WT
EURO/ EURO/ PRICE
POWER kW
HEIGHT m AREA m2 M rpm kg kg kg kW m2 EURO
Enron EW 1.5s 1500 64.7 3904 70.5 20 Enron EW 1.5s 1500 80 3904 70.5 20 Enron EW 1.5s 1500 85 3904 70.5 20 Enron EW 1.5s 1500 100 3904 70.5 20 Enron EW 1.5sl 1500 61.4 4657 77 18.3 Enron EW 1.5sl 1500 80 4657 77 18.3 Enron EW 1.5sl 1500 85 4657 77 18.3 Enron EW 1.5sl 1500 100 4657 77 18.3 Enron Wind 1.5 sl 1,500 61.4 4,657 77 18 1090.8 351.3 1,636,134 Fuhrlander MD 77 1,500 65 4,655 77 17.3 93,000 55,500 5,000 1022.6 329.5 1,533,876 Fuhrlander MD 77 1,500 85 4,655 77 17.3 55,500 5,000 1073.7 346 1,610,569 Fuhrlander MD 70 1,500 65 3,850 70 19 93,000 52,500 5,000 947.6 369.2 1,421,391 Fuhrlander MD 70 1,500 85 3,850 70 19 52,500 5,000 1005.5 391.8 1,508,311 NEG Micon NM 1500/72 1500 98 4,072 72 17.3 89,000 44,000 6,800 1056.7 389.2 1,585,005 NEG Micon NM 1500/72 1500 64 4,072 72 17.3 132,000 44,000 6,800 988.5 364.1 1,482,746 NEG Micon NM 1500/72 1500 80 4,072 72 17.3 201,000 44,000 6,800 1022.6 376.7 1,533,876 NEG Micon NM 1500C-64 1500 68 3217 64 17.3 113,000 43,000 6,000 801 373.5 1,201,536 NEG Micon NM 1500C-64 1500 80 3217 64 17.3 148,000 43,000 6,000 835.1 389.4 1,252,665 PWE 1566 (Pfleiderer) 1,500 65 3,421 66 22 220,000 70,000 3,900 Sudwind S-70 1,500 65 3,848 70 19 95,000 56,000 6,020 971.5 378.7 1,457,182 Sudwind S-70 1,500 85 3,848 70 19 56,000 6,020 1027.7 400.6 1,541,545 Sudwind S-70 1,500 98.5 3,848 70 19 56,000 6,020 Sudwind S-70 1,500 114.5 3,848 70 19 56,000 6,020 Sudwind S-77 = MD77 1,500 61.5 4,657 77 17.3 80,000 56,000 6,020 1022.6 329.4 1,533,876 Sudwind S-77 = MD77 1,500 85 4,657 77 17.3 56,000 6,020 1078.8 347.5 1,618,239 Sudwind S-77 = MD77 1,500 90 4,657 77 17.3 56,000 6,020 Sudwind S-77 = MD77 1,500 96.5 4,657 77 17.3 56,000 6,020 1094.2 352.4 1,641,247 Sudwind S-77 = MD77 1,500 100 4,657 77 17.3 56,000 6,020 1227.1 395.2 1,840,651 Sudwind S-77 = MD77 1,500 111.5 4,657 77 17.3 56,000 6,020 1182.8 381 1,774,183 Made AE-61 1,320 60 2,922.50 61 18.8 89,500 49,000 AN Bonus 1.3 MW/62 1300 68 3019 62 19 80,000 50,000 896.7 386.1 1,165,745
19 of 70
TYPE RATED HUB SWEPT DIA. SPEED TOWER
WT
NACELLE MASS
BLADE WT
EURO/ EURO/ PRICE
POWER kW
HEIGHT m AREA m2 M rpm kg kg kg kW m2 EURO
Nordex N-60 1300 60 2828 60 19 49,200 4,800 Nordex N-60 1300 65 2828 60 19 49,200 4,800 Nordex N-60 1300 69 2828 60 19 98,400 49,200 4,800 837.7 385.1 1,089,052 Nordex N-60 1300 70 2828 60 19 845.6 388.7 1,099,278 Nordex N-60 1300 85 2828 60 19 154,000 49,200 4,800 884.9 406.8 1,150,407 Nordex N-60 1300 120 2828 60 19 49,200 4,800 Nordex N-62 1300 60 3020 62 19 49,200 4,800 Nordex N-62 1300 65 3020 62 19 49,200 4,800 Nordex N-62 1300 69 3020 62 19 98,400 49,200 4,800 853.5 367.4 1,109,503 Nordex N-62 1300 70 3020 62 19 Nordex N-62 1300 85 3020 62 19 154,000 49,200 4,800 Nordex N-62 1300 120 3020 62 19 49,200 4,800 DeWind D6 1250 68 3217 64 24.8 72,000 44,000 944.8 367.1 1,181,000 DeWind D6 1250 91.5 3217 64 24.8 116,000 44,000 1026.4 398.8 1,283,000 DeWind D6 1250 65 3019 62 26.1 72,000 44,000 900 372.6 1,125,000 AN Bonus 1 MW 54 1000 50 2300 54.1 22 54,000 40,000 4,650 828.3 360.1 828,293 AN Bonus 1 MW 54 1000 60 2300 54.1 22 60,000 40,000 4,650 859 373.5 858,970 AN Bonus 1 MW 54 1000 70 2300 54.1 22 90,000 40,000 4,650 899.9 391.2 899,874 DeWind D6 1000 68.5 3019 62 25.2 4,100 1120 371 1,120,000 DeWind D6 1000 91.5 3019 62 25.2 4,100 1222 404.8 1,222,000 Enercon E-58 1000 70 2642 58 24 130,000 82,000 3,400 1060.9 401.6 1,060,931 Fuhrlander 200/1000 1000 70 2180 52.7 22 741.4 340.1 741,373 Fuhrlander FL 1000 1,000 70 2642 58 22 95,000 40,500 4,500 Fuhrlander FL 1000 1,000 82 2642 58 22 120,000 40,500 4,500 Fuhrlander FL 1000 1,000 70 2463 56 22 95,000 40,500 4,500 Fuhrlander FL 1000 1,000 82 2463 56 22 120,000 40,500 4,500 Fuhrlander FL 1000 1,000 70 2290 54 22 95,000 40,500 4,500 741.4 323.7 741,373 Fuhrlander FL 1000 1,000 82 2290 54 22 120,000 40,500 4,500 833.4 363.9 833,406 MWT 1000 (Mitsubishi) 1,000 60 2,463 56 21 63,000 32,000 4,100 NEG Micon NM 1000/60 1000 70 2827 60 18 114,000 33,500 5,000 971.5 343.6 971,455 NEG Micon NM 1000/60 1000 80 2827 60 18 114,000 33,500 5,000 1007.2 356.3 1,007,245
20 of 70
TYPE RATED HUB SWEPT DIA. SPEED TOWER
WT
NACELLE MASS
BLADE WT
EURO/ EURO/ PRICE
POWER kW
HEIGHT m AREA m2 M rpm kg kg kg kW m2 EURO
Nordex N-54 1000 60 2290 54 22 90,200 50,000 4,200 833.4 363.9 833,406 Nordex N-54 1000 70 2290 54 22 105,000 50,000 4,200 843.6 368.4 843,632 Nordic 1000 1,000 60 2,290 54 25 45,000 29,000 3,600 787.4 343.8 787,389 Enron Wind 900s 900 60 2,206 55 28 NEG Micon NM 900/52 900 60 2,140 52.2 22 72,000 24,500 4,200 772.6 324.9 695,357 NEG Micon NM 900/52 900 74 2,140 52.2 22 97,000 24,500 4,200 795.3 334.5 715,809 Frisia F 56/850 kW 850 70 2489 56.3 25 74,000 31,000 4,500 956.4 326.6 812,954 Fuhrlander FL 800 800 70 2,180 52.7 22 88,000 40,500 4,500 894.8 328.4 715,809
21 of 70
2.2.2 Geographical regions
Some information relating to wind turbine and component manufacturers in southern European countries is given below.
Italy
There is blade manufacture and Vestas turbine assembly by IWT, Taranto Spain
Table 2.2.2.1, based on Wind Power Monthly, July 2000, indicates the status of the leading Spanish turbine manufacturers/developers.
Manufacturer Installed capacity (MW) Gamesa 1520.9 MADE 426.0 Ecotécnia 285.1 Desarrollos Eólicos 131.9 TOTAL 2363.9
Table 2.2.2.1 Spanish wind turbine manufacturers Greece
Information on Greek manufacturers actively working in wind turbine manufacture as supplied by CRES is given below:
Manufacturer
PYRKAL SA (? ? ? ? ? ? AE) Wind turbine manufacturer (up to 1-1.5 MW) GEOBIOLOGIKI SA
(G? O? ?? ? ? G?? ? AE)
Wind turbine blade manufacturer (up to 19 m, up to 30 m under development)
www.angelopoulos.gr
M.+G. TSIRIKOS SA (? +G ? S?? ?? ? S ? ? ? ? )
Wind turbine gearing manufacturer METAL INDUSTRY OF
ARKADIA – C. ROKAS SA (? ? ? ? ? ? ? ? ?? ? ? ? ? ? ?? ? ? ? ? ? ?? S, X.? ? ? ? S ABEE)
Wind turbine tower manufacturer & electrical systems
www.rokasgroup.gr
V?? ? ? ? SA (BIOMEK AE) Wind turbine tower manufacturer METKA SA (? ? ? ? ? AE) Wind turbine tower manufacturer
www.metka.gr
VIEX SA (BIE? ? ? ) Wind turbine tower manufacturer Table 2.2.2.2 Greek manufacturers
22 of 70
2.2.3 Summary of blade manufacturers
Table 2.2.3.1 summarises the main players in the wind turbine blade manufacturing industry. Blade
manufacturer
Capacity Technology Comment
1. Abeking & Rasmussen Rotec
Largest blade 40m for MBB, Aeolus II wind turbine.
Glass epoxy and glass polyester
Best established of the German manufacturers having mainly supplied German wind turbine manufacturers.
2. Aerpac Over 8000 blades supplied, 620 from their new Scottish factory since 1997. Size range 7 m to 48 m
Employing resin infusion system for glass epoxy blades.
Major blade manufacturer, second to LM in market share. Recently taken over by Enron.
3. ATV All carbon blades up to 14 m length. Hybrid blades using carbon reinforcement up to 32 m length. Carbon and hybrid epoxy. The only company making one piece all-carbon blades.
Recovering their market position after significant technology problems in production of medium-sized blades for Tacke Windtechnik. Now owned by Caterpillar. 4. Borsig Rotor A new company
founded end 1999. 31 m prototype blade manufactured (March 2000) 850 blades anticipated production in 2001. 39 m blade for Nordex 2.5 MW is the next prototype.
Glass epoxy. Manufacturing plant in Rostock. Technical input is from Walter Keller who had founded Aero Construct which later became LM Aero Construct. Supplier for Nordex and Südwind.
5. Enercon Large number of blades for their E40 and E66 turbines especially.
Glass epoxy. Manufacturing blades exclusively for their own projects. Have also sourced blades in quantity from Aerpac.
6. Euros 24.5 m (Sept. 1999) and 27.5 m (March 2000) blades load tested. Blades first in operation (June 2000)
Glass epoxy Aerodyn designs. Euros started in 1997 supplying blades for machines in 600 kW – 1.5 MW range.
7. LM Glasfiber Around 36,000 blades supplied. LM claim a 49% world market share. Blade supply from 11 m to 38.8 m. Blade manufacture on 12 sites world wide.
Glass polyester. Carbon tubes in tip brakes and carbon
reinforcement in largest blades.
Long established as the world’s leading supplier of wind turbine blades. Have always been more diverse than rotor blades. Leading supplier of lightweight composite parts for the European rail industry. 8. MFG They claim to be the
leading US producer of large rotor blades over 20 m.
Glass epoxy. Manufacturing blades primarily for Enron Wind Corporation.
23 of 70 Blade
manufacturer
Capacity Technology Comment
9 NEG Micon Aerolaminates Over 1000 large blades manufactured. 15 m to 31 m. 50 m blade about to be made and tested.
Wood epoxy – the only major supplier of wooden blades.
Principally supplying NEG Micon. Recent major expansion of manufacturing capability. Set up on the Isle of Wight with direct shipping facilities. 10 NOI Rotortechnick GmbH Currently working on 39 m blades with 55 m blade for a 5 MW turbine planned this year.
Glass epoxy Aerodyn designs. Founded in 1999, first blade produced October 1999.
11 Polymarin BV Around 2000 blades supplied. Blade lengths up to about 26 m.. Glass epoxy primarily and carbon epoxy to a limited extent Started in 1982. 12 Polymarin-Bolwell Composites
Over 800 blades for 600 and 750 kW wind turbines. Latest blades up to 37 m length.
Glass epoxy. Canadian offshoot of
Polymarin now 50% owned by Australian Bolwell
Corporation. Set up in 1995 to supply large blades to US market.
13 TECSIS 70% export production to US and Europe. Hundreds of 25 m blades supplied. Currently supplying larger blades (34 m) for EWC projects in US.
Glass epoxy construction.
Brazilian manufacturer. Their main market is in the US for Enron Wind Corporation. Have also supplied Enercon.
14 Vestas Wind Systems
Thousands of blades produced for own turbines. World market leader in wind turbine supply.
Glass epoxy, spar/shell construction using prepregs.
Well established in-house blade manufacturing technology producing low mass flexible blades.
Table 2.2.3.1 Summary of wind turbine blade manufacturers (continued)
2.2.4 Current status of blade technology
There are a variety of design styles and manufacturing processes that are successfully in competition and no clear suggestion that a particular route of design or manufacture is definitely superior. Polyester resin is cheaper but inferior in preservation of final dimensional quality of a product and inferior in strength to epoxy resin. There has been a general move towards epoxy. New entrant blade manufacturers are using epoxy and Aerpac had switched to epoxy some years ago.
Large blades are requiring higher specific strength materials. This has undoubtedly driven the increasing use of epoxy resin and is also driving the widespread use of carbon reinforcements in large blades. The demand for high strength blades of low solidity in conjunction with
24 of 70
diminishing carbon fibre costs may drive the industry in the direction of carbon epoxy. Carbon prices are falling and if it were used in significant quantities in blades for offshore machines, that could become by far the largest outlet for high quality carbon fibres and prepregs. This could then drive further cost reduction.
Wood composite blade manufacture is now a proven technology. Wood epoxy has good low temperature characteristics and is a cost effective blade material system. Wood may be more limited than other higher strength composites for very large blades. Wood is definitely unsuitable for very flexible blades. The spar and shell design, both manufactured using prepregs, is particularly favoured by Vestas. It has advantages in realising fast production with good quality control and suits manufacture of lightweight, flexible blades. These advantages are offset by a premium in the material components.
There are a number of interesting developments but no sign of any radical development in blade technology that would sideline present manufacturing technologies.
2.3 Offshore Prototypes
Nordex, Vestas and Enercon are known to be investigating designs in the 5 MW, >100 m rotor diameter range, and Aerodyn and NEG Micon are involved in a 6 MW design. (NEG Micon expect to install a 3MW prototype in 2002). Parallel activities of the blade manufactures in development and testing of blades for rotor diameters above 90 m is noted in Table 2.2.3.1.
The ScanWind 3.5 MW, 90 m rotor diameter design utilising the ABB Windformer concept has been much publicised and a 500 kW system (generator only) has been laboratory tested. A 3 MW Windformer system is planned for Nasudden III (land based but coastal site) and it is expected that these developments will prepare the technology for offshore applications.
2.3.1 Offshore projects
A total of 8 offshore projects are currently operational worldwide: the early projects were relatively small scale and shallow or sheltered waters. Not until Blyth Offshore came online, exposed as it is to the full force of the North Sea, could any be described as truly offshore.
Location Country Online MW No Rating
Vindeby Denmark 1991 4.95 11 Bonus 450 kW
Lely (Ijsselmeer) Holland 1994 2.0 4 NedWind 500 kW
Tunø Knob Denmark 1995 5.0 10 Vestas 500 kW
Dronten (Ijsselmeer) Holland 1996 11.4 19 Nordtank 600 kW Gotland (Bockstigen) Sweden 1997 2.75 5 Wind World 550 kW
Blyth Offshore UK 2000 3.8 2 Vestas 2 MW
Middelgrunden, Copenhagen Denmark 2001 40 20 2 MW
Utgrunden, Kalmar Sound Sweden 2001 10.5 7 Enron 1.5 MW Totals 80.4 78
Table 2.3.1.1 Offshore Projects
Ireland, Belgium, Germany and the Netherlands are also expressing serious intent in developing their offshore resource. Proposed projects include:
25 of 70
• Mouth of the Western Scheldt River, Holland, 100 MW • Ijmuiden, Holland, 100 MW
• Horns Rev, Denmark, 150 MW • Laeso, Denmark, 150 MW
• Omo Stalgrunde, Denmark, 150 MW • Gedser Rev, Denmark, 15 MW • Rodsand, Denmark, 600 MW • Lillgrund Bank, Sweden, 48 MW • Barsebank, Sweden, 750 MW • Kish Bank, Ireland 250 MW+
• Arklow, off County Wicklow, Ireland 200 MW+
Utilising megawatt-plus class machines, these projects will generate higher volumes of electricity from the more constant wind regimes experienced at sea and are likely to play a major role in power generation in the future.
26 of 70
As of April 5th 2001, according to a press release of the Crown Estate, 18 wind farm developers have successfully pre-qualified to obtain a lease of seabed in UK waters for the development of offshore wind farms. The net capacity of the sites in consideration is between 1000 and 1500 MW.
The EWEA have estimated that 5 GW of the 60 GW predicted for 2010 will be coming from the offshore sector.
The above data is taken from www.offshorewindfarms.co.uk
2.4 Gearboxes in the Offshore Context
The majority of turbines currently supplied to the onshore market use a gearbox to increase the rotor speed to a speed compatible with the generator, ~1000 or 1500 rpm. Almost all gearboxes, regardless of power rating, tend to conform to a standard pattern for turbines up to the current maximum size of ~2MW. The gearboxes are three stage units, the first, input, stage is planetary and the two higher speed stages are parallel with helical gears.
It is not clear whether this current gearbox concept will be applicable for larger, offshore turbines. Gearbox design is generally determined by input torque and the required speed increase ratio. As power and, hence, rotor diameter increase the torque and ratio increase. In an offshore turbine the increases are offset to some degree by a relatively higher rotor speed compared to a land based machine. However, it is likely that for larger machines > 3MW an additional gearbox stage will be required. Therefore, the complexity of the gearbox may be increased beyond that currently being used or designs based on a lower generator speed (rpm) may be used to compensate for this effect.
Throughout the development of the modern wind turbine there have been periods when the frequency of failure of gearbox components has been above normal, acceptable levels. The gearbox is one of the more costly components and there is always a large incentive to reduce costs. As wind turbine technology has developed the loading calculations used to select gearboxes and other component have been refined. These factors mean that over time, the safety margins of gearboxes have reduced. This appears to result in a cycle of events. A period of stability is followed by an increased level of failures. The wind turbine and gearbox industries react to the failures, increase margins and a further period of stability ensues. Gearboxes for use in offshore environments may be more complex. The increased complexity may lead to increased probability of failure. There are only a small number of failure modes that can be rectified in situ. Therefore, to repair a failed gearbox will entail the removal of the unit from the turbine with significant cost and time implications.
The above issues suggest that there is a reasonable possibility that direct drive technologies may prove more attractive than they currently appear to be in the onshore market.
These comments are based on GH engineers' experience in due diligence and are not attributable to any specific published source.
2.5 Future Trends
As has been discussed, there is direct evidence of the following trends; 1) tip speed increases, 2) up to 33%, more use of carbon in blades, at least as reinforcement if not yet as a complete
27 of 70
base material system, and 3) the appearance of more direct drive systems in new wind turbine designs, especially ScanWind as a large scale system targeted for offshore.
All these developments are logical from a technical/cost standpoint.
• Higher tip speeds gives lower torque and less mass and cost of tower top systems. • Carbon blades or more carbon in blades – very large blades demand higher specific
strength materials.
• Direct drive with permanent magnet generator (PMG) – direct drive does not have a cost or weight advantage over conventional geared systems but especially in the PMG type of design, it constitutes a simpler power train than the gearbox/high-speed generator combination and may be more reliable.
Floating wind energy systems have major potential benefit in allowing utilisation of windy areas near population and electrical demand centres where there are no shallow sea water sites. A study (FLOAT) identified such sites off the east coast of Ireland and in the Aegean. At present, costs of moorings and of the floating platform (with the need for some lengths of flexible transmission lines) would appear to be much greater than the cost of fixed sea bed foundations in shallow water. However, technical progress in these areas plus new system concepts including, for example, integration with an appropriate type of wave device may bring floating systems nearer to economic feasibility.
Other ideas which may warrant future work are multiple rotors fixed on a single pile.
2.6 Bibliography
2.6.1 R&D plans/needs
Offshore Wind Energy Network. OWEN (Research Requirements Workshop, Final Report of G.Watson RAL April 1999).
Papers from journals and conferences:
(a) Wind Engineering 1989 vol. 13, n.8 (“Cost modelling of HAW Turbines” F. Harrison page 315)
(b) WEGA 1 : Hau,J. Langenbrinck, .Palz-Springer Verlag 1993
(c) European Wind Energy Conference 1994 in Thessaloniki (Economic Optim. of HAWT Design Parameters of Collecut-Univ Ukland , page 1244; Tecnic.and Economic Develop.of W.E.in Germany of Molly, DEWI page. 1251)
(d) OWEMES 94 Conference Rome – (Cost of offshore wind energy in UK North Sea, Simpson-WEG, page 267)
(e) European Wind Energy Conference 1996 in Goteborg ("Wega II Large wind turbine Scient. Evaluation Project" Christiansen Elsam page 212)
(f) WEGA2, EUR 16902 EN-1996
(g) OWEMES 97 La Maddalena (“Opti-OWECS preliminary cost model” of Cockerill/Harrison-Univ. of Sunderland; "Structural and economic optim. Of OWEC" of Kuen pag 165)
(h) OWEE website (Opti-OWECS Final Report Vl.0 .August 1998 of Kuehn et Al.-TUD) (i) EWEC 1999 in Nizza (“Struct. and economic Optim of Bottom mounted OWECS” of
Kuehn TUD page 22; “Techn.Develop. for Offshore” of Jamieson GH&P page 289; “Experience with 3000 MW w.Power in Germany” of Durstewitz et Al. ISET page 551)
28 of 70
(j) Wind Engineering vol. 24, n.2,2000 (“Wind Energy Technology: status review” of D. Milborrow page 65)
(k) Technology Development For Offshore, P. Jamieson & D C Quarton. EWEC 99, Nice, March 1999
2.7 References
2.7.1 ENEA
1. World turbine Market 1999:Types-Technical Characteristics-Prices
2. D. Milborrow. Wind energy technology, status review, wind engineering Vol. 24, n°2 2000.
3. European Commission, A plan for action in Europe - Wind Energy –The Facts, 1999 4. M. Kuehn et Al. Opti-Owecs, final report Vol. 0.
5. WEGA Large Wind Turbine, EUR 16902,1996
2.7.2 GH
1. Windkraftanlagen Markt 2001, SunMedia GmbH.
2. Windenergie 2001, Bundesverband WindEnergie Service GmbH
3. P. Jamieson, Common fallacies in wind turbine design, BWEA Proceedings 1997, pages 81-86.
29 of 70
3 SUPPORT STRUCTURE
3.1 Design Development – Piled Foundations 3.1.1 Operational experience
Piled foundations have been used throughout the world for supporting offshore oil and gas platforms and there exist well-established recommended practices and guidelines for the design of piles and grouted connections:
API RP2A, American Petroleum Institute, Recommended Practices for Planning Designing and Constructing Fixed Offshore Platforms
NORSOK N004 Design of Steel Structures.
Fixed offshore oil and gas platforms are generally supported by 3 or 4 legs with either a single pile driven through the leg or one or more skirt piles arranged around each leg, the piles connected to the leg by means of grouted sleeves. The piles are hollow steel tubulars ranging in diameter from 914mm to 2743mm.
In benign, shallow waters, a single pile has been used to support the topsides and as a conductor for drilling the well. In some cases, the conductor itself has been used to support the topsides. Conductors diameters are between 508mm and 914 and are normally either driven or drilled and cemented.
Nearshore marine construction of jetties and mooring dolphins has often used piles of greater diameter than those used offshore, but the depth of penetration and the means of installation have been different.
OWEC’s have been supported on single monopiles, effectively a downwards extension of the tower and generally using methods developed from marine construction. They have ranged in diameter from 2.1 m at Bockstigen (Gotland) to 3.7m at Lely and have been installed by driving or by drilling and cementing (rock socket).
Large diameter tubular piles are a well-established design as indicated above. However, unlike an oil platform, the foundation supporting an OWEC is subjected to a much larger proportion of live load compared to dead load. This means that the foundation experiences larger shears and bending moments and relatively small axial compression. The design of monopile foundations should consider cyclic loading of near-surface soils and the potential for loss of soil contact at the surface (post-holing). Rock-socketed piles are unlikely to be susceptible to this effect.
3.1.2 Piling techniques
There are four main means of installing piles:
• Above-surface steam, hydraulic or vibration hammers • Underwater hydraulic hammers
• Drill-drive • Drill and grout
Pile driving is a faster and less weather sensitive means of installing piles than drilling and normally results in greater pile capacity than a drilled pile. There are however several disadvantages compared with drilling and grouting:
30 of 70
• The act of driving will sometimes damage the pile head and the pile may not be driven truly vertical. In order to connect the tower, this could entail cutting the head level and true and prepping it for either welding on of a flange or direct welding of the tower. This problem was overcome at Utgrunden by using a sleeve, incorporating the tower
connection flange, that slid over the pile and could be adjusted to grade and level. Once in position, the annulus between sleeve and pile was grouted.
• During pile driving, accelerations both lateral and vertical of up to 50g will be observed. Any attachments to the pile will need to be designed for this or retrofitted. This would include access ladders and walkways, anodes, J-tubes etc.
Drill-drive would be slower than simply driving and would suffer all the disadvantages of driving. It is generally only used to assist driven piles in reaching target penetration in hard soils.
Drill and grout has been successfully used for some monopile foundations and is the only method if penetration of rock is required. The benefits of drill and grout are:
• More controlled placement of the pile without damage and to a tight tolerance is possible. This permits bolting on of the tower without top of pile preparation and eliminates the need to retrofit ladders, boat landings etc..
3.2 Design Development – Gravity Foundations 3.2.1 Operational experience
Gravity foundations or gravity base structures (GBS) have been used extensively in the Norwegian sector of the North Sea, mainly in deep water, for example Troll and Sleipner. The UK sector has also used gravity foundations in deep water, but more recently in shallower water: Ravenspurn and Harding.
GBS are generally buoyant for floatout, tow and installation and are then ballasted with water, iron ore or grout to provide sufficient on-bottom weight to resist overturning. The GBS normally consists of a series of open and or closed cells that form the base and one to four legs that are integral to the design, provide stability during temporary conditions and support the topsides.
To date gravity foundations for OWEC’s have been similar in appearance to onshore foundations with the connection to the tower raised above Highest Astronomic Tide. Examples are Middelgrunden, Vindeby and Tuno Knob
The gravity foundation has advantages for installation over a monopile in that the complete OWEC can be assembled on-shore in a dry-dock as one unit and no drilling or piling equipment is necessary. However, the efficiency of the installation operation does depend on the dry-dock being located close to the OWEC’s site, thus minimising transport times. Additionally, a specially modified transportation/installation vessel is needed.
31 of 70
3.2.2 Design configuration
A variety of different configurations have been used to date and it is likely that optimisation for particular site-specific developments would result in more solutions. The likely future of gravity foundations as water depths increase are discussed below.
Solid concrete plate foundation – Middelgrunden, Vindeby
These are extensions of onshore foundations and are likely to increase significantly in weight as water depths increase, although the plate could be made to contain additional heavy ballast as an alternative to simply adding concrete mass.
Concrete box caisson (filled) – Tuno Knob
The caisson does not rely purely on the mass of concrete to provide stability and would probably not increase in mass quite so significantly as the solid plate.
Steel caisson – proposed
This would be similar in form to the plate foundation with provision for the heavy ballast.
3.3 System Dynamics
The OWEC is dynamically sensitive to excitation caused by a complete rotation of the rotor and passage of the blades past the tower. This gives two periods that must be avoided to ensure that resonant response does not occur.
For example: for a three-bladed rotor with a rotation speed of 22 revs/minute the natural period T of the OWEC must be as given below.
• stiff-stiff natural period T < 0.8sec
• stiff-soft natural period 1.0sec < T < 2.4sec • soft-soft natural period T > 3.0sec
It is normal to define the exclusion period as the calculated period +/- 10%
3.3.1 Sea bed conditions
The natural period of the OWEC is critical as discussed above and depends on the following: • Mass of the system
• Stiffness of the tower
• Stiffness of the combined substructure and foundation.
(Note: substructure is defined as the element between the tower and the seabed, foundation is defined as the element at seabed and below.)
The monopile is potentially the least stiff of the foundations options and, particularly in slightly deeper water, is likely to be of the soft-soft type. However, it was observed at Lely that the behaviour of two of the OWEC’s was stiffer than predicted, and that one was stiff-soft rather than stiff-soft-stiff-soft. It was fortunate that the exclusion period was avoided, although it must be noted that this was purely chance.
32 of 70
Multi-pile substructures are likely to have more predictable natural periods, being less dependent on the lateral stiffness of the surface and subsurface soils.
For any design, sensitivity studies must be undertaken to ensure that, even with upper and lower bound soil properties, the predicted range of OWEC natural periods does not fall within the exclusion period.
Scour of the seabed can also significantly affect the foundation stiffness. Scour protection will be necessary where granular surface soils exist in areas where the seabed can experience high currents or wave particle velocities.
3.3.2 Wave excitation
Offshore structures generally have adequate fatigue resistance if their natural period is less than about 4 seconds. Above this level, design against fatigue is not impossible, but is more difficult.
Current demonstration OWEC projects: Middelgrund, Lely, Vindeby, Blyth are in very shallow and generally sheltered water (2m-10m) and the behaviour of the foundation is little influenced by wave dynamics.
In deeper water, and particularly with monopiles and monotowers, it is likely that the natural period of the OWEC will be greater than 3 seconds, a soft-soft foundation, and will be more susceptible to wave-induced fatigue damage. Aerodynamic damping is a result of rotor rotation and affects fore-aft first order motions. This will reduce the observed fatigue damage due to waves compared to that predicted using a theoretical undamped system.
3.3.3 Structure types
Up to 20m water depth, it is likely that the drilled and grouted monopile will be the most cost-effective solution, with the concrete plate foundation as an alternative.
Above 20m, it is likely that the natural period of an OWEC on a monopile will exceed 4 seconds, with potential problems for fatigue resistance, although aerodynamic damping would help to reduce the dynamic response.
A concrete gravity structure is theoretically suitable for depths greater than 20m although the weight and cost of such a structure could be prohibitive. It could be designed either to be self-floating or barge transportable. The former would require the structure to be constructed in a dry dock, although it is noted that the Middelgrunden structures were constructed in a dry dock and were not self-floating.
Steel structures would be suitable for these depths and would probably not be excessively heavy. It is likely that they would be supported by small (36-48in) piles rather than gravity or suction foundations, although a heavily ballasted steel caisson may be cost-effective. Such structures could either be of lattice tower or monotower construction. A lattice tower would probably be lighter than a monotower, but because of the large number of members and joints, would be more expensive to fabricate and would require significantly more inspection and maintenance, particularly in the splash zone. The lattice tower is likely to have a higher natural period than a monotower, and could therefore be more fatigue-susceptible.
A monotower is a large diameter central tube supported by three or four small diameter piles. The piles are connected to the tube by means of grouted sleeves and tubular braces. The
33 of 70
benefit of the monotower is its simple construction, but it would still have a higher cost per tonne compared with a monopile. The turbine tower would be bolted to the monotower, just as for a monopile, thus the operational experience at Lely, Vindeby and Blyth regarding O&M, access, control rooms, workrooms would be transferable. Separate provision would be necessary if a lattice tower were to be used.
An alternative monotower concept is to use a large diameter tube with pile sleeves attached closely to the tube with shear plates – similar to a large offshore platform ‘leg bottle’. It is anticipated that three 36in-48in piles would be suitable for this purpose, and they could be driven, speeding up the installation process. The cost per tonne would be between a monopile and a braced monotower. Pile weight would be lower than the monopile so overall cost should be less.
The optimum concept for a particular site should be assessed by detailed analyses of all concepts and their site-specific costs:
• CAPEX:- engineering, fabrication and installation.
• OPEX:- inspection, maintenance, repair, visit intervals, support and/or accommodation vessel/unit requirements.
3.4 Icing
Sea ice is a consideration in the Baltic but not in the UK or Dutch sectors of the North Sea. However, since the sea ice is annual ice up to about 600mm thick, structures can be designed to resist it by providing sloping faces to the substructure at sea level. This reduces the ice pressure by inducing bending in the ice and breaking sheets into small pieces.
At Bockstigen, the monopiles have an octagonal form of ice protection made of stainless steel and filled with concrete.
3.5 Breaking Waves
Foundations could be designed using conservative assumptions of the effects of breaking waves compared with non-breaking waves and this would probably not be a significant cost item for a 1 or 2 OWEC development.
However, the economics of large OWECS rely on economy of scale and optimisation of all aspects of design to remain economically attractive. Better understanding of breaking wave phenomena for generic and site-specific wave environments is therefore necessary.
3.5.1 Operational experience
Breaking waves can cause both local damage to offshore structures and impose significant global forces. A single column structure such as a monopile or even a monotower is more susceptible to global forces compared with a multiple legged jacket structure because the wave force is applied instantaneously to a single discrete element rather than to an array of elements. A phenomenon known as ‘ringing’; a dynamic response to the high frequency components of a wave train, has been observed on a single column concrete gravity structure in the Norwegian sector(Sleipner). It has been suggested that a similar phenomenon can be observed with breaking waves acting on a monopile in shallow water.(Structural Dynamics of Offshore Wind Turbines subject to Extreme Wave Loading – N Rogers – Border Wind)
34 of 70
At the EPSRC OWEN workshop ‘Structure and Foundations Design of Offshore Wind Installations March 2000, NDP Barltrop discussed breaking waves and their effect on shallow structures. The effects of breaking waves upon the Bockstigen monopile structure are investigated in this study.
It should be noted that the occurence of breaking waves is not applicable for existing Dutch offshore windfarms as they are located in inland water.
3.5.2 Modelling
Because the behaviour of waves in shallow water is so dependent on local topology it may be difficult to predict whether waves would tend to break. There may well be local knowledge, existing model test information from coastal defence programmes or measurements that would indicate whether breaking waves had been observed.
Model testing would be a useful means of investigating the behaviour of waves at a particular site and with representative models of an OWECS give information on wave run-up, celerity, particle velocities and steepness. Current and wind can significantly alter the steepness of waves in shallow water, and should be considered in any testing programme.
3.5.3 Research for offshore wind
Direct research into breaking waves in relation to offshore wind energy is currently being undertaken under the Engineering and Physical Sciences Research Council (EPSRC) Renewable and New Energy Technologies (RNET) ‘Dynamic Response of Wind Turbine Structures in Waves’ NDP Barltrop University of Glasgow et al.
At the Bockstigen demonstration project the monopile and tower are strain gauged and measurement of the dynamic behaviour the OWEC and metocean and meteorological measurements are underway.
3.6 Design Developments
Garrad Hassan are further developing Bladed for Windows and Germanischer Lloyd have undertaken development under Joule 1 (Jour 0072) Study of Offshore Wind Energy in the EC The OWEN / ESPRC Workshop April 1999 identified research priorities in this area as:
A need to improve the prediction of environmental conditions for input to the design calculations, including:
• The relationship between extreme winds and waves. • Improvement in metocean predictions for sites of interest
• Improved models of boundary layer, turbulence and machine wakes in maritime areas • Predictions of wind and wave directions
• The determination of loading due to breaking waves and other shallow water effects A decision as to whether components (namely turbine and support structure) are treated in an integrated way during design, reducing conservatism.
To develop improved understanding of the structural dynamics of offshore wind structures
35 of 70 To assess the reliability of existing spectral wave models
To assess importance of wave-driven fatigue on offshore wind structures
To investigate the suitability of different types of foundations for offshore wind energy applications, for example, their response under cyclic loads and their dynamic characteristics.
To routinely monitor the performance of offshore anemometry masts and wind turbine structures – with the data used to refine models and designs
To assess the available methods of determining and measuring dynamic soil properties To investigate the economics of off-the-shelf foundation designs
36 of 70
4 STANDARDS
4.1 General
The issue of building permits for offshore wind turbines will depend on a large number of different agencies and institutions. This is not only due to the different technical fields involved, but also due to the impact from the marine environment (navigation, national parks, pipelines, cables, defence areas, etc.). Many European countries have appointed one authority to co-ordinate the necessary involvement of the relevant organisations. In most countries this appointment is also different depending on the distance to the shore, i. e. local, inside 12 miles or outside.
In Europe the technical design of wind turbines shall be based on the relevant European Directives. Of special importance for wind turbines is the Machinery and the Construction Product Directives. However, the Low Voltage and Electromagnetic Compatibility Directives also need to be satisfied. All of these Directives are general purpose documents which ask for harmonised standards and requirements.
A European set of building codes are the Eurocodes 1, 2, 3 which are published as ENV 1991, 1992, 1993. The Eurocodes are based on the method of analysing limit states according to ISO 2394 and do require the use of partial safety factors. Eurocode 1 defines loads, Eurocode 2 contains requirements for concrete structures and Eurocode 3 those for steel structures.
In addition to the existing IEC-standards, the European Directives, Eurocodes and a number of national codes for wind turbines, Germanischer Lloyd’s Regulation for the Certification of Offshore Wind Energy Conversion Systems [1] and the Danish Recommendation for Technical Approval of Offshore Wind Turbines [25] give guidance on the special design requirements for offshore wind turbines. Further national and international codes and regulations for offshore structures may be applicable.
The design of offshore wind turbine foundations can be based on the long term experience gained in projects undertaken by the oil and gas industry. However, it has to be pointed out that for existing offshore structures, wind is generally not one of the dimensioning load components. The structural design of the offshore wind turbine has to take into account both wind loads and the structural response of the foundation which may result from waves, currents or ice.
Extended remote control is one of the design modifications for offshore wind turbines. Others are corrosion protection against marine atmosphere, boat or helicopter landing facilities and lifting gear for components.
Design rules for offshore wind turbines have been derived from codes for wind turbines and those for offshore structures. Although there is considerable experience for both of those structures their combination has revealed new load cases which need to be considered in the design, construction and operation of offshore wind farms.