USI
NG
IH
SD
M
-HS
M
PRE
DIC
TIV
E
M
ETH
OD S
OF
TW
AR
ET
O
M
OD
EL
PA
SS
IN
G
LA
NE
S U
SI
NG
TA
M
=>
TW
OP
AS
S H A W N S T RA N GE , PE F IR S T G RO UP E N GI N E ER I NG , I N C. P UR DU E 2 020 RO A D S CH OOL WEDNESDAY, MARCH 11, 2020PRESENTER
Shawn Strange, P.E.
First Group Engineering
317-290-9549 (x-210)
Roads llln,ugh Better Design ..
ACRONYMS……
IHSDM - HSM
•
TAM
• TWOPAS-IHSDM – HSM PREDICTIVE
METHOD SOFTWARE (15.0.0)
•
Interactive Highway Safety Design
Model – Uses Highway Safety Manual
as Basis for Programming in the Traffic
Analysis Module
•
TAM is only part of IHSDM. It’s used to evaluate the
operational effects of existing and projected future traffic on
a highway section and the effects of alternative road
improvements such as realignment, cross-sectional
improvements, and addition of passing lanes or climbing
lanes
•
The core of the TAM is the TWOPAS rural traffic simulation
Download Home]
Public IHSDM Release
Common Downloads
Current installer for full IHSDM-HSM Predictive Method 2019 Release Download
IHSDM Windows setup program for IHSDM-HSM Predictive Method 2019 Release, version 15.0.0, October 31, 201~
Where Do You Start?
•
http://www.ihsdm.org/wiki/Download
_
•
Submit Email and create a password for
download
-HSM Predictive Method (15.0.0) Setup
"'Safer Roads Tlln»ugh letter Design ..
Completing I HSDM-HSM Predictive
Method (15_0_0) Setup
IHSDM+tSM Predictive Method (15.0.0) has been installed on
your computer.
Click Finish to dose Setup.
0 Run IHSDM+tSM Predictive Method
D Show Help Browser
IHSDM software download site is www.ihsdm.org
Ba Finish eel
IHSMD SETUP
•
After Download –
Install.
•
Find MD3.EXE in
Download Folder and
Execute (Double-Click
on File in Windows
Explorer or when it
pops on screen after
download).
■,. 49"{, complete
Copying 1,080 items from Projects_ V5 to Projects_ V5
49% complete
.-I Projects_ V5
Home Share View
X
II X
V 1' > This PC > Windows (C:) > IHSDM2019 > users > sstrange > Projects_V5
*
Quick access A OneDrive This PC • Desktop ~ Documents ,I, Downloads JI Music ~ Pictures Videos '.;... Windows (C:) _ RECOVERY (D:) SYS(\ \SERVER4) (F:)ENGINEER (\\SERVER4) (J:) CELL (\\SERVER4) (K:) ,,.. Name bookmarks economicAnalyses p2 p3 p4 p5 D user Date modified 3/9/2020 7:02 PM 3/9/2020 7:02 PM 3/9/2020 7:01 PM 3/9/2020 7:01 PM 3/9/2020 7:01 PM 3/9/2020 7:01 PM 3/9/2020 7:03 PM Type File folder File folder File folder File folder File folder File folder XML Document
IHSMD SETUP – DOESN’T
LIKE NETWORK SETUP
Back files from here onto network at the end of the day.
HSDM Configur ation Tool (IHSDM 2019 Release, v15.0.0) - D X
file fdit ,tj_elp j
Users Directories I Directory Assignmen ts
System Directory
11 Current: C:\IHSDl,12019
I
Change IPolicy Data Directory
II Current: C:\IHSDl,12019\policy
I
Change I Configuration Data Directory11 Current: C:\IHSDl,12019\config
I
Change ITemplate Data Directory
Current: C:\IHSDl,12019\templates
I
Change I User's Data DirectoryCurrent: C:\IHSDl,12019\users
I
Change l. ... I
IHSMD SETUP – DOESN’T
LIKE NETWORK SETUP (2)
IHSDM – OTHER MODULES
•
Policy Review Module
•
Crash Prediction Module
•
Design Consistency Module
•
Intersection Review Module
•
Driver / Vehicle Module
BUT WE’RE GOING TO FOCUS ON
T
RAFFIC
A
NALYSIS
M
ODULE
LIKE THE RUSSIAN DOLL IN A DOLL
• The core of the TAM is the TWOPAS rural traffic simulation model.
TWOPAS is a microscopic simulation model of traffic on two-lane, two-way highways that takes realistic account of geometric, traffic control, driver behavior, and vehicle characteristics.
• Providing this realism requires extensive logic and computations. Most
aspects of the model have been validated against traffic operational field data. Spot speed and platooning data as well as overall travel time,
speed, delays and percent time spent following are accumulated and reported.
• TWOPAS was used to develop the capacity and quality of service
procedures for two-lane highways contained in the Transportation Research Board Highway Capacity Manual since 1985.
De artment of Trans ortation
Operation Processes and Systems Management Application
INDOT Research & Archive Request Form
This electronic form is offered for the convenience for both consultants and staff to request historical Construction plans and Right of Way information from INDOT's archives. For access to Public Records Act requests, please submit requests via email to Amy Miller, INDOT Public Records Coordinator at [email protected] Thank you s color background fields are mandatory.
ase fill this form out completety in order to get it processed properly.
er the form is filled out, please check ·I'm not a robor checkbox (at the bottom of this form) first before submitting your request.
star' information First Name Last Name 1one Number Email Fax on Requested
~quest for a work that is required for a STATE PROJECT? If yes, please provide a Des. No. and/or Contract No.for the related Road Project No. :ract Number ture Number ,perty Owner Description Business Name Mailing Address Yes No State Select a State City ZIP
County Select a County DES Number
LA Code
Stationing
WHERE DO YOU GET THIS INFORMATION?
Start with INDOT Historic Plan Requestt
l ! Ilf«)IANA -~Aff HIOl1WA't' 11'~0AAO U'Q;.l~ TIOHa.. :.-.TCOWJ
ON nu WITH u ... 8UilllCAU OF PUIIUC AOl<DII. TO 911: usm WITM TICSII: "'-AHS.ilJ.SOOU!"F'\..CMtWT,1,1.~PtCa. 'Uo,M),ORAn0/1,-cN ,1,.~ 8
.0.t-jOY,111':kl0,19!!) .
STATH OF INDIANA
TATB HIGHWAY COMI\US ION
PLAN AND PROPILE OF PROPOSED
STA .TE HIGH,VAY
F. A PROJECT NO. 191 SEC.A
CRAWFORDSVILLE ... LAFA.1'ETTE ROAD. IIGIUH/UG AP'l"RCK ~ -xnJll4 Of T~ llOR tll toR'P Lit« or CRA.Wt0R0 :5V\\.U:. lt<I MOtf'CGQMC. RY
COU"'-'TYANO RUNHlM"i MOr:TH 'TO THE. 50U'hl USTCONt:Ror '5t.CTiot4 "~ PUHlPUNORlM ~AN;'.;t.<4wt:,,-U,~ TIFffCAMDtCOON.i't
... l{KflbU. 1).t• llll U._..,. ltGtlb0.l,f1a PUii~==-:::~: ,...~~:ro::!'~!:' ~ L.!Lc, "'·· '11. 'I). ;:\. ., ""~.:--.. -· •-• •~ ~-/Y •r.-"· -~ -~- • ~ ...,r-1 .- ... -··--- ···
-PREPARING YOUR MODEL INFORMATION
.e.LLAND o,02
l
ci ._._ ...,.,, ·o c.; ..,. ~ t- -90·-
--
--
..,
-
---·-
Meodo,-
•
-.:.cs» c-r...
5E:.C.17-T19N RAW . MHOW TO TAKE 13 MILES OF HISTORIC PLANS
AND CREATE A USABLE MODEL
• Old Plans are notorious for outdated topography and lack of road names
but they still contain the basics:
• Township, Section, Range.
This county road intersection is located near station 192+75.
You don’t need
USE CAD TO STITCH TOGETHER AERIALS
• Obtain Aerials from
GIS Websites that are Georeferenced and are to scale.
• Once in Cad you
can take the Historic Plans Horizontal Geometry and Recreate it in CAD to overlay the Aerials.
• This gives you
control to review the output for later.
• 1CIIO ,,, • 463 • §
.
427 Cou"1■J6,SON 415 • Location 5161en •• Souths. 9,083 • Location 10: 540254 181Located On: US 231 5.00 Ml NORTH OF 174 Direction: 2-WAY
AADT: 8523 (2019) POS Count: 4283 (2019) NEG Count: 4240 (2019) 1/iew Detail in a New Search
Go to Record in Cw;ent Search
C-tyA4650N l,!'23 • 324 59 w, ••• 1§) Cherry Grove 1,655 ... 1§) C-tyAdlOON 702 • 617
'
• ~ ~ j I ~ C-..,.IWS!,ON ,_, J wl 3,0 • ~!,JON 697 • 2279 • Garfield 11 --w--,1 I Tool• 1±11 ,l' J 1,123 1!1 1,053 • ■Jari•-y 1.199 ®' ~ ®OTHER INFORMATION
• Traffic Data https://indot.ms2soft.com/tcds/tsearch.asp?loc=Indot&modEED DRIVEWAY DENSITY PER MILE (COMBINE EAST and WEST SIDES):
• Roadside Hazard Rating -The value of this item is the roadside hazard rating for both sides of the
road. The value characterizes the crash potential for roadside designs on two-lane highways.
This description is adapted from Appendix D of Publication No. FHWA-RD-99-207, Prediction of the Expected Safety Performance of Rural Two-Lane Highways. The roadside hazard is ranked on
a seven-point categorical scale from 1 (best) to 7 (worst), representing both sides of the highway.
-o Rating= 1
D Wide dear zones greater than or equal to 9 m (30 ft) from the pavement edgeline.
o Sideslope natter than 1:4.
o Recoverable.
o Rating= 2
D Clear zone between 6 and 7.5 m (20 and 25 ft) from pavement edgeline.
o Sideslope about 1:4.
o Recoverable.
o Rating= 3
o Clear zone about 3 m (1 oft) from pavement edgeline. D Sideslope about 1:3 or 1:4.
o Rough roadside surface.
o Marginally recoverable.
o Rating= 4
o Clear zone between 1.5 and 3 m (5 to 10 ft) from pavement edgeline.
o Sideslope about 1 :3 or 1 :4.
D May have guardrail (1.5 to 2 m [5 to 6.5 ft] from pavement edgeline).
D May have exposed trees, poles, or other objects (about 3 m or 10 ft from pavement edgeline).
D Marginally forgiving, but increased chance of a reportable roadside collision.
o Rating= 5
o Clear zone between 1.5 and 3 m (5 to 10 ft) from pavement edgeline.
o Sideslope about 1 :3.
D May have guardrail (0 to 1.5 m [0 to 5 ft] from pavement edgeline).
D May have rigid obstacles or embankment within 2 to 3 m (6.5 to 1 oft) of pavement edgeline.
o Rating= 5
D Clear zone between 1.5 and 3 m (5 to 10 ft) from pavement edgeline.
o Sideslope about 1:3.
D May have guardrail (0 to 1.5 m [Oto 5 ft] from pavement edgeline).
D May have rigid obstades or embankment within 2 to 3 m (6.5 to 1 Oft) of pavement edgeline.
o Virtually non-recoverable.
o Rating= 6
o Clear zone less than or equal to 1.5 m (5 ft).
o Sideslope about 1:2.
o No guardrail.
D Exposed rigid obstades within Oto 2 m (0 to 6.5 ft) of the pavement edgeline.
o Non-recoverable.
o Rating= 7
o Clear zone less than or equal to 1.5 m (5 ft).
o Sideslope 1 :2 or steeper. D Cliff or vertical rock cut
o No guardrail.
D Non-recoverable with high likelihood of severe injuries from roadside collision.
The data type associated with this item is enumerated.
OTHER INFORMATION (2)
IHSDM-HSM Predict1 e Method 1IHSDM 2019 Release, ·15.0.0)
File Edit User Project Highway Intersection Ramp Terminal Roundabout Interchange Evaluation Economic Analyses E
Project 1 Project 2 ··~ Highway 1 (v6) --~ Highway 2 (v1) ··~ Highway 3 (v1) IHSDM Pike Project 3 us 231 ~ --~ 11€Hli-fiNIM
· [v3] Evaluation 1 South (Traffic Analysis) [v4) Evaluation Center (Traffic Analysis)
[v5) South Report Revised with School Zone (Traffic Analysis) [v5) South Report with Realistic School Zone (Traffic Analysis) [v5) South Model-Existing Conditions (Traffic Analysis)
[v5) Evaluation 26 (Traffic Analysis)
[v5) Evaluation 28 (Crash Prediction)
; ··~ US 231 Center (v4)
$~ US 231 North (v4)
$~ US 231 South (Copy 1) (v1)
$--~ US 231 South with Passing Lane (v2) $~ US 231 South with NB& SB Passing Lane (v1)
ffi··--' US 231 Center Passino Ml
~ Edit US 231 South (vS)
File Edit Help
[ Select • module ,lew.
7
ffic Analysis Data v
J
El-·Traffic Analysis Data· ..,, Horizontal Alignment
"" Vertical Alignment
..,, Lane
·· f Two-way Left Turn Lane
··"" Cross Slope ··"" Shoulder Section ,4 Available Passm S1 ht S f Section 1 !···"" Posted Speed !···· f Curve Widening !····"" Report Location !···"" Crawl Region
!···f Reduced Speed Zon
!···"" No Passing Zones !· · f Obstruction Offset L ... f Lane Offset + ·· >< Section 3 1±1·· >< Section 5 Tl
LET’S GET STARTED
The software first requires input data to create the roadway model using the Traffic Analysis Data Module View:
• Horizontal Alignment • Vertical Profile • Lane Configurations • TWLTL • Cross Slope • Shoulder Width
• Roadway Section Data:
• Posted Speed
• Output Report
Locations
• No Passing Zones
IHSDM-HSM Predictive Method (IHSDM 2019 Release, v15.0.0)
File Edit User Project Highway Intersection Ramp Terminal Roundabout I
Economic Analyses Bookmarks Project 1 $)... Project 2 f .... ~ Highway 1 (v6) f .... ~ Highway 2 (v1) L...~ Highway 3 (v1) ,... IHSDM Pike ,... Project 3 g ...
!
•~**"
$ .... US 231 South (v5)[v3) Evaluation 1 South (Traffic Analysis)
[v4) Evaluation Center (Traffic Analysis)
[v5] South Report Revised with School Zone (Traffic Analysis)
[v5] South Report with Realistic School Zone (Traffic Analysis)
[v5] South Model- Existing Conditions (Traffic Analysis)
[v5] Evaluation 26 (Traffic Analysis) 1 ... [v5] Evaluation 28 (Crash Prediction)
$ .. ~ US 231 Center (v4)
[v4) Evaluation 1 (Traffic Analysis)
[v4) Existing Cond Eval (Traffic Analysis)
[v4] Evaluation 3 (Crash Prediction)
CREATING THE ROADWAY MODEL :
NAME ORGANIZATION
The analysis requires different types of models with different kinds of output. For Example:
• South Model under Existing
Conditions and Existing Traffic vs
• South Model with Proposed
Improvements and Existing Traffic vs
• South Model under Proposed
Improvements and Future Traffic vs
• South Model under Proposed
Future Traffic with No Improvements
US 231 South (v5)
- File Edit Help
[ Select a module view:7 ;
Traffic Analysis Data v B··Traffic Analf is Data
f----~ lll·ll~~•l1IID~ll-l1Ml~1II
--~ Vertical Alignment
.. ~ Lane
·· f Two-way Left Turn Lane f --~ Cross Slope
--~ Shoulder Section
... ~ Available Passing Sight
~-f Section 1 j .... ~ Posted Speed
j .... f Curve Widening !···~ Report Location
!---~ Crawl Region
!···· f Reduced Speed Zon :--··-~ No Passing Zones j .... f Obstruction Offset L ... f Lane Offset t} X Section 3 l±J·X Section 5 c::,
-Horizontal AlignmentThis table contains data that define the horizontal alignment of the highway centerline. Horizontal alignment element types are Tangent, Curve (simple curve), Spiral (between a Tangent and, Curve, or part of a Spiral-Spiral pair), and Deflection (horizontal deflection angle without horizontal curve).
IAdd ...
Type Start Loe. ( Sta. ft) End Loe. (Sta. ft) Curve Radius Direction Radius Deflection
1ft) of Curve Position Angle
ltfP.nl Edi Tangent 169+85.000 170+67.500 ,., Curve 170+67.500 175+79.400 5,729.60 Left De~ Tangent 175+79.400 177+66.100 Curve 177+66.100 183+01.100 5,729.60 Right Tangent 183+01.100 195+78.300 [validate ... Curve 195+78.300 205+78.300 83,847.00 Left Tangent 205+78.300 230+09.500 Curve 230+09.500 240+09.500 491,108.57 Right [ Help ... Tangent 240+09.500 256+77.800 Curve 256+77.800 266+77.800 110,895.48 Left
Tangent 266+77.800 355+61.000 Add Horizontal Alignment Elements X
Curve 355+61.000 365+61.000 85,944.00 Right
Tangent 365+61.000 382+07.700 Element Type : Deflection V
Curve 382+07.700 392+07.700 156,261.82 Left Start Loe. (Sta. ft) : I 1105+ 76.800(2)
1
Tangent 392+07.700 415+53.680
Curve 415+53.680 426+33.680 2,291.84 Left End Loe. (Sta ft) .
Tangent 426+33.680 431+47.920
Curve 431+47.920 458+27.920 2,291.84 Right Curve Radius (ft) .
Tangent 458+27.920 466+27.920
Direction of Curve : Left I
Curve 466+27.920 493+07.920 2,291.81 Left
'
Tangent 493+07.920 497+91.610 Radius Position : Start I
Curve 497+91.610 508+88.610 2,291.84 Right
Tangent 508+88.610 543+47.000(1) Deflection Angle (deg) :
l
Curve 543+47.000(1) 548+65.500(1) 3,183.11 Left ~
Tangent 548+65.500(1) 550+47.700(1) Back I Add I Close Help
-CREATING THE ROADWAY MODEL :
HORIZONTAL ALIGNMENT
t.'=_~
File Edit Help
-
[ Select a module view: 1 Vertical Alignmentffic Analysis Data __:J This table contains data that define the vertical alignment along the highway centerline. Vertical alignment element types are Tangent and Vertical Point of Intersection (VPI). El-Traffic Analysis Data
\ ..
~ Horizontal ,l,Z,i"t L.
\ .. .,;~ Nffifflffil·fo• Lane ·
t f Two-way Left Tum Lane
IAdd ..
1 --~ Cross Slope Type VPI/Start Loe. (Sta. End Loe. (Sta. ft) Back Back Forward Forward
[ --~ Shoulder Section ft) Grade Length Grade(%) Length (ft)
I ~ Available Passing Sight 1%1 flt\
~
l~l t Section 1 Tangent 169+85_000 171+50_000 0_32 o_oo o_oo
"
!-~ Posted Speed VPI 173+00_000 0_32 150_00 -0_19 150_00
!---f Curve Widening Tangent 174+50_000 178+50_000 -0_19 o_oo o_oo te
!---~ Report Location
VPI 180+00_000 -0_19 150_00 0_24 150_00
!---~ Crawl Region
VPI 183+00_000 0_24 150_00 0_13 150_00
I validate ___ !-f Reduced Speed Zan
!---~ No Passing Zones VPI 186+00_000 0_13 150_00 0_60 150_00 '---f Obstruction Offset Tangent 187+50_000 189+00_000 0_60 o_oo o_oo
f Lane Offset VPI 190+50_000 0_60 150_00 o_oo 150_00
I Help .. I~} >C Section 3 Tangent 192+00_000 200+00_000 o_oo o_oo o_oo l±l X Section 5 VPI 201+50_000 o_oo 150_00 -1_24 150_00 Tangent 203+00_000 203+50_000 -1.24 o_oo o_oo VPI 205+00_000 -1_24 150_00 -0_34 150_00 VPI 208+00_000 -0_34 150_00 0_29 150_00 VPI 211+00_000 0.29 150_00 -0_22 150_00 Tangent 212+50_000 213+50_000 -0_22 o_oo o_oo VPI 215+00_000 -0.22 150_00 0_86 150_00 Tangent 216+50_000 219+50_000 0_86 o_oo o_oo VPI 221+00_000 0_86 150_00 0_07 150_00 Tangent 222+50_000 232+00_000 0_07 o_oo o_oo VPI 233+50_000 0_07 150_00 0.73 0.73 Tangent 235+00_000 238+00_000 0.73 o_oo o_oo VPI 239+-50_000 0.73 150_00 0_14 150_00 Tangent 241+00_000 247+50_000 0_14 o_oo o_oo VPI 249+-00_000 0_14 150_00 0_55 150_00 "
- Add Vertical Alignment Elements X
< > -
-Type: VPI V _________:
Selecting Project 2 from previous tool invocation VPI/Start Loe. (Sta. ft)=!
Starting editor for US 231 South (v5) ...
5507 sight distance elements added End Loe (Sta ft)
Back Grade (%):
Back Length (ft) : 0.00
Forward Grade (%):
.
Ii ..
Forward Length (ft) : I o.ool
[ Back I Add I Close J [ Help
~
CREATING THE ROADWAY MODEL :
Edit: US 231 South (v5)
File Edit Help
I Select a module view: 7
l Traffic Analysis Data _____:_J
Lane
---This element specifies the characteristics of a lane_ A number of lane types are supported including thru, climb, passing, and turn lane types_ El··Traffic Analysis Data
· . ..; Horizontal Alignment
. ..; Vertical Alignment
<
..;m
· f Two-way Left Turn Lane . ..; Cross Slope
. ..; Shoulder Section
, ..; Available Passing Sight
~ ·· f Section 1
:···..; Posted Speed
:-·f Curve Widening !···..; Report Location
:···..; Crawl Region
:-· f Reduced Speed Zon !···..; No Passing Zones :-··· f Obstruction Offset L .... f Lane Offset + ·· X Section 3 ffi·· x Section 5 > Start Loe. (Sta. ft) 169+85.000 169+85.000 543+46.800(1) 543+46.800(1) 587 +88.500(2) 587 +88.500(2) 780+ 76.800(2) 780+76.800(2) 818+76.800(2) 818+76.800(2) 312+00.000 316+00.000
Selecting Project 2 from previous tool invocation Starting editor for US 231 South (v5) ...
5507 sight distance elements added
End Loe. Side of Road (Sta. ft) 543+46.800(1) Right 543+46.800(1) Len 587+88.500(2) Right 587+88.500(2) Len 780+76.800(2) Right 780+76.800(2) Len 818+76.800(2) Right 818+76.800(2) Len 1105+ 76.800(2) Right 1105+ 76.800(2) Len 322+00.000 Right 324+50.000 Len
Priority Type Start Width
(ft) 10 Thru 12.00 10 Thru 12.00 10 Thru 12.00 10 Thru 12.00 10 Thru 12.00 10 Thru 12.00 10 Thru 12.00 10 Thru 12.00 10 Thru 12.00 10 Thru 12.00 12 Len Turn 12.00 13 Righ!Turn 12.00
Add Lane Elements
End Width (ft) Passing Prohibited On 12.00 □ 12.00 □ 12.00 □ 12.00 □ 12 .. 00 □ 12.00 □ 12.00 □ 12.00 □ 12.00 □ 12.00 □ 12.00 &21 12.00 X Start Loe. (Sta. ft): I 169+85.000 I :c================~ End Loe_ (Sta_ ft): I 1105+76.800(2)1 "'====-======.======='
Side of Road : Right
.=============~==, @ Priority: Type: Thru ,---===========---. @ Start Width (ft) : :c================~ @ End Width (ft) :
D Passing Prohibited On Opposing Lane(s)
Back Add L Close Help t:d t Delete [validate ... [Help ...
CREATING THE ROADWAY MODEL :
LANE CONFIGURATION
Edit US 231 South (v5)
File Edit Help
r Select a module view:
7
l Traffic Analysis Data ~El-Traffic Analysis Data
·-~ Horizontal Alignment
.. ~ Vertical Alignment
.. ~ Lane
'
.. ~ Cross Slope
· ~ Shoulder Section
, -~ Available Passing Sight
~ .. f Section 1
1 ... ~ Posted Speed
1 · f Curve Widening
1-.. ~ Report Location
1 ... ~ Crawl Region
: .... f Reduced Speed Zon
:··-~ No Passing Zones
!""· f Obstruction Offset
L.. .. f Lane Offset
• .. x Section 3
l±l .. x Section 5
Two-way Leh Turn Lane
This element specifies the characteristics of a two-way left tum lane.
Start Loe . Start Begin Loe. Lane Width
(Sta. ft) Centerline Full Width (ft)
OffsP.t lftl /Sta. ft\
Add Two-way Left Turn Lane Elements
Start Loe. (Sta. fl) : I
Start Centerline Offset (fl) : I
cy) Begin Loe. Full Width (Sta. fl) :
cy) Lane Width (fl) :
cy) End Loe. Full Width (Sta. fl) :
End Centerline Offset (fl) : I
End Loe. (Sta. fl) : [ L Back
l I Add
c::, 8 ~
End Loe. End End Loe. I Add ... I
Full Width Centerline (Sta. ft)
/Sta. ft\ OffsP.t lftl Edrt
7
X Delete I 11111:~t•l•M] o.oo I Validate .... Help ... o.oo I 1105+ 76.800(2)] I L Close r- Help JCREATING THE ROADWAY MODEL :
TWLTL (OPTIONAL)
----: .. Edit US 231 South (v5)
File Edit Help
Select a module view:- ; Cross Slope
---Traffic Analysis Data
El-Traffic Analysis Data
f .. ··'-' Horizontal Alignment
f-···'-' Vertical Alignment
f '-' Lane
f···· Two-Mi Left Turn Lane
, ·" iih"!'_11i¥1 f-···'-' Shoulder Section
f. '-' Available Passing Sight
~-- Section 1
:··'-' Posted Speed
:···· f Curve Widening
:···· '-' Report Location
:···'-' Crawl Region
:··· f Reduced Speed Zon
:···'-' No Passing Zones
:··· f Obstruction Offset
L. ... f Lane Offset
$·· x Section 3 ffi·· x Section 5
This element specifies the cross slope, the lateral grade or
Location (Sta. ft) Side of Road
169+85.ooolsoth
Cross
Slope(%)
I -2.ool
CREATING THE ROADWAY MODEL :
CROSS SLOPE
Doesn’t Seem to Apply to Superelevation
le Edit Help
Select a module view:
3
1 1 Shoulder Sectionc Analysis Dato v I This element specifies the shoulder slope, width and material at specific locations. The highway model assumes that the shoulder slope and width changes linearly between the
13--Traffic Analysis Data · --~ Horizontal Alignment
--~ Vertical Alignment --~ Lane
--f Two-way Left Turn Lane --~ Cross Slol"'_ ··../@fflind►ffimffi -~ Available Passing Sight
13· f Section 1 : ~ Posted Speed !···· f Curve Widening !· -~ Report Location L ... ~ Crawl Region , f Reduced Speed Zan
!----~ No Passing Zones
!··· f Obstruction Offset , L ... f Lane Offset
@·· x Section 3
ID·· x Section 5
this element and between elements.
Start Loe. (Sta. ft) End Loe. (Sta. ft) Side of Road 169+85.oool 543+46.000(1 )!Both I Start Slope (%) -2.ool End Slope (%) -2.ool Start Width (ft) 2.001
End Width (ft) Material
2.oo!Gravel I Rumble Strips 0 Priority I
CREATING THE ROADWAY MODEL :
SHOULDER SECTION
Assign a Priority : The value of this item specifies the priority of the shoulder section which in a shoulder section with multiple elements indicates the relative placement of that element.
it US 231 South (vi)
File Edit Help
I Select a module view:
7
1 l Traffic Analysis Data---=-8 Traffic Analysis Data
v' Horizontal Alignment '••-<./ Vertical Alignment
1···"' Lane
f··· t T wo•way Left Turn Lane
1-· <./ Cross Slope L. -o./ Shoulder Section
'···· x Available Passing Sight Di
E;Jf l!mml
.,, Posted Speed f Curve Widemng
v' Report Location
'Iii/ Crawl Region f Reduced Speed Zone
<./ No Passing Zones f Obstruction Offset 1 f Lane Offset [D .. x Section 3 I±} x Section 5 Title : Section 1 7
Start Loe. (Sta. ft) : 169+85.00~
End Loe. (Sta. ft) : 543+46.800(~
Area Type : Rural 7
Functional Class : Arterial 7
Category: Rural, Two Lane
________________
']Analysis Class Titles : All 7
CREATING THE ROADWAY MODEL :
SECTION INFORMATION
Roadway Classification, Posted Speed, Report Locations, Etc.ile Edit Help
-
r
Select a module view:1_ Traffic Analysis Data _____:__J
BTraffic Analysis Data
-~ Horizontal Alignment
· ~ Vertical Alignment
··~ Lane
· f Two-way Left Turn Lane
-~ Cross Slope
~ Shoulder Section i..,, .. -•. •. 0 f Section 1 · !· ~ Posted Speed ! f Curve Widening !· ~ Report Location !· ~ Crawl Region !···· f Reduced Speed Zon !···· ~ No Passing Zones !··· f Obstruction Offset
' ··· f Lane Offset ·· x Section 3
ID· x Section 5
I Available Passing Sight Distance
I This element is the available sight distance from the specified location in the normal direction of travel for the specified side of the road.
Location Side of Road Distance (ft)
I (Sta. It) Add ... 169+85.000 Right 1,558.40 "' 170+17.808 Right 1,509.19 170+50.617 Right 1,459.97 170+83.425 Right 1,407.48 171+16.234 Right 1,361.55 I 171+49.042 Right 1,312.34 Validate ... 171+81.850 Right 1,266.40 172+14.659 Right 1,220.47 I 172+47.467 Right 1,177.82 Help ... 172+80.276 Right 1,135.17 173+13.084 Right 1,092.52 173+45.892 Right 1,053.15 173+78.701 Right 1,013.78 174+11.509 Right 9TT.69 174+44.318 Right 944.88 174+77.126 Right 915.35 175+09.934 Right 885.83 175+42.743 Right 866.14 175+75.551 Right 849.74 176+08.360 Right 839.90 176+41.168 Right 833.33 176+73.976 Right 836.61 177+06.785 Right 846.46 177+39.593 Right 872.70 ., Generate .. I
CREATING THE ROADWAY MODEL :
PASSING SIGHT DISTANCE
Can be automatically generated for the corridor based on the R/W and Horizontal Alignment
Edit US 231 South (v5) Io I@_~
-
File Edit Help[ Select a module view:
ffic Analysis Data
]
'
I
No Pass ZoneThis element specifies the attributes of a no passing zone.
El Traffic Analysis Data
;· ~ Horizontal Alignment
. · ~ Vertical Alignment
, .. ~ Lane
' ----~ f Two-way Left Turn Lane Cross Slope Start Loe. End Loe. Side of Road Due To Add ..
i· ~ Shoulder Section (Sta. ft) (Sta. ft) Opposing
7 ~ Available Passing Sight
~
~ f Section 1 169+85.000 185+55.000 Right E2I
---4 Posted Speed 185+55.000 193+46.000 Left E2I
Delete J
'---f Curve Widening I 221+62.000 224+54.000 Right E2I
---~ Report Location 224+93.000 231+22.000 Left E2I
~ Crawl Region
265+25.000 271+85.000 Right E2I
! - n 272+40.000 279+06.000 Left E2I Validate ...
---f Obstruction Offset 293+71.000 303+84.000 Right E2I
f Lane Offset 303+84.000 331+42.000 Both E2I Help ...
~ x Section 3 355+40.000 361+82.000 Right E2I
ID x Section 5 362+82.000 371+84.000 Left E2I
379+51.000 386+09.000 Right E2I 386+37.000 393+10.000 Left E2I 410+96.000 419+31.000 Right E2I 419+31.000 500+26.000 Both E2I 500+26.000 513+51.800(1) Left E2I 536+49.800(1) 543+46.800(1) Right E2I . Generate ... < >
I ~;'.:~~i~~ ~:~!':~'. ~.~00~!~~°.~s ,~~I invocation
CREATING THE ROADWAY MODEL :
NO PASSING ZONES (SIGNED)
---• "-F-'-ile:....:Vc:ie_:;_w_;H_;;e::,IP:_ _____________________________________________________________ __,
~l~~Q. 11ltlA
US231 South
"Stylized view of data for reference only
~ ...
1111 11IIIIIIIIMIIIIII 1111111 111111 II II 11111 111 IIIIIIIIIMIIIIII lllll 111111111 111 11 1111 11111 11 11111111 111 HO llillii jj@ jjjjjJL
_J
CREATING THE ROADWAY MODEL : VISUAL
_ ,~Maps X +
C i google.com/maps/@40.1605508,-86.9134974,3739m/data=!3m1 ! 1 e3?hl=en&authuser=0
Imported !: Downloads G
Searcn Goog e Maps
US231 South
CREATING THE ROADWAY MODEL : CHECK
GEOMETRY
RUNNING YOUR MODEL ANALYSIS (TRAFFIC
ANALYSIS MODULE AND TWOPAS)
• Traffic Analysis Module (TAM) may be used to evaluate the operational effects
of existing and projected future traffic on a highway section and the effects of alternative road improvements such as realignment, cross-sectional
improvements, and addition of passing lanes or climbing lanes.
• The core of the TAM is the TWOPAS rural traffic simulation model.
• TWOPAS was used to develop the capacity and quality of service procedures
for two-lane highways. The TWOPAS simulation results from the TAM are for a specific road and specific traffic conditions
File Edit User Project Hinhw:iv Intersection Ramp Terminal Roundabout lnterchanQe Evaluation Economic Analyses EA Project Economic Analysis Help Ill· Q Project 1
e-Q Project 2 !•-.j Highway 1 (w) i-.j Highway 2 (v1) L _j Highway 3 (v1) IE· Q IHSDM Pike Ill-Q Project 3 sQ us 231 .j US 231 South (v5) IE .j US 231 Center (v4) _j US 231 North (v4) IE .j US 231 South (Copy 1) (v1)
~ US 231 South with Passing Lane (v2)
13 .j US 231 South with NB& SB Passing Lane (v1)
[v1) US 231 South Model with SB Passing & NB Passing (Traffic
ldilffi@mbf;;
~ US 231 Center Passing (v1)
IE .j US 231 Center Passing (FGE Recom) (v3)
$ _j US 231 North INDOT Passing (v1)
IE .j US 231 South Exist Cond (v1)
$~US 231 North INDOT Passing Signal at North End (v1)
IE .j US 231 South with Passing Lane (2041) (v1)
.j US 231 South No Passing Ex Lane (2041) (v1)
IE .j US 231 Center No Passing(2041) (v1) .j US 231 Center Passing (2041) (v1)
IE .j US 231 South with NB& SB Passing Lane (2041) (v1)
Evaluation Operations un I at1on I f Show Report [ Show Raw Result I I Show Spreadsheet I ... I ... I I
"' ~ Run (ProjKt) US 2.31 : (Highway) US 2.31 South with NB& SB Passing Lan~: Evaluation 2.
Select an evaluation type
This wizard will guide you through the omcess of running an IHSDM ~ .
Select the type of evaluation for the current highway:
Crash Prediction Design Consistency Traffic Analysis ~ I Back I Description
Title : Jus 231 South Model with NB and SB Passing
Comment: Jcreated Fri Mar 06 14:38:18 EST 2020
US 231 South Model with NB and SB Passing• Trial for Presentation
Evaluation bounds
Minimum Location (Sta. ft) L 169+85.000 Maximum Location (Sta. ft): Enter the evaluation bounds above or select contiguous evaluation section(s) from table below
Title Area Tvoe Functional Class Cateoorv Start Loe. End Loe. Analvsis
Section 2 Urban Arterial Urban/Suburban M .. 543+46.800(1) 587+88.500(2) Crash predicti.!.
Section 3 Rural Arterial Rural, Two Lane
Section 4 Urban Arterial Urban/Suburban M ..
Section 5 Rural Arterial Rural, Two Lane
587+88.500(2) 780+76.800(2)AJI . \
780+76.800(2) 818+76.800(2) Crash predidi
818+76.800(2) 1105+76.800(2)AJI
Select an evaluation type below .
Evaluation type 0 Policy Review
0 Crash Prediction 0 Design Consistency
~
:~~~:;:is
Nex1 I Interrupt I [ Cancel
&i.~ 543+46 sooci] I _J l 11 I I
RUNNING YOUR MODEL ANALYSIS
This project had 2 Towns that separated the models into South, Center, and North
South Model defined between Stations <= Use Traffic Analysis
Set traffic analysis attributes---,
I
Configuration Specify evaluation bounds, configuration and upstream alignment inboth direction (i.e., the general character of the alignment preceding the evaluation bound).
1 Upstream Alignment
Configuration Name : Default
Increasing Stations : Level Tangent
Decreasing Stations : Level Tangent
L_ ___________________ ___,
L---::-=====================,---Next Interrupt
RUNNING YOUR MODEL ANALYSIS (2)
Set the general character of the alignment
preceding the evaluation area.
Run (Projffi) US 231: (Highway) US 2.31 South wrth NB& SB Passing Lan~: (Evaluation) US 2.31 South Mod~I wrth NB and SB Passing (Traffic Analysis)
Set traffic flow
Enter traffic flow data for both directions of travel.
Note:
After entering Vehicle Flow Rates, clicking on the "Generate
Entering Platoon" button to auto-<:alculate the Entering Platoons
(percents) based on those Flow Rates.
Traffic flow
Increasing Stations ---Vehicle Flow Rate (vph) :
Entering Platoons (%):
Percent Trucks (%):
Percent RVs (%):
Decreasing Stations---~
Vehicle Flow Rate (vph) :
Entering Platoons (%):
Percent Trucks (%):
Percent RVs (%):
Generate Entering Platoon %
Next Interrupt
RUNNING YOUR MODEL ANALYSIS (3)
Enter Known Traffic Data for Design Hour. Use the Generate Entering Platoon Feature Here.
Increasing Stations Passenger Car -Mean (mph) : I
•
Passenger Car -Std Dev (mph) :l
5.0 -Truck -Mean (mph): I 59.5 -Truck -Std Dev (mph): I 3.5 RV -Mean (mph) : I 59.5 RV -Sid Dev (mph) : I 4.0L
I
Decreasing Stations Passenger Car -Mean (mph) : [ 61.5 Passenger Car -Std Dev (mph) : I 5.0 Truck -Mean (mph): [ 59.5 Truck -Std Dev (mph):l
3.5 -RV -Mean (mph) : I 59.5 RV -Sid Dev (mph) : r 4.0RUNNING YOUR MODEL ANALYSIS (4)
IncreasingStations for this project is
Northbound.
Use Default Speeds
Set Simulation Settings Simulation Parameters
Test Period (min) I
II
6001 Warm-Up Period (min): ~I _________ B._6
Specify the simulation parameters.
L
Generate Warm-Up PeriodD Use Min Sight Dist When Missing 0 Use lWOPAS User Default File
Min Sight Dist (ft) I 1,050.0~
0 Show lWOPAS INP file before run
Simulation Seeds
Entering Headway
Increasing Stations [
IL
26,4~ Decreasing Stations : ...c
______
6_7,_05_7_,0_6~_,5Entering Speed
Increasing Stations [ 82,9~ Decreasing Stations : ~L ______ B_9,_14_5_,9_5~~3
L
Priming and Passing I 53,617,2791
Generate New Seeds
Default Values
_J
Back Next Interrupt Cancel
RUNNING YOUR MODEL ANALYSIS (5)
Analysis Test Period is One Hour. Everything Else is Random Generation in this StepRun (Proj&t) US 231 : (Highway) US 231 South with NB& SB Passing lane: (Evaluation) US 231 South Model with NB and SB Passing (Traffic Analysis) ~I:.§!_
IHSDM checked the available highway data versus the data that could be used for the evaluation. Data elements that may need further review are listed in this panel. Note: More information is available about the Data Requirements by module.
B I .. Undivided, Two Lane; Rural; Arterial
-;. ..,, Posted Speed
'
'· ..,, Cross Slope Highway Title : US 231 South with NB& SB Passing Lane
'
'· ~ Report Location
~ Available Passing Sight Distance
~ Shoulder Section Highway Comment: Copied from US 231 South with Passing Lane (v1)
f Two-way Left Tum Lane '
f Median
t f Lane Offset Import File:
r f Curve Widening
f Obstruction Offset
..,, Crawl Region
EMax(%): 8% V Default Normal Cross Slope(%): -2.0
f Reduced Speed Zone
~ No Passing Zones
r Horizonta.l Alignment Bounds
I
Mm Loe. (Sta. ft) : 169+85.000 Max Loe. (Sta. ft) : 1105+ 76.800(2)
_J I
rCoordinates
Loe. (Sta. ft) : 169+85.000 X(ft): 0.00 Y(ft): 0.00
I I I
rHeading
Loe. (Sta. ft) : 173+00.000 Angle (deg) : 0.0000
I I I
rElevation
Loe. (Sta. ft) : 169+85.000 Elevation (ft) : 490.46
_J
[ Back l I Next I I Interrupt I Cancel
RUNNING YOUR MODEL ANALYSIS (6)
This Step confirms your model
" ~ " .. I!! .. " g- !IX) " 570 0 ., .. 540 510 > .. «) w ~ $ .. 3~ 2,400 1,000 ~-= !IX) "' .. .. > ~~ 0 2 2.11. :, 1.31. u T..-gen ;; 1.311 .. 2111 .. ~"' 170,()0(l. :E. ..
!!lo 170.(XDI T..-gen "C .. 3'0.(XDI II: 510.(XKlR 48 l "° "' " 32 ·~ 24 .!! 0 18 ... 8 222 "" 219 ~ 218 ~ ;:: 213 0 .;: 210 'JfJ7 8t '.c' Ill 0. 58 .s "C .. 52 48 .. 0. (/)
..
"° d' ~Traffic Analysis Summary, Increasing Direction ofTravel
Project: US 231, Evaluation: US 231 South Model with NB and SB Passing
Highway: US 231 South with NB& SB Passing Lane
---~--'-=es Ila•
·17
aa '\L ~ ~ d' 1' ,f d' .,f1 d' 4 d' ,;l ~d' ,I'd' #d' .....
,;:"' ,v ~ .... .... ,#MODEL ANALYSIS - OUTPUT
Quick Graphical Overview of Model
Output Summary
[Section Summa[Y in the Engineer's Manual]
Table 4 below includes the traffic output data table for the main road section . The table reports the actual simulated flow rate, percent time spent following, average speed, trip time, traffic delay, geometric delay, total delay, number of passes, vehicle-distance traveled, and vehicle-hours of travel. These simulation outputs are reported for each direction and both directions combined.
MODEL ANALYSIS – OUTPUT NUMERICAL SUMMARY
Table 4. Section Sum~
Direction of Travel
Total Flow Rate Percent Average
Traffic Geometric Number Distance Travel from Time Spent Travel Trip Time Total Delay
Delay Delay of Traveled Time Simulation Following Speed (min/veh) (min/veh)
(min/veh) (min/veh) Passes (mi) (veh-(vph) (0/o) (mph) hrs) !ncreasinq Decreasinq [ I ~ [ _TI[ 5~ [ 7.~[ o.~[ ~ [ o.~[ 13~L 1,50Ll [ 26.~ 1981 3511 56.4!1 7.~I 0.311 0.211 o.511 11611 1,385.oll 24.51 !combined II 4131 3411 56.611 7.~I 0.211 0.311 o.511 25111 2,887.711 51.11
MODEL ANALYSIS – OUTPUT STATION BY STATION OUTPUT
5. Station Summary (Increasing)Station
'.\Jumber Location (Sta. ft)
umber of Lanes Traffic ,·olume (Ypd) Speed :'.\lean Cars (mph) Speed :'.\lean T111cks (mph) Speed !\lean R\·s (mph) Speed Mean All (mph) Percent follo"ing (%) Platoon Size '.\Jumberof Passes 1 170+01.404 1 214 61.4 61.0 61.1 61.4 28 2.6 0.0 2 171+51.404 1 214 61.4 60.5 60.9 61.2 28 2.6 0.0 3 173+01.404 1 214 61.1 59.7 60.5 60.9 28 2.6 0.0 4 174+51.404 1 214 60.6 59.4 60.4 60.4 28 2.6 0.0 5 176+01.404 1 215 60.2 59.3 59.9 60.1 28 2.6 0.0 6 177+51.404 1 215 59.9 59.1 59.7 59.8 28 2.6 0.0 7 179+01.404 1 216 59.7 59.0 59.3 59.7 29 2.5 0.0 8 180+51.404 1 216 59.6 58.9 58.9 59.5 29 2.5 0.0 9 182+01.404 1 216 59.5 58.9 58.8 59.3 30 2.6 0.0 10 183+51.404 1 216 59.3 58.8 58.4 59.2 31 2.6 0.0 11 185+01.404 1 215 59.1 58.8 58.0 59.0 30 2.5 0.0 12 186+51.404 1 215 59.0 58.8 57.8 59.0 30 2.5 0.0 13 188+01.404 1 214 59.1 58.8 57.6 59.0 30 2.5 0.0 14 189+51.404 1 213 59.2 58.7 57.8 59.0 30 2.6 0.0 15 191+01.404 1 213 59.3 58.7 57.8 59.1 30 2.5 0.0 16 192+51.404 1 212 59.3 58.9 57.7 59.2 30 2.6 0.0 17 194+01.404 1 213 59.3 59.0 57.8 59.3 31 2.6 0.0 18 195+51.404 1 213 59.5 59.0 57.8 59.3 32 2.6 1.0 - 19 -- 197+01.404 - 1 - 213 59.4 59.0 57.6 59.3 --- 32 - 2.6 3.0
MODEL ANALYSIS – OUTPUT STATION BY STATION OUTPUT (2)
Traffic Analvsfa EYaluation Report
"-..
Simulation Station S11111111aries"-....
Speed Speed
"-..
. Speed :\lean Speed
ration umber of Traffic :\lean l\lean Percent f ollo"ing . umberof
Location (Sta. ft) T111cks llean All
. ·umber Lanes Yolume (,-pd) Cars R\·s (%) Passes
(mph) (mph) (mph) (mph)
~
f"'l',,. 181 44o-+-O 1. 404 2 219 54.5 52.5 53-9 54.5 21 2.3 6.0 182 441+51.404 2 219 54.5 52.5 53-9 54.5 _o _ _2 4.0 _o __ 3 183 443+01.404 2 219 54.5 52.5 53.9 54.5 3.0 184 444+51.404 2 220 54.5 52.5 53.9 54.5 19 2.4 1.0 _o __ 3 185 446+01.404 2 220 54.5 52.5 53.9 54.5 1.0 186 447+51.404 2 220 54.5 52.5 53.2 53.9 22 2.4 4.0 187 449+01.404 2 220 53.9 51.8 53.2 53.9 27 2.5 11.0 __ 6 188 450+51.404 2 220 53.2 51.1 53.2 53.2 31 2.0 189 452+01.404 2 220 53.2 48.4 53.2 52.5 33 2.7 3.0 __ 8 190 453+51.404 1 219 53.3 49.2 53.3 5-.8 34 1.0 191 455+01.404 1 219 53.2 49.1 53.3 52.6 34 2.8 0.0 192 456+51.404 1 219 53.2 49.1 53.3 52.6 33 2.7 0.0 Passing Zone__________________________ .,luation) Model for Class· High Volume (Traffic Analysis)
·Traffic flow---~
Increasing Stations---~
Vehicle Flow Rate (vph) : Entering Platoons (%): Percent Trucks (%): Percent RVs (%): Decreasing Stations ---Vehicle Flow Rate (vph) : Entering Platoons (%): Percent Trucks (%): Percent RVs (%):
Generate Entering Platoon % l
RUNNING YOUR MODEL ANALYSIS (7)
Higher Peak Hour and
Projected Traffic Volumes
Entered Into New Model Run
-[Section Smmna1y in the Engineer' Manual]
Table 4 below include the traffic output data table for the main road section. The table reports the actual simulated flo-w rate
percent time spent following average speed trip time traffic dela geometric dela total dela number of passes ehide
distance tra\ eled and vehicle-hours of tra el. These imulation outpu are reported for each direction and both directions
combined.
Table 4. Section Summary
MODEL ANALYSIS – OUTPUT NUMERICAL SUMMARY
(2)
Simulation Output Summar
y
Direction Tran i of Flow Rate from Simulatio n (vph) Penent Time Spent Following 0/o) .-\n.-age Tran i peed (mph) Trip Time (min/ n h Traffic Delay (min/nh) Geometric Delay (min/n h) Total Delay (minfr eh) -umber of Passes Distance Tran led mi) Total Trani Time (nh-hrs) Increasing 1, 4 89 50.4 8.3 1.2 0.2 1.4 1,002 8,547.7 169.7 Decreasing 791 79 5 .1 8.1 1.0 0.- 1. 758 5 537.0 106. Combined _ 015 85 51.1 8 __ 1.1 o __ 1.3 1 760 14084.7 275.9
-Higher Peak Hour = More Passes
MODEL ANALYSIS – OUTPUT NUMERICAL SUMMARY
(NO PASSING LANES AND FUTURE TRAFFIC
VOLUMES)
"Simulation Output Summary
[Section Summa~gineer's Manual]
Table 4 below includes the traffic output data table for the main road section. The table reports the actual simulated flow rate, percent time spent following, average speed, trip time, traffic
1/ehicle-hours of travel. These simulation outputs are reported for each direction and both directions combined.
delay, geometric delay, total delay, number of passes, vehicle-distance traveled, and
Table 4. Section Summary __
Flow Rate from Percent Time Spent Average Travel Trip Time Traffic Delay Geometric Delay Simulation (vph) Following (0/o) Speed (mph) (mln/veh) (mln/veh) (mln/veh)
Total Delay Number of Distance (mln/veh) Passes Traveled (ml)
Total Travel Time (veh-hrs 90 so. 8. 1. 0. 1.5 16 8,584 . 171~ 2,01 8§] 8j] so. 8.3 8.4[ o.2L 0.2[ 1.4 1.5 2 19 5,572 . 14,156. 110.11 281]
..
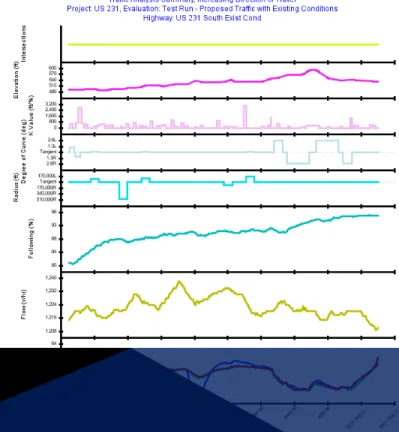
"" E E w { ~Project: US 231, Evaluation: Test Run - Proposed Traffic with Existing Conditions
Highway: US 231 South Exist Cond
_____________
____....,,___ ~ ~ I~ ....J..&..._ ~~...
__
,__....,..,__ ...___________
...,._______
__,-
~
~--1\
'"' T~ ~" ~~ ~ ,... ,, ,..,.,....
.,.,,.,. """"' 510,o'XR l,2HI '"" .. ., .. " .. ....__
,__....,..,__ ...___________
...,._______
__,I raffle Analysis ::;ummary, 1ncreas1no u1rect1on or I ravel
Higher Peak Hour but No Improvements = Few Passes.
MAKING DECISIONS FOR MODEL
Now You Can Run Model with Improvements
•
Follow a consistent naming convention
•
Existing or Future Traffic
•
Existing vs Proposed
•
What kind of Improvements - Added Passing Lanes
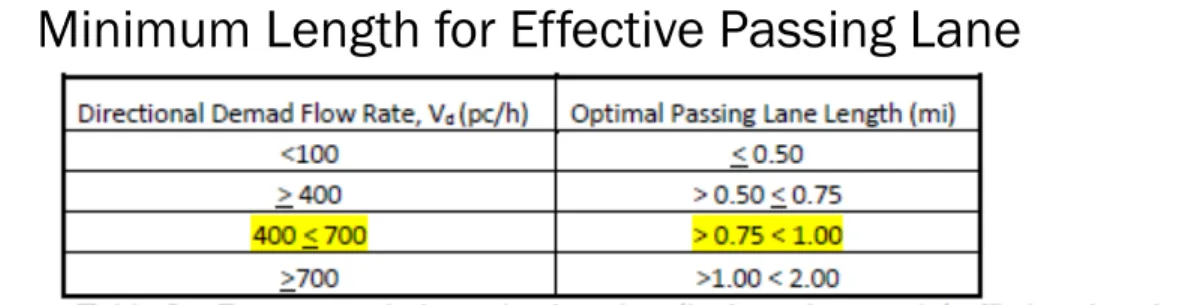
MAKING DECISIONS FOR MODEL (2)
Minimum Length for Effective Passing LaneDirectional Demad Flow Rate, Vu(pc/h) Optimal Passing lane length (mi)
<100 <0.50
>400 > 0.50 < 0.75 400 < 700 > 0.75 < 1.00
>700 >1.00< 2.00
Table 2 - Recommended passing lane lengths based on pea traffic hourty volume.
Level of Service Percent Time Spent Following
LOS % Time Delay Level Terrain ATS PTSF {%}
A .:s._30 ~58 mph ~35 B .:s_ 45 ~55 mph > 35-50 C .:s_ 60 ~52 mph >50-65 D .:s_ 75 ~50 mph >55-80 E >_ 75 ~45 mph >80 F 100 <45 mph
Edit User Pro ect H wa Intersection Ram Termma1 Roundabout lntercha Evaluation Economic Analyses EA Pro eel Economic Analysis Hel 1 ---Ci Project 1 8-Q Project2 •· ~ Highway 1 ('6) i ,-~ Highway 2 (v1) I L .. ~ Highway 3 (v1) ljl Q IHSOM Pike IE-Q Project 3 8Q US231 Ill-~ US 231 South ("5) ID·~ US 231 Center (v4) ~ US 231 North (v4) -~ US 231 South (Copy 1) ('2) -~ US 231 South with Passing Lane (v2)
~ US 231 South with NB& SB Passing Lane (v1) -~ US 231 Center Passing (v1)
· ~ US 231 Center Passing (FGE Recom) (v3)
~ US 231 North INOOT Passing (v1)
8-~ US 231 South Exist Cond (v1) (v1] Evaluation 1 (Crash Prediction)
(v1] Test Run -Proposed Traffic with Existing Conditions (Traffic Analysis)
i®lffi®UI
~ US 231 North INDOT Passing Signal at North End (v1)
~-~ US 231 South with Passing Lane (2041) (v1)
@-~ US 231 South No Passing Ex Lane (2041) (v1)
~ US 231 Center No Passing(2041) (v1)
·~ US 231 Center Passing (2041) (v1)
. -~ US 231 South with NB& SB Passing Lane (2041) (v1)
Evaluation Operations
Re un va
Show Report Show Raw Result
Bookmark ...
" ~ Run (Projttt) US 231 : (Highway) US 231 South Exist Cond Evaluation 3
Select an evaluation type
This wizard will guide you through the process pf running an IHSPM evaluation.
Select the type of evaluation for the current highway:
Crash Prediction Design Consistency Traffic Analysis ~ Description Evaluation bounds
Minimum Location (Sta. ft) :
Title : Evaluation 3
Comment : ]created Mon Mar 09 17:43:56 EDT 2020
169-+85.000 Maximum Location (Sta. fl): Enter the evaluation bounds above or select contiguous evaluation section(s) from table below
Title Area Tvoe Section 2 Urban Section 3 Rural Section 4 Urban Section 5 Rural Evaluation type 0 Policy Review @ Crash Prediction
0 Design Consistency
0 Traffic Analysis
O Dt'NerNehicle
Funclional Class Cateaorv
Arterial Urban/Suburban Alt ..
Arterial Rural, Two Lane
[Arterial Urban/Suburban Alt ..
!Arterial Rural, Two Lane
Start Loe. End Loe. Analvsis
•' " ... .
543+46.800(1) 587+88.500(2) Crash predicti ...
587+88.500(2) 780+76.800(2)AII 780+ 76.800(2) 818+76.800(2) Crash predicti ...
818+76.800(2) 1105+76.800(2) All
543+46.800(1)
MODEL ANALYSIS – CRASH PREDICTION AND
BENEFIT-COST
crash prediction attributes---~!
[
I
i
~
Select the policy, configuration, and evaluation period.
[
''"""
"
"
'
Crash history data can be used to improve the overall crash
prediction from the CPM. To use crash history data check the
box and select the highway that contains the crash history data. The user must identify whether site-specific or whole project
crash history data are used. Only crash history data for the actual
site being analyzed should be used. Crash history data for a similar site are not appropriate. The crash history data should be used only if at least two years of site-specific or whole-project
crash history data for the project being evaluated are available.
[
"
""'"~
Policy for Superelevation : AASHTO 2011 U.S. Customary Calibration : HSM Configuration Crash Distribution : HSM Configuration Model/CMF : HSM Configuration
---
=J
-2020
First Year of Analysis : I
~======================~
Last Year of Analysis : I L_ ____________________________ 2025 ~ Crash History---~
Empirical-Bayes Analysis
@None
0 Site-Specific
0 Whole-Project
Highway with Crash History US 231 South Exist Cond (v_1.;.) ___________________ •■•
I
c
·-···'"··•·
.
,
... "'"""
""
~---Starting Year Ending Year 20151 20191MODEL ANALYSIS – CRASH PREDICTION
INDOT has Calibration files to configure your calculationsHSDM Admini!itration Tool (IHSDM 2019 Release, v15.0.0)
file !;dft li elp
General Intersection Review
I Rebuilg Data Dictionaries I I Rebuild IRM Configuration Data I
Crash Prediction ---~
Calibration Data Sets
---Title Comment Distribution Datal M
Set I
HSM Configuration Default calibration .. HSM Configuration HS~
◄ I:,::::::::::::::::::::::::::::::::::::::::::::::::::::::::::::::::::::::::::::::::::::::: l ► I
Crash Distribution Data Sets
Title I Comment I Last Update I
~ Configuration IDefault crash distri .. J Mar 9, 2020 6:53: ... I
Indiana Con figural... Indiana crash Distr.. Mar 9, 2020 9:32: .
._ ______________ __,Ir
Model Data Sets
Title I Comment Last Update T
-HSM Configuration IDefault model con .. ~ er 9, 2020 6:53: .. ,1
~i an.a Configurat. .. ~ diana SPFs Mar 9, 2020 9:32: ... 1
-...
-j ·-....
-Economic Analysis Model Data Sets
---Title Comment Last Update
Economic Analysi.. Default Economic.. Mar 9, 2020 6:53
□ X
Available Policies
---Policy Title Unit System Last Update
AASHTO 1990 U.S. Customa,y Feb 1, 2007 6:47: ...
AASHTO 1994 Metric AASHTO 2001 U... U.S. Customa,y AASHTO 2001 Me .. Metric AASHTO 2004 U.. U.S. Customa,y AASHTO 2004 Me .. Metric Feb 1, 2007 6:50:. Feb 1, 2007 6:4$ Feb 1, 2007 6:4$:. Feb 1, 2007 6:4$:. Feb 1, 2007 6:49
Traffic Analysis Configuration Data Sets
---Title I Comment
Default 1Default TAM confi..
-Title Comment
Deterministic Aggr .. System default
Deterministic Aggr ... System default
Deterministic Aggr .. System default
Deterministic Aggr .. System default
Deterministic Nom .. System default
T Last Update J Mar 9, 2020 6:53 .. J Last Update Mar 9, 2020 6:53:. Mar 9, 2020 6:53: Mar 9, 2020 6:53:. Mar 9, 2020 6:53:. ... -I::=====:;_
II
l~!=C=Qn=v=e=rt= .. == ii~ IMODEL ANALYSIS – CRASH PREDICTION (2)
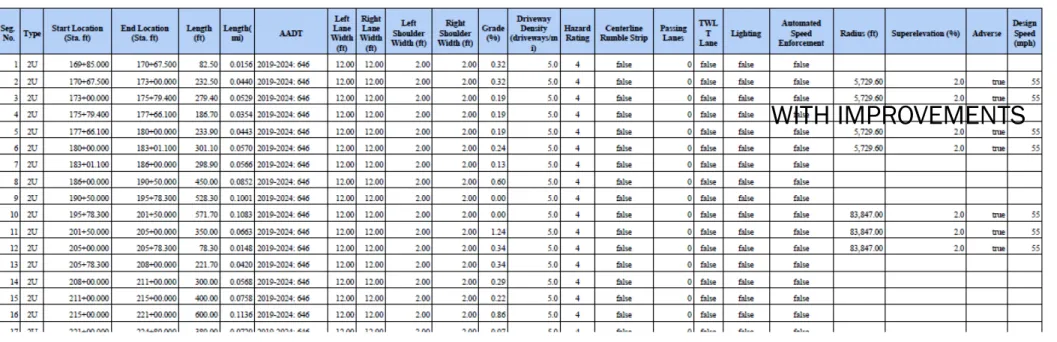
MODEL ANALYSIS – ACCIDENT INPUT DATA
Prediction Evaluation Report Section TYPes
Table 1. Evaluation Highwa -Homogeneou Segments (Section 1) s.g. No. Typo Startl..«aea (SIL fl) EadLoc-(Sia.fl) ~ Lngd,( AADT (ft) •) lAft Rip! r.- l..ut \\'idda (fl) (ti)
"-
lAft Rip! \\.a- -
(ti) \\.a (tl) Godo ('41) Ilriffn y Da,iry c....bo (-....,,.,.--·
lbliag -Sllip i) Pa5'iag Luo, nn. T r.- Lipliag ~ .... Si-I Emrt-Radias(fl) 5-M•lioa ('41) Dlgp Adn<w Si-I (Japll)I 2U 169+85.000 170+67.500 82.50 0.0156 2019-2024: 646 12.<IO 12.00 2.00 2.00 0.32 5.0 4 false 0 false false false
2 2U 170>67.500 17.¼+00.000 m.50 0.0440 2019-2024: 646 12.00 12.00 2.00 2.00 0.32 5.0 4 false 0 false false false 5.729.60 2.0 55
"""
3 2U I 73+-00.000 175+79.-100 279.-IO 0.0529 2019-2024: 646 12.00 12.00 2.00 2.00 0.19 5.0 4 false 0 false false false 5,729.60 2.0 55
"""
4 2U 175+79.400 177~6.IOO 186.70 0.035-1 2019-2024: 646 12.00 12.00 2.00 2.00 0.19 5.0 4 false 0 false false WITH IMPROVEMENTS false
5 2U 177+&5.IOO 180+00.000 233.90 0.0443 2019-2024: 646 12.00 12.00 2.00 2.00 0.19 5.0 4 false 0 false false false 5,729.60 2.0
""" 55
6 2U 180+-00.000 IS.l-+01.100 301.10 0.0570 2019-2024: 646 12.00 12.00 2.00 2.00 0.24 5.0 4 false 0 false false false 5,729.60 2.0
""" 55
7 2U 183-+-01.100 186+00.000 298.90 0.0566 2019-2024: 646 12.00 12.00 2.00 2.00 0.13 5.0 4 false 0 false false false
s 2U I 86+-00.000 190+-50.000 450.00 0.0852 2019-2024: 646 12.00 12.00 2.00 2.00 0.60 5.0 4 false 0 false false false
9 2U 190+50.000 195+78.JOO 52830 0.1001 2019-2024: 646 12.00 12.00 2.00 2.00 0.00 5.0 4 false 0 false false false
10 2U 195+78.300 201+50.000 571.70 0.1083 2019-2024: 646 12.00 12.00 2.00 2.00 0.00 5.0 4 false 0 false false false 83.847.00 2.0
""" 55
II 2U 201+50.000 205+00.000 350.00 0.0663 2019-2024: 646 12.00 12.00 2.00 2.00 1.24 5.0 4 false 0 false false false 83.847.00 2.0
""" ss
12 2U 205+00.000 205+78.JOO 7830 0.0148 2019-2024: 646 12.00 12.00 2.00 2.00 0.34 5.0 4 false 0 false false false 83,~7.00 2.0
""" 55
13 2U 205+78.300 208+-00.000 221.70 0.0420 2019-2024: 646 12.00 12.00 2.00 2.00 0.34 5.0 4 false 0 false false false
14 2U 208+-00.000 211+-00.000 300.00 0.0568 2019-2024: 646 12.00 12.00 2.00 2.00 0.29 5.0 4 false 0 false false false
15 2U 211 +-00.000 215+00.000 400.00 0.0758 2019-2024: 646 12.00 12.00 2.00 2.00 0.22 5.0 4 false 0 false false false
16 2U 215+00.000 221+-00.000 600.00 0.1136 2019-2024: 646 12.00 12.00 2.00 2.00 0.86 5.0 4 false 0 false false false
.,,,
" .,.,,.nr.NV\ 't"tt...0n1VV1 ~on/VI "W'llft"ln"U • .U..C
"""""'
..
,., """ '"" "'" ""' '" A..
,_ ,.,_-MODEL ANALYSIS – PROJECTED ACCIDENTS
(PASSING LANES)
-
le 2. Predicted Highway Crash Rates ancl Frequencie s Summar y (Section 1)First Year of Analysis 2019 Last Year of Analysis 2024 Evaluated Length (mi) 7.0237
AYt'rage Future Road AADT (Ypd) 646 Predicted Crashes
Total Crashes 9.39 Fatal and lnjm1· Crashes 3.01 PropertJ-Damage-Only Crashes 6.37
Percent of Total Predicted Crashes
Percent Fatal and Inju11· Crashes(%) 32 Percent PropertJ-Damage-Only Crashes(%) 68
Predicted Crash Rate
Crash Rate (crashes/mi/yr) 0.2228 FI Crash Rate (crashes/mi/yr) 0.0715 PDO Crash Rate (crashes/mi/yr) 0.1513 Predicted Tra\"t'I Crash Rate
Total Tra\"t'I (million Yt'h-mi) 9.94 Tra\"t'I Crash Rate (crashes/million Yt'h-mi) 0.94 Trnel FI Crash Rate (crashes/million Yt'h-mi) 0.30
Tra\"t'I PDO Crash Rate (crashes/million Yt'h-mi) 0.64
8XI C SIii 0 5"' :; t 510 w
...
;- 12XI e. 2,A(X) ~ ~ ~; ;;.~ i 0 0.
...
.~1
=
0 -~ l7'Q,(IDI~
-i a: 51Q.(XXR e 0.J ] I 02' Ci
02 ., 0.15 ~ ~ (U ~~ 0.J EO ';,,.
; o..2S ~ N 02 ·:; :,: >- 015 ,, ~ . .c ~ 0.1 . .:; ,d',s, .f,s,Crash Prediction Summary, Section 1 (Undivided, Two Lane; Rural; Arterial)
Project: US 231, Evaluation: Crash Analysis
Highway: us 231 South with Passing Lane
.... ~
-,f,s, .,,,s, ,fi',s, -9',s, 11,s, .,,s, .,,s,
MODEL ANALYSIS – PROJECTED ACCIDENTS
(PASSING LANES) (2)
PASSING LANE
MODEL ANALYSIS – PROJECTED ACCIDENTS
(PASSING LANES) (3)
hon Tvp_es Crash Predk hon Ernl11ahon Ree_ort
Segment
:.'llumber/lntersectio
n :.'llame/Cross Road Sran Location (Sia. ft) :End Location (Sra. fr) Length (mi) Toral Pndicred Crashes for :Enluation Period Predicted Tolal Crash Fr·equenc~· (c1·ashe~T) Predicredn Crash Frequenc,· (crashes/~"!') Predicted PDO Crash Frequency (crashe~T) Predicted Crash Rare (crasheslmil~T) Predicted Trani Crash Rare (crasheslmillio nnh-mi) 4 175+79.400 177+66.100 0.0354 0.042 0.0070 0.0022 0.0047 0.1968 0.83 5 177+66.100 180+-00. 000 0.0443 0.065 0.0108 0.0035 0.0073 0.2440 1.03 6 180+-00.000 183+-01.100 0.0570 0.084 0.0139 0.0045 0.0094 0.2440 1.03 7 183+-01.100 186+-00.000 0.0566 0.067 0.0111 0.0036 0.0076 0.1968 0.83 8 186+-00.000 190+50.000 0.0852 0.101 0.0168 0.0054 0.0114 0.1968 0.83 9 190+50.000 195+78.300 0.1001 0.118 0.0197 0.0063 0.0134 0.1968 0.83 10 195+78.300 201+50.000 0.1083 0.144 0.0241 0.0077 0.0163 0.2223 0.94 11 201+50.000 205+-00.000 0.0663 0.088 0.0147 0.0047 0.0100 0.2223 0.94 12 205+00.000 205+78.300 0.0148 0.020 0.0033 0.0011 0.0022 0.2223 0.94 13 205+78.300 208+-00.000 0.0420 0.050 0.0083 0.0027 0.0056 0.1968 0.83 14 208+-00.000 211+-00.000 0.0568 0.067 0.0112 0.0036 0.0076 0.1968 0.83 15 211+-00.000 215+-00.000 0.0758 0.089 0.0149 0.0048 0.0101 0.1968 0.83 16 215+00.000 221+-00.000 0.1136 0.134 0.0224 0.0072 0.0152 0.1968 0.83 17 221+-00.000 224+80.000 0.0720 0.085 0.0142 0.0045 0.0096 0.1968 0.83 18 224+80.000 230+09.500 0.1003 0.144 0.0240 0.0077 0.0163 0.2392 1.01 19 230+09.500 233+50.000 0.0645 0.104 0.0174 0.0056 0.0118 0.2694 1.14 20 233+50.000 239+50.000 0.1136 0.184 0.0306 0.0098 0.0208 0.2694 1.14 21 239+50.000 240+09.500 0.0113 0.018 0.0030 0.0010 0.0021 0.2694 1.14 22 240+09.500 249+00.000 0.1687 0.242 0.0403 0.0129 0.0274 0.2392 1.01 23 249+00.000 2 56+-00. 000 0.1326 0.190 0.0317 0.0102 0.0215 0.2392 1.01 24 256+-00.000 256+77.800 0.0147 0.021 0.0035 0.0011 0.0024 0.2392 1.01