18
© Global Society of Scientific Research and Researchers http://asrjetsjournal.org/
Use of the Three-parameter Burr XII Distribution for
Modelling Ambient Daily Maximum Nitrogen Dioxide
Concentrations in the Gaborone Fire Brigade
Wilson Moseki Thupeng*
Department of Statistics, University of Botswana, Private Bag 00705, Gaborone, Botswana Email: [email protected]
Abstract
Air pollution constitutes one of the major problems in urban areas where many sources of airborne pollutants are concentrated. Identifying an appropriate probability model to describe the stochastic behaviour of extreme ambient air pollution level for a specific site or multiple sites forms an integral part of environmental management and pollution control. This paper proposes the use of the three-parameter Burr Type XII distribution to model maximum levels of nitrogen dioxide at a specific site. The study focuses on the daily maximum ambient nitrogen dioxide concentrations for Gaborone Fire Brigade in the winter season, May-July, 2014. The fit of the parameter Burr Type XII is compared to that of the parameter Dagum and three-parameter log-logistic by using the Kolmogorov-Smirnov and Anderson-Darling criterion for model selection. It is found that the three-parameter Burr Type XII gives the best fit, followed by the log-logistic and the Dagum I, in that order. The results justify the use of the three-parameter Burr Type XII to model ambient air pollution extreme values.
Keywords: pollution; nitrogen dioxide; Burr Type XII; Dagum; log-logistic; maximum likelihood estimate.
1. Introduction
Air pollution constitutes one of the major problems in urban areas where many sources of airborne pollutants are concentrated ([1]). The extent of the impact of air pollution on human health has been a subject of extended research in the last decade or so [1, 2, 3, 4].
--- * Corresponding author.
19
According to [1] special attention is given to traffic pollutants since high pollutant concentrations observed in urban areas are mainly attributed to traffic. Since road traffic is the main emission source of nitrogen oxides (NOx), in urban conurbations (e.g., [5]), NOx concentrations are often used as a tracer of road traffic emissions
at monitoring sites located in urban areas [6] The nitrogen oxides (NOx) in the ambient air consist primarily of
nitric acid and nitrogen dioxide (NO2) ( i.e., NOx=NO+NO2). NOx gases react to form smog and acid rain and
are central to the formation of fine particles (particulate matter) and ground level ozone, both of which are known to be associated with adverse health effects on humans and the environment. As a result, governments and environmental protection organisations like the United States EnvironmentalProtection Agency (US EPA) are required to set Ambient Air Quality Standards for pollutants considered harmful to public health and the environment. The nitrogen oxides NOx) constitute one of the six common air pollutants for which US EPA is
required to set air quality standards by the clean Air Act [7]. And, according to [7], of the various nitrogen oxides, nitrogen dioxide (NO2) is the component of “greatest interest” and is used as an indicator of the entire
group of NOx. This is because of its adverse effects on human health. Persons suffering from respiratory
diseases, such as asthma, are very sensitive to NO2 at high concentrations, while several risk assessment studies
have shown that both short-term and long-term exposure to NO2 can induce effects to the human health and that,
given the role of NO2 as a precursor of other pollutants and as a maker of traffic-related pollution, there should
be benefits for the public health from keeping low NO2 levels in the atmospheric air [8, 9). This conclusion is
further supported by [10], which states that short-term NO2 exposures have been shown to cause adverse
respiratory effects such as increased asthma symptoms.
In Botswana, monitoring of nitrogen dioxide by the Department of Waste Management and Pollution Control (DWMPC) is ongoing at a number of monitoring sites in Botswana. Whilst a number of studies on the effects of nitrogen dioxide on health human have been carried out, the available literature does not show if there has been any systematic study on the determination of the most suitable probability distribution for modelling concentrations of nitrogen dioxide, or any of the other 5 criteria pollutants. Therefore, the present study focuses on the modelling of nitrogen dioxide concentrations at the Gaborone Fire Brigade as a case study.
In order to understand the impacts of various air pollutants, mathematical models are commonly used to predict the temporal and spatial distributions of air pollutants in urban areas. See [11] and references therein. According the authors, three different approaches have been established for modelling air quality data: deterministic modelling (analytical and numerical models), statistical modelling and physical modelling. The choice of the modelling approach is mainly guided by the purpose of modelling: long-term planning, short-term forecasts and episode warning system. As an example, [11] observe that deterministic models have been reported to perform unsatisfactory for air pollution critical episodes characterised typically by fast dynamics and inherent uncertainty associated with turbulent flow and, that on account of these complexities, the statistical methods offer an alternative approach to analyse extreme air pollution phenomenon. Naturally, air pollution levels are of greatest interest when they are large, that is, when the data are heavy-tailed. The importance of accurately modelling extreme events has intensified, particularly in environmental science where such events can be seen as a barometer for climate change [12]. Furthermore, the selection of an appropriate probability distribution is of prime importance in frequency analysis of extreme events [13]. And, as pointed out by [14], for heavy-tailed data, more statistically flexible distributions are needed to model the outcome’s tail characteristics, which are in
20
many cases of primary interest of the researcher. There are several approaches suggested in the statistical literature to deal with the skewness exhibited by such data. [14] discusses the approaches and states that a fourth approach is to use more flexible positive random variable distributions with three or four parameters such as the Pearson distribution family’s three-parameter generalized gamma distribution and four-parameter generalized beta 2 distribution, or the Burr family’s three-parameter Burr distribution. These more flexible models have been increasingly widely used in the literature of econometrics as well as survival analysis [14]. It is within the context of this approach that the present paper proposes the use of the three-parameter Burr Type XII (hereafter referred to as the Burr XII) distribution to model the daily maximum concentrations of ambient nitrogen dioxide at a specific location.
The Burr XII distribution was first introduced by [15]. The distribution has been applied frequently in areas of quality control, reliability analysis and failure time modelling [16]. Although it appears the Burr XII is relatively unknown in environmental studies, it is particularly appealing for several reasons. First, its range covers positive values only, which is convenient when modeling hydrological or meteorological data. Secondly, it has two shape parameters, allowing it to be quite adaptable to different samples because it covers a wide range of skewness and kurtosis values [17]. Due to different values of its parameters covering a broad set of skewness and kurtosis, the Burr distribution can fit a wide range of empirical data in various fields such as hydrology, meteorology and finance [13]. Thirdly, the Burr XII family is quite rich and includes a number of submodels, like the log-logistic distribution, that are very common distributions in fitting pollutant concentration data. Thus, the Burr XII distribution has desirable features and seems to be a promising distribution for modelling environmental pollution data, which are frequently skewed to the right, that is, have a long tail towards high concentrations. In this paper, use of the three-parameter Burr Type XII distribution is proposed for modelling the daily maximum concentrations of ambient nitrogen dioxide at a specific site. For purposes of comparison, we also consider two other continuous heavy-tailed probability distributions related to the Burr XII, namely, the three-parameter Dagum distribution and the three-parameter log-logistic distribution. The performance of the distributions is ranked by using the Kolmogorov-Smirnov and Anderson-Darling tests.
The Dagum has been used by economists as a distribution for modelling country incomes because of its property of having a heavy right tail [18]. In the present work, the Dagum distribution is considered for two reasons. First, The Dagum distribution is a special case of the "Kappa distributions" [19] that have been applied to precipitation and streamflow data [20]. Still within the framework of environmental data modelling, [21] used the three-parameter Kappa distribution to model the amount of rainfall precipitation. More recently, [18] use the Dagum distribution to model extreme values in ozone levels and conclude, amongst others, that the Dagum distribution is an appealing option for modelling extreme events when using maximum likelihood estimators (MLEs) since it does not have the distributional problems associated with the MLEs (maximum likelihood estimates) in the Generalized extreme value (GEV) model. Secondly, a close examination of the cumulative distribution of the Dagum distribution shows that the Dagum is just the three-parameter Burr III, which is the reciprocal of the three-parameter Burr XII via the transformation 𝑌𝑌=1
𝑋𝑋. And, according to [22] the three-parameter Burr III is another widely used Burr type distribution. The log-logistic distribution is included in the present investigation since it is a special case of both the Burr's Type XII distributions and the Dagum
21
distribution (see [23]). More particularly, the log-logistic distribution is a special case of the three-parameter Burr XII. The reader is referred to [24] and [22, 25] for further details on the Burr and its related distributions.
In this paper, use of the three-parameter Burr Type XII distribution is proposed for modelling the daily maximum concentrations of ambient nitrogen dioxide at a specific site by applying the model to the daily maximum concentrations of ambient nitrogen dioxide in the Gaborone Fire Brigade. The overall objective of the study is to provide environmental analysts and practitioners with more options in selecting appropriate probability models for environmental pollutant data, which is an important step in environmental data analysis.
The rest of the paper is organised as follows. Section 2 gives a description of the site and data used for the investigation and a brief review of the probability distributions considered. In Section3, the results of a procedural implementation of the methodology are elaborated with particular reference to important details shown in the tables and figures. Sections 4 and 5 give the discussion and conclusions of the study, respectively.
2. Materials and Methods
2.1 Data and Site Description
As mentioned earlier, road traffic is the main emission source of nitrogen oxides. In the City of Gaborone, Botswana’s capital, one of the monitoring sites for the nitrogen dioxide is the Gaborone Fire Brigade. The site is located in the high motor vehicle traffic near the main bus and taxi station and the rail station, where the amount of nitrogen oxides emitted into the atmosphere as air pollution can be quite high. The monitoring station was chosen for this reason and for the fact that the data availability for the months of May through July, 2014, was 100% and reliable.
The data used for the study consist of 92 daily maximum 30-minute average nitrogen dioxide concentrations, expressed in parts per billion (ppb), for the Gaborone fire Brigade station for the period May 01 to July 31, 2014. These data were obtained from the Department of Waste Management and Pollution Control (DWMPC), Ministry of Environment Wildlife and Tourism, Botswana. Datasets from the DWMPC are considered to be of high quality, with no long periods of missing values. In the present paper, we focusing on one season, winter, in order to control for the seasonal effect and, hence, minimise possible nonstationarity of the series. Also, the source of the data could not avail to us data for the whole year of 2014 or for the past years.
2.2 Probability Models
2.2.1 Burr XII distribution
Let X be a positive random variable. The three-parameter Burr XII distribution for X is defined by the cumulative distribution function
𝐹𝐹𝐵𝐵𝑋𝑋𝐵𝐵𝐵𝐵(𝑥𝑥; ∝,𝛽𝛽,𝜏𝜏) = 1− �1 +�𝑥𝑥𝛽𝛽� 𝛼𝛼
22
and probability density function𝑓𝑓𝐵𝐵𝑋𝑋𝐵𝐵𝐵𝐵(𝑥𝑥; 𝛼𝛼,𝛽𝛽,𝜏𝜏) =𝛼𝛼𝜏𝜏𝛽𝛽 �𝛽𝛽�𝑥𝑥 𝛼𝛼−1
�1 +�𝑥𝑥𝛽𝛽�𝛼𝛼�−
(𝜏𝜏+1)
; 𝑥𝑥 > 0 (2)
where 𝛽𝛽> 0 is the scale parameter, ∝ > 0 is a continuous shape parameter and 𝜏𝜏> 0 is a continuous shape parameter. See Burr (1942). For simplicity, we will from now on just call the three-parameter Burr XII as the Burr XII.
2.2.2 Dagum distribution
The most general form of the Dagum distribution has the cumulative distribution function
𝐹𝐹𝐷𝐷𝐷𝐷𝐷𝐷(𝑥𝑥;𝛼𝛼,𝛽𝛽,𝛾𝛾,𝜏𝜏) =𝛿𝛿+ (1− 𝛿𝛿)�1 +�𝑥𝑥𝛽𝛽� −𝛼𝛼
�−𝜏𝜏; 𝑥𝑥 > 0 (3)
The Dagum distributions of Type I, II and III correspond to cases where 𝛿𝛿= 0, 0 <𝛿𝛿< 1 and 𝛿𝛿< 0, respectively [18] In this paper, following the work of [18] who use the Dagum distribution to model daily maximum ozone levels (in ppm) for Pedregal monitoring station in Mexico City, we employ the Dagum Type I (hereafter referred to as the Dagum I distribution). In Equation (3), setting 𝛿𝛿= 0 yields the cumulative distribution function of the Dagum I as
𝐹𝐹𝐷𝐷𝐷𝐷𝐷𝐷𝐵𝐵(𝑥𝑥;𝛼𝛼,𝛽𝛽,𝜏𝜏) =�1 +�𝑥𝑥𝛽𝛽� −𝛼𝛼
�−𝜏𝜏,𝑥𝑥 > 0,𝛼𝛼,𝛽𝛽,𝜏𝜏 > 0 (4)
where 𝛼𝛼 and 𝜏𝜏 are the shape parameters while 𝛽𝛽 is the scale parameter. The corresponding density of the Dagum I is given by Equation (5) as 𝑓𝑓𝐷𝐷𝐷𝐷𝐷𝐷𝐵𝐵(𝑥𝑥;𝛼𝛼,𝛽𝛽,𝜏𝜏) = 𝛼𝛼𝜏𝜏 �𝑥𝑥𝛽𝛽� 𝛼𝛼𝜏𝜏−1 𝛽𝛽 �1 +�𝑥𝑥𝛽𝛽�𝛼𝛼�𝜏𝜏+1 ,𝑥𝑥 > 0,𝛼𝛼,𝛽𝛽,𝜏𝜏 > 0 (5) 2.2.3 Log-logistic distribution
The log-logistic distribution is obtained by applying the logarithmic transformation to the logistic distribution. There are several different parameterizations of the log-logistic distribution. The one employed in this paper is used by [26, 27]. The parameterization gives reasonably interpretable parameters and a simple form for the cumulative distribution.
A random X has a three-parameter log-logistic distribution with cumulative distribution function and the probability density function expressed, respectively, as in Equations (6) and (7)
23
𝐹𝐹𝐿𝐿𝐿𝐿3(𝑥𝑥; 𝛼𝛼,𝛽𝛽,𝛾𝛾 ) =�1 +�𝑥𝑥 − 𝛾𝛾𝛽𝛽 � −∝ �−1,∝ > 0,𝛽𝛽> 0,𝛾𝛾 ≤ 𝑥𝑥<∞ (6) 𝑓𝑓𝐿𝐿𝐿𝐿3(𝑥𝑥; 𝛼𝛼,𝛽𝛽,𝛾𝛾 ) =∝𝛽𝛽 �𝑥𝑥 − 𝛾𝛾𝛽𝛽 � 𝛼𝛼−1 �1 +�𝑥𝑥 − 𝛾𝛾𝛽𝛽 �∝�−2,∝ > 0,𝛽𝛽> 0, 𝛾𝛾 ≤ 𝑥𝑥<∞ (7)where ∝ is a continuous shape parameter and 𝛽𝛽 is a continuous scale parameter.
To estimate parameters of the candidate probability distributions, various methods have been extensively used: maximum likelihood method, method of moments, method of L-moments, probability weighted method and least squares method. In this paper, we employ the widely used maximum likelihood estimation method to calculate the parameter estimates for the three models under study with the statistical computer package EasyFit.
2.3 Goodness-of-fit criteria
Assessing the goodness-of-fit of a model is one of the key steps in a statistical modelling of any dataset. In the present study, the goodness-of-fit of each one of the candidate models is evaluated by using diagnostic plots (cdf plot and q-q plots) and two formal tests: the Kolmogorov-Smirnov, Anderson-Darling. Besides assessing the goodness-of-fit of each candidate model, the tests are used to rank the performance of the distributions to determine which model best fits the data. The Anderson-Darling test serves as the primary criterion for both model testing and selection since it places more weight in the tails of a distribution. The Kolmogorov-Smirnov test is used to confirm the plausibility of a selected model.
Both the Anderson-Darling and the Kolmogorov-Smirnov test are Empirical Distribution Function (EDF) tests since they measure the discrepancy between the empirical distribution function 𝐹𝐹𝑛𝑛(𝑥𝑥), derived from a sample of size n, and the tested cumulative distribution function 𝐹𝐹0(𝑥𝑥), whose parameters may be known or unknown. Let X be a continuous random variable with distribution function F(x), and 𝑋𝑋1,𝑋𝑋2,⋯,𝑋𝑋𝑛𝑛 be a random sample from X. Denote by 𝑥𝑥(1)≤ 𝑥𝑥(2)≤ ⋯ ≤ 𝑥𝑥( 𝑛𝑛) a sample of n ordered observations from independent and identically distributed random variables 𝑋𝑋1,𝑋𝑋2,⋯,𝑋𝑋𝑛𝑛. We wish to test the null hypothesis 𝐻𝐻0:𝐹𝐹(𝑥𝑥) =𝐹𝐹0(𝑥𝑥) against the general alternative 𝐻𝐻1:𝐹𝐹(𝑥𝑥)≠ 𝐹𝐹0(𝑥𝑥) for 𝑥𝑥 ∈ ℝ.
The test statistic for the Kolmogorov-Smirnov test is
𝐷𝐷= 𝑠𝑠𝑠𝑠𝑠𝑠
−∞<𝑥𝑥<∞|𝐹𝐹𝑛𝑛(𝑥𝑥)− 𝐹𝐹0(𝑥𝑥)|
where the 𝐹𝐹𝑛𝑛(𝑥𝑥) is the empirical distribution function and 𝐹𝐹0(𝑥𝑥) is the fitted distribution function with parameters estimated by the maximum likelihood method.
To apply the Anderson-Darling testt, we note that in most cases only one of the tails is important (maximum for environmental or insurance data and minimum for financial time series or reliability) See [28]. According to the author in [28], for the maximum case, the Anderson-Darling statistic is calculated using the formula
24
𝐴𝐴2=𝑛𝑛⁄ −2 ∑𝑛𝑛𝑖𝑖=1(2𝑖𝑖 −1)𝑙𝑙𝑙𝑙𝑙𝑙(1− 𝑧𝑧𝑛𝑛+1−𝑖𝑖) 𝑛𝑛 − � 𝑧𝑧𝑖𝑖 𝑛𝑛 𝑖𝑖=1 /𝑛𝑛where 𝑧𝑧𝑖𝑖=𝐹𝐹0(𝑥𝑥(𝑖𝑖)), the fitted distribution function evaluated at the ith element of the ordered sample of size n. In ranking the models, the model that gives the best fit to the data is the one with the smallest value of the test statistic under consideration.
3. Results
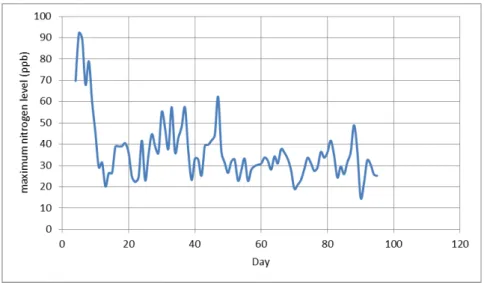
A time series plot for the block daily maximum nitrogen dioxide concentrations (in ppb) for the Gaborone Fire Brigade is shown in Figure 1.
The main interesting point to note about these data is that the largest daily maximum value of 92.081 ppb indicates compliance with the World Health Organization’s ambient air quality standard of 106 ppb for 1-hour mean (see [29]).
The present guideline was set to protect the public from health effects of the gas NO2 itself [29.]. Also, the plot
shows a weak trend towards lower peak levels of daily maximum NO2 levels over the three winter months,
suggesting that the series is not stationary. However, the effect of nonstationarity have been minimised by focusing the study on only one season to control for the effects of meteorological conditions as months in one season are likely to have similar meteorological conditions.
Figure 1: Daily maximum nitrogen dioxide (ppb) for Gaborone Fire Brigade, May-July 2014
3.1. Descriptive statistics
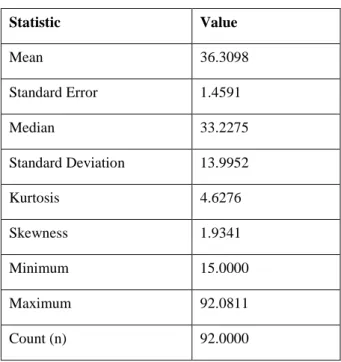
As mentioned before, this study focuses on the daily maximum ambient nitrogen dioxide concentrations for Gaborone Fire Brigade in the winter season, May-July, 2014. Table.3.1 contains the main summary statistics for the data.
25
Table 3.1: Basic descriptive statistics for daily maximum ambient nitrogen dioxide concentrations for Gaborone Fire Brigade, May-July, 2014
Statistic Value Mean 36.3098 Standard Error 1.4591 Median 33.2275 Standard Deviation 13.9952 Kurtosis 4.6276 Skewness 1.9341 Minimum 15.0000 Maximum 92.0811 Count (n) 92.0000
Clearly, from Table 3.1 we see that the coefficient of skewness is positive (1.9341), which indicates that the daily maximum ambient nitrogen dioxide concentrations for Gaborone Fire Brigade have an asymmetrical distribution and that the positive skewness is substantial.
Furthermore, the coefficient of kurtosis (4.6276) for the data is positive and much larger than zero (the value of the coefficient of kurtosis for a Gaussian distribution), showing that the distribution of the data is too sharply peaked for the Gaussian distribution to fit.
These observations are further supported by the shape of the histogram for the data (Figure 2a), which shows that the data are positively skewed.
Also, the minimum value of 15 ppb in Table.3.1 shows that the data would best be modelled by a probability distribution with a positive support.
3.2 Parameter estimates
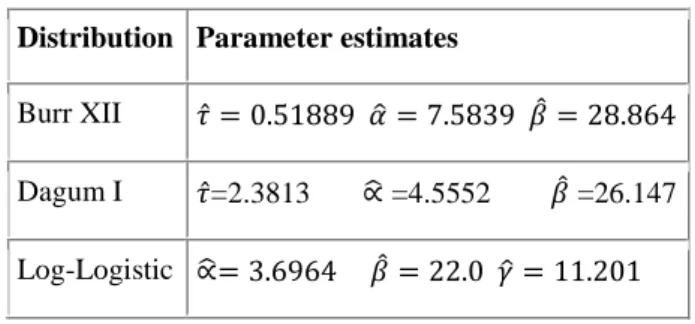
The estimated parameter values for the three-parameter Burr XII distribution, the three-parameter Dagum I and three-parameter log-logistic distributions have been recorded in Table 3.2.
These estimates are used to construct the diagnostic plots and calculate the Kolmogorov-Smirnov and Anderson-Darling test statistics used to assess the fit of the models under consideration.
26
Table 3.2: Parameter estimates for the Burr XII, Dagum I and Log-logistic distributions based on maximum likelihood method
Distribution Parameter estimates
Burr XII 𝜏𝜏̂= 0.51889 𝛼𝛼�= 7.5839 𝛽𝛽̂= 28.864 Dagum I 𝜏𝜏̂=2.3813 ∝� =4.5552 𝛽𝛽̂ =26.147 Log-Logistic ∝�= 3.6964 𝛽𝛽̂= 22.0 𝛾𝛾�= 11.201
3.3 Model assessment
The diagnostic plots for assessing the fit of the models are contained in Figures 2a - 4. Figures 2a shows the histogram for the data with the density of the Burr XII (𝜏𝜏̂= 0.51889 𝛼𝛼�= 7.5839 𝛽𝛽̂= 28.864) superimposed on it. The probability density plot indicates that the three-parameter Burr XII model gives a very good fit to the daily minimum nitrogen dioxide concentrations for the Gaborone Fire Brigade. This is strongly supported by the cumulative distribution (CDF) plot of the Burr XII distribution shown in Figure 2b. The probability density plots and the CDF plots for the Dagum I and log-logistic models, not included here for lack of space, indicated that the two models also give very good fit to the data.
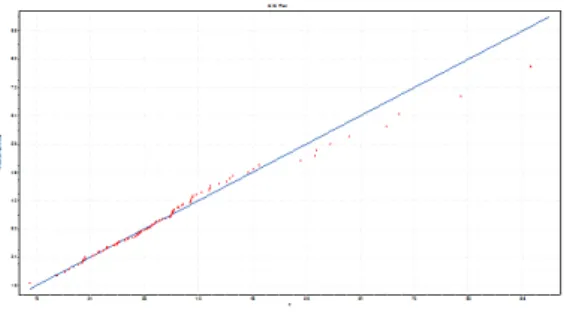
The fit of a statistical model to a specified random sample 𝑋𝑋1,𝑋𝑋2,⋯,𝑋𝑋𝑛𝑛, can also be assessed by visual inspection of a quantile-quantile (Q-Q) plot. If the proposed reference distribution gives a goof fit, ordered data which serve as empirical quantiles are expected to be in line with their expected values under the reference model. And, for maximal extremes, departure from linearity in the highest observations indicates poor fit. Figures 2c, 3 and 4 show the Q-Q plots of the Burr XII, Dagum I and log-logistic models for the Gaborone Fire Brigade daily maximum NO2 concentrations, May-July, 2014. A visual inspection of the plots shows that each one of the three models gives a reasonably good fit to the data. A closer examination of the three Q-Q plots, however, shows that for the three parameter Burr XII (Figure 2c), the empirical and estimated quantiles are closest to the 45 degree line than is the case with the Dagum and the log-logistic models. Also, by visual inspection, Figure 3 and Figure 4 seem to indicate that the log-logistic model gives a better fit than the Dagum I, though the difference is marginal.
To formally assess the goodness-of-fit of the models and perform model selection, we use the Kolmogorov-Smirnov and Anderson-Darling tests, with the resulting test statistics values recorded in Table 3.3. In Table 3.3, the observed values of the Kolmogorov-Smirnov statistic for the Burr, the Dagum I and log-logistic models s are smaller than their respective critical values. These show that all the three models can satisfactorily be used to model the daily winter maximum nitrogen dioxide concentrations at the Gaborone Fire brigade. Moreover, both the Kolmogorov-Smirnov and Anderson-Darling tests rank the three-parameter Burr XII, three-parameter log-logistic and three-parameter Dagum I models at 1, 2 and 3, respectively.
27
Figure 2a: Histogram and the Burr XII density (in red) of Fire Brigade daily maximum NO2 concentrations
Figure 2b: Burr XII CDF plot for -Gaborone Fire Brigade daily maximum NO2 concentrations
28
Figure 3: Q-Q plot of Dagum I fit to the Gaborone Fire Brigade daily maximum NO2 concentrations
Figure 4: Q-Q plot of log-logistic fit to the Gaborone Fire Brigade daily maximum NO2 concentrations
Table 3.3: Ranking the fit of the three-parameter Burr, Dagum and Log-logistic distributions by Kolmogorov-Smirnov and Anderson-Darling statistics
Distribution
Kolmogorov Smirnov Anderson Darling Statistic Rank Statistic Rank
Burr 0.04559 1 0.21172 1
Log-Logistic (3P) 0.05078 2 0.25442 2
Dagum 0.05492 3 0.26939 3
4. Discussion
As indicated in Section 3.1 of this paper, the results of the present study, with a positive coefficient of skewness clearly indicate that the daily maximum ambient nitrogen dioxide concentrations for Gaborone Fire Brigade are positively skewed. This result is consistent with the nature of environmental pollution data- they are frequently skewed to the right, that is, have a long tail towards high concentrations. The basic descriptive statistics also show that for this dated, the smallest observation of 15 ppb is much larger than zero. This is also to be expected of environmental pollution data and makes the data amenable to be modeled by probability distributions with a positive support.
29
The results further show that the three-parameter Burr Type XII distribution and its special cases of the Dagum I (Burr Type III or Inverse Burr XII) and log-logistic are promising as models for modelling environmental pollution data, especially ambient air pollution levels. The three-parameter Burr Type XII gives the best fit, followed by the log-logistic and the Dagum, I in that order. For further comparison purposes, we also fit the GEV distribution, the most popular model for block maxima data, to the daily maximum ambient nitrogen dioxide concentrations data for the Gaborone Fire Brigade. The results are not reported here but, the GEV distribution does not give the best fit to the data. Actually, the GEV model is ranked number 4 by both the Kolmogorov-Smirnov and Anderson-Darling test criteria. This result seems to support [18], who use the Dagum distribution to model extreme values in ozone levels and conclude, amongst others, that the Dagum distribution is an appealing option for modelling extreme events when using maximum likelihood estimators (MLEs) since it does not have the distributional problems associated with the MLEs in the generalized extreme value model.
The main limitation of this study is that the series available for analysis is for a short period of the three winter months of only one year, 2014. This is because the availability of air pollution data is very limited in Botswana’s statistical system. There are several reasons for this: the number of monitoring weather stations is insufficient; the distribution of existing stations is also uneven, with most stations located in cities and towns along major roads; where station records exist, data quality and access is often lacking and records can suffer from gaps in space and time. The author, therefore, would like to caution the reader that trend detection using extreme value analysis requires long-term and reliable data as currently observed trends may not persist in the future. As a result, great care must be exercised in extrapolating historical trends into the future, more particularly when making long-term projections of extremes whose levels are influenced by weather and climatic conditions, as these may be affected by very different natural and anthropogenic causes than historical events. For instance, in urban areas, climate change is likely to influence outdoor air pollution levels because the generation and dispersion of air pollutants depend, partly, on local patterns of temperature, precipitation, wind direction and speed, and solar radiation. Hence, further studies involving larger data sets are necessary to identify trends in extreme nitrogen dioxide levels in Botswana’s urban areas and their timing, as well as possible links to climate change.
5. Conclusions
The results of the present study lead to the following conclusions, when using the maximum likelihood estimators:
• Based on the Kolmogorov-Smirnov and Anderson-Darling test criteria, the three-parameter Burr Type XII gives the best fit to the daily maximum ambient nitrogen dioxide concentrations data for the Gaborone Fire Brigade.
• The three-parameter log-logistic and the three-parameter Dagum, in that order, provide appealing alternative options for modelling ambient air pollution extremes.
• Overall, these results justify the use of the three-parameter Burr Type XII distribution to model environmental extreme values.
30
station during the period under study indicates that the Gaborone Fire Brigade is compliant with the World Health Organization’s ambient air quality standard of 106 ppb for 1-hour mean, a guideline which was set to protect the public from the negative health effects of the gas.
6. Recommendations
• Statistical modelling of extreme air pollution concentrations should be used to inform air quality management and standard setting. Air quality standards are an important instrument of risk management and environmental policies, as violations of the standards could pose great risks to public health. The results of the present study recommend the use of the three-parameter Burr Type XII distribution as a strong candidate for statistical modelling of pollution extremal data.
• Botswana’s statistical system, especially Statistics Botswana, must make more efforts to improve the availability and accessibility of reliable air pollution data at the local and national levels that can be used to effectively monitor air pollution levels and protect the public health of the country’s citizens. • More air quality monitoring stations must be established in the different urban areas in the country,
where traffic volumes could significantly contribute to local air pollution by NO2 concentrations during
peak traffic hours.
• In order to reduce the amount of traffic-related pollutants produced, the Government of Botswana must put in place a regulatory framework to implement the vehicle emission standard BOS 134:2005 that has been developed to make it mandatory.
• The Government must also implement the Botswana National Fuel Quality Monitoring Programme to make sure that the products (diesel, petrol and paraffin) supplied within the Botswana market are of good quality and comply with fuel specifications set for the country.
Citation and references
[1] A. Chaloulakou and I. Mavroidis I. “Compliance with the annual NO2 air quality standard in Athens.
Required NOx levels and expected health implications”. Atmospheric Environment 42, pp. 454-465,
2008.
[2] L. Curtis, W. Rea, P. Smith-Willis, E. Fenyves and Y. Pan. “Adverse health effects of outdoor air pollutants”. Environment International 32, pp. 815-830, 2006
[3] S.T. Holgate, J.M. Samuel, H.S. Koren and R.L. Maynard. “Air pollution and Health”. Academic Press, New York, 1999.
[4] R. Maynard. “Key airborne pollutants – the impact on health”. Science of the Total Environment 334/335, pp. 9-13, 2004.
[5] R.N., Colvile, E.J. Hutchinson, J.S. Meindell and R.F. Warren. “The transport sector as a source of air pollution”. Atmospheric Environment 35, 1537-1565, 2001.
[6] M. Lewne, J. Cyrys, K. Meliefste, G. Hoek, M. Brauer, P. Fischer, U. Gehring, J. Heinrich, B. Brunekreef and T. Bellander. “Spatial variation in nitrogen dioxide in three European areas”. Science of the Total Environment 332, pp. 217-230, 2004.
31
CONDITIONAL DENSITY GIVEN LARGE OBSERVED VALUES VIA A MULTIVARIATE EXTREMES FRAMEWORK, WITH APPLICATION TO ENVIRONMENTAL DATA”. The Annals of Applied Statistics 2012, vol. 6, No. 4, pp. 1406-1429, 2012 [Jan. 8, 2013].
[8] European Commission. “Position paper on air quality: nitrogen dioxide”, in Working Group on Nitrogen Dioxide, EC, 1997.
[9] WHO (World health Organisation).”Health aspects of air pollution with particulate matter, ozone and nitrogen dioxide”, in Report on a WHO Working Group. Bonn, Germany, pp. 13-15, January 2003. [10]EPA Fact sheet. “Final Revisions to the national ambient air quality standards for nitrogen dioxide”.
Internet: http://www.epa.gov/air/nitrogendioxides/pdfs/20100122fs.pdf, 2010 [Apr. 20, 2015].
[11]Sharma Pragati, Avinash Chandra, S.C. Kaushik, Prateek Sharma and Suresh Jain. “Predicting violations of national ambient air quality standard using extreme value theory for Delhi city”. Atmospheric Pollution Research 3(2012), pp. 170-179, 2012.
[12]Eric Gilleland, Mthieu Ribatet and Alec G. Stephenson. “A software review for extreme value analysis”. Extremes (2013) 16, pp. 103-119, doi: 10.1007/s10687-012-0155-0, 2012.
[13]Zhanling Li, Zhanjie Li, Wei Zhao and Yuehua Wang. “Probability Modeling of Precipitation Extremes over Two River Basins in Northwest of China”. Hindawi Publishing Corporation. Advances in Meteorology, vol. 2015, Article ID 374127, pp. 2-13, Nov. 2015.
[14]Jiafeng Sun. “Heavy-Tailed Longitudinal Data Modelling Using Copulas”. PhD thesis, University of Wisconsin-Madison, 2008.
[15]I.W. Burr. “Cumulative frequency functions”. Annals of Mathematical Statistics 13 (2), pp. 215-232, doi: 10.1214/aoms/1177731607, JSTOR 2235756, 1942.
[16]B. Abbasi, S.Z. Hosseinifard and D.W. Coit. “A neural network applied to estimate Burr XII distribution parameters”. Reliability Engineering and System Safety 95, pp. 647-654, 2010.
[17]D. Ganora, and F. Laio. “Hydrological Applications of the Burr Distribution: Practical Method for Parameter Estimation”. Journal of Hydrological Engineering, vol. 20, issue 11, 10. 1061/(ASCE) HE. 1943-5584.0001203, 04015024, Nov. 2015.
[18]Sexto M., Benjamin, Humberto Vaquera H. and Barry C. Arnold. “Use of the Dagum Distribution for Modelling Tropospheric Ozone levels”. Journal of Environmental Statistics, vol. 5, Issue 5, pp. 1-11, Aug. 2013.
[19]W. Jr. Mielke and E.S. Johnson. “Three-parameter kappa distribution: maximum likelihood estimates and likelihood ratio tests”. Monthly Weather Review 101, pp. 701-709, 1973.
[20]V.P. Singh, H. Guo and F.X. Yu. ”Parameter estimation for 3-parameter log-logistic distribution (LLD3) by Pome”. Stochastic Hydrol. Hydraul. 7, pp. 163-177, 1993.
[21]W. Jr. Mielke. “Another family of distributions for describing and analyzing precipitation data”. Journal of Applied Meteorology 12, pp. 275-280, 1973.
[22]Quanxi Shao. “Notes on maximum likelihood estimation for the three-parameter Burr XII distribution”. Computational Statistics and Data Analysis 45 (3), pp.675-687, 2004.
[23]C. Kleiber and S. Kotz. “Statistical Size distribution in Economics and Actuarial Sciences”. John Wiley, Hoboken, New Jersey, 2003.
32
48 (3), pp. 337-344, doi: 10.2307/1402945, JSTOR 1402945, 1980.
[25]Quanxi Shao. “Estimation for hazardous concentrations based on NOEC toxicity data: an alternative approach”. Environmetrics 11, pp. 583-595, 2000.
[26]M.M. Shoukri, I.U.M. Mian and D.S. Tracy. “Sampling Properties of Estimators of the Log-Logistic Distribution with Application to Canadian Precipitation Data”. The Canadian Journal of Statistics 16 (3), pp. 223-236, doi: 10.2307/3314729, JSTOR 3314729, 1988.
[27]Fahim Ashkar and Smail Mahdi. ”Fitting the log-logistic distribution by generalized moment” Journl of Hydrology 328 (3-4): pp. 694-703, 10.1016/j.jhydrol.2006.01.014.
[28]A. Zempleni (2004). “Goodness-of-fit test in extreme value applications”. Discussion Paper No. 383, SFB 386, Statistische Analyse Diskreter Strukturen, TU Munchen.
[29]WHO (World health Organisation). ”WHO air quality guidelines global update 2005”, in Report on a Working Group Meeting. Bonn, Germany, p. 15, 18-20, Oct. 2005.