ScholarWorks
Walden Dissertations and Doctoral Studies Walden Dissertations and Doctoral Studies Collection
2019
Extent, Correlates, and Consequences of Careless
and Inattentive Responding in Certification Job
Analysis Surveys
Patricia M. Muenzen
Walden UniversityFollow this and additional works at:https://scholarworks.waldenu.edu/dissertations
Part of thePsychology Commons
This Dissertation is brought to you for free and open access by the Walden Dissertations and Doctoral Studies Collection at ScholarWorks. It has been accepted for inclusion in Walden Dissertations and Doctoral Studies by an authorized administrator of ScholarWorks. For more information, please [email protected].
Walden University
College of Social and Behavioral SciencesThis is to certify that the doctoral dissertation by Patricia Muenzen
has been found to be complete and satisfactory in all respects, and that any and all revisions required by
the review committee have been made. Review Committee
Dr. James Herndon, Committee Chairperson, Psychology Faculty Dr. Derek Rohde, Committee Member, Psychology Faculty Dr. Brian Cesario, University Reviewer, Psychology Faculty
Chief Academic Officer Eric Riedel, Ph.D.
Walden University 2019
Abstract
Extent, Correlates, and Consequences of Careless and Inattentive Responding in Certification Job Analysis Surveys
by
Patricia M. Muenzen
MA, Stony Brook University, 1988 Sc.B., Brown University, 1983
Dissertation Submitted in Partial Fulfillment of the Requirements for the Degree of
Doctor of Philosophy
Industrial/Organizational Psychology
Walden University May 2019
Abstract
Survey data quality is influenced by the care and attention that respondents take in answering questions. Careless and inattentive (CI) responding is a confound in survey data that can distort findings and lead to incorrect conclusions. This quantitative study explored CI responding in job analysis studies supporting occupational certification programs and its relationship to survey features, data quality measures, and test content validity. Satisficing theory served as the framework, and secondary analysis of 3 job analysis surveys was undertaken. Results indicated that 9-33% of respondents engaged in CI responding, with the rate differing by CI index used (Mahalanobis distance, long string analysis, or person-total correlation) and by occupation. Each index detected a distinct pattern of carelessness, supporting the use of multiple indices. The indices performed best detecting carelessness in frequency ratings and may not be useful for all job analysis rating scales. Partial support was found for relationships between
carelessness and survey features. CI responding had a minimal impact on mean ratings, correlations, and interrater reliability, and had no impact on certification test content outlines. By providing guidance and caution on the use of CI response detection methods with job analysis survey data, this study produced two potential avenues for social
change. For practitioners conducting occupational job analyses, the use of CI detection methods can enhance the validity of data used to make certification decisions. For researchers, follow-up studies can yield a more nuanced understanding of the most appropriate use of these methods in the job analysis context.
Extent, Correlates, and Consequences of Careless and Inattentive Responding in Certification Job Analysis Surveys
by
Patricia M. Muenzen
MA, Stony Brook University, 1988 Sc.B., Brown University, 1983
Dissertation Submitted in Partial Fulfillment of the Requirements for the Degree of
Doctor of Philosophy
Industrial/Organizational Psychology
Walden University May 2019
Acknowledgments
I could not have done this alone. My family and friends supported me in so many ways during this journey and I wish to thank them all for their contributions to my
success. First, my amazing family: Chuck, Kelly, Steven, Kathleen, and Elizabeth; Chase, Carla, Barry, Jessica, Shana, and Jesse; Mollie and Kaarlo; and Faith. I have an abundance of blessings with you in my life. You’ve all helped me persevere whether you know it or not. I love you all dearly. I wish my Mom and Dad could have been here for this. They would have been so proud. Thanks go to my treasured friends Shelley, Pattie, Janet, Shawna, Staci, Jeanne, Susan, Claire, and Daryl. They all believed in me and gave me the strength and confidence to push through the tough times.
My dissertation chair, Dr. James Herndon, generously shared his wisdom through this dissertation process. When I began this journey, I had no idea where it would take me. Dr. Herndon knew I would get where I needed to go if I just persevered. My second committee member, Dr. Derek Rohde, was tremendously supportive and encouraging. I thank them both for their invaluable assistance. Thanks also to URR Dr. Brian Cesario for providing an outsider view of my work.
i
Table of Contents
List of Tables ...v
List of Figures ... vii
Chapter 1: Introduction to the Study ...1
Background ...4
Problem Statement ...8
Purpose of the Study ...9
Research Questions and Hypotheses ...13
Theoretical Framework ...15
Nature of the Study ...17
Definitions...17
Assumptions ...19
Scope and Delimitations ...20
Limitations ...21
Significance...21
Summary ...22
Chapter 2: Literature Review ...24
Introduction ...24
Literature Search Strategy...25
Job Analysis Literature ...26
Historical Perspective on Survey Response Accuracy ...31
ii
Deterrence and Detection Methods ...32
Deterrence Strategies ... 32
Detection Strategies ... 33
Types of CI Responding ...36
Applicability of Detection Methods to Job Analysis Studies ...40
Theoretical Foundations...41
Individual Differences in CI Responding ...44
Design Characteristics ...46
Summary and Transition ...46
Chapter 3: Research Method ...48
Introduction ...48
Research Design and Rationale ...48
Secondary Data Sources ...49
Conditions of Data Collection ...50
Procedures for Obtaining the Data ...51
Operationalizing the Study Variables ...52
CI Responding ... 52
Long String Analysis ... 53
Job Aspect ... 54
Length of Survey... 54
Mahalanobis Distance ... 54
Person-Total Correlation ... 55
iii
Data Analysis Plan ...56
Research Questions and Hypotheses ...58
Threats to Validity ...61
Ethical Procedures ...63
Summary and Transition ...63
Chapter 4: Results ...64
Restatement of Research Questions ...64
Tests for Assumptions...65
Characteristics of Datasets ...66 Results ...66 Research Question 1 ... 66 Research Question 2 ... 73 Research Question 3 ... 76 Research Question 4 ... 81 Research Question 5 ... 97 Summary of Findings ...102 Chapter 5: Conclusions ...103 Introduction ...103
Interpretation of the Findings...103
Survey Length ... 104
Job Aspect Rated... 105
Rating Scale Used ... 106
iv
Extent of Careless and Inattentive Ratings ... 107
Psychometrics ... 108
Limitations of the Study...109
Recommendations ...111
Implications...112
Conclusion ...113
References ...115
Appendix A: Letters of Permission to Contact Clients ...133
v List of Tables
Table 1. Data Sources ... 50
Table 2. Shapiro-Wilk Tests of Normality ... 65
Table 3. Characteristics of Job Analysis Datasets ... 66
Table 4. CI Index Descriptive Statistics for Task Ratings by Survey Length ... 68
Table 5. CI Index Descriptive Statistics for Knowledge Ratings by Survey Length ... 71
Table 6. CI Index Descriptive Statistics for Task and Knowledge Frequency Ratings .... 73
Table 7. CI Index Descriptive Statistics for Task Ratings by Occupation ... 76
Table 8. CI Index Descriptive Statistics for Knowledge Ratings by Occupation ... 79
Table 9. Spearman’s Correlation Coefficients for Task CI Measures ... 83
Table 10. Spearman’s Correlation Coefficients for Knowledge CI Measures ... 84
Table 11. Sample Response Strings Flagged by Each Method ... 85
Table 12. Rotated Factor Loadings and Factor Correlations for Task CI Indices ... 86
Table 13. Rotated Factor Loadings and Factor Correlations for Knowledge CI Indices . 87 Table 14. Initial Decision Rules for Flagging CI Values as Careful or Careless ... 89
Table 15. Number and Percentage of Task Survey Records Flagged by CI Index ... 90
Table 16. Number and Percentage of Knowledge Survey Records Flagged by CI Index 90 Table 17. Number and Percentage of CI Indices for which Respondents Flagged ... 92
Table 18. Number of Records Flagged using Initial Decision Rules ... 93
Table 19. Revised Decision Rules for Flagging CI Values as Careful or Careless ... 95
Table 20. Revised Number and Percentage of CI Indices for which Respondents Flagged ... 96
vi
Table 22. Task Rating Scale Psychometrics Pre- and Post-Removal of CI Responses .... 98 Table 23. Knowledge Rating Scale Psychometrics Pre- and Post-Removal of CI
Responses ... 99 Table 24. Results of Application of Validation Thresholds ... 101
vii List of Figures
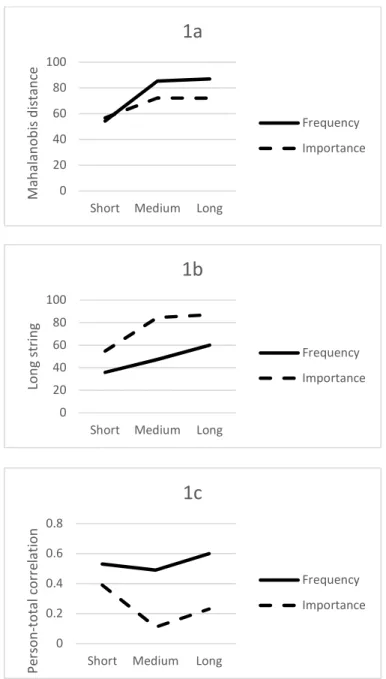
Figure 1. Median task CI index values for frequency and importance ratings by survey
length... 69
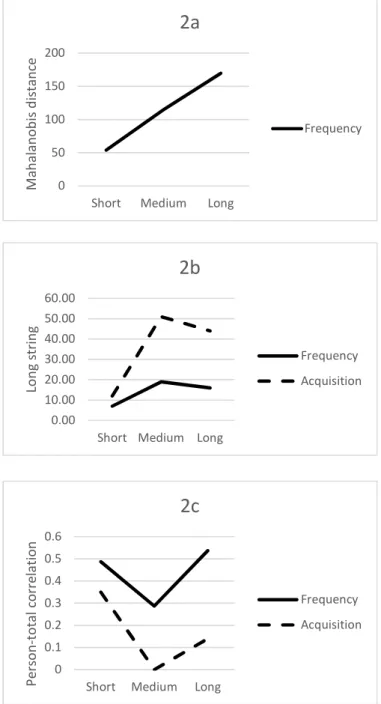
Figure 2. Median knowledge CI index values for frequency and acquisition ratings by survey length ... 72
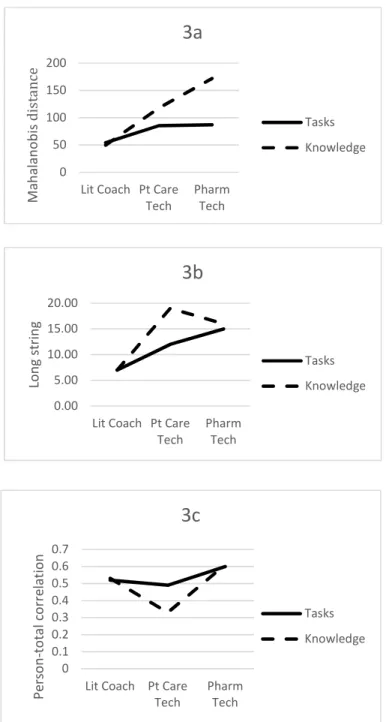
Figure 3. Median CI index values for task and knowledge frequency ratings by survey length... 75
Figure 4. Median CI index values for task frequency and importance ratings by occupation surveyed... 78
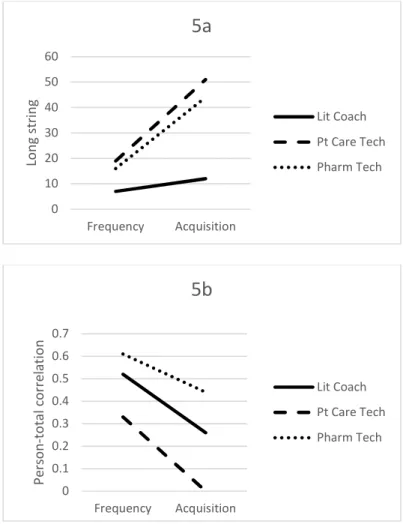
Figure 5. Median CI index values for knowledge frequency and acquisition ratings by occupation surveyed... 80
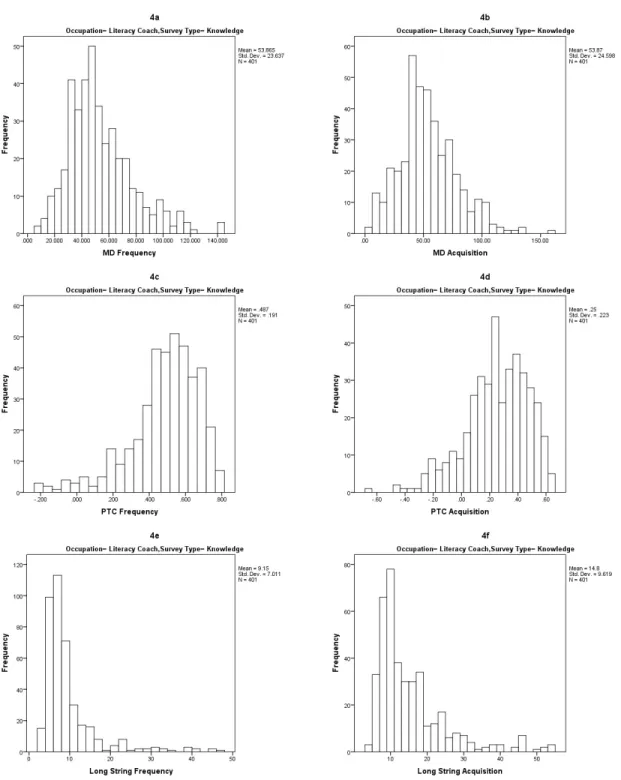
Figure B1. Histograms of task CI index values for literacy coaches ... 135
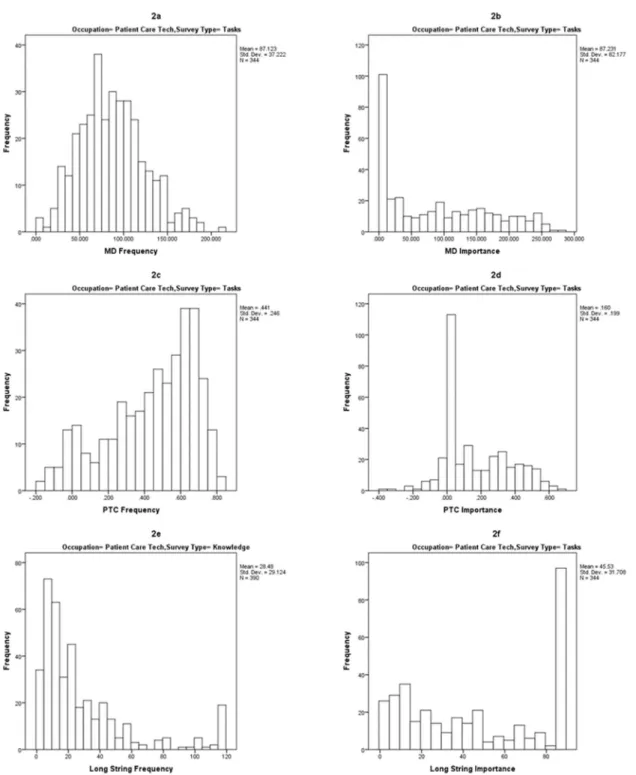
Figure B2. Histograms of task CI index values for patient care technicians.. ... 136
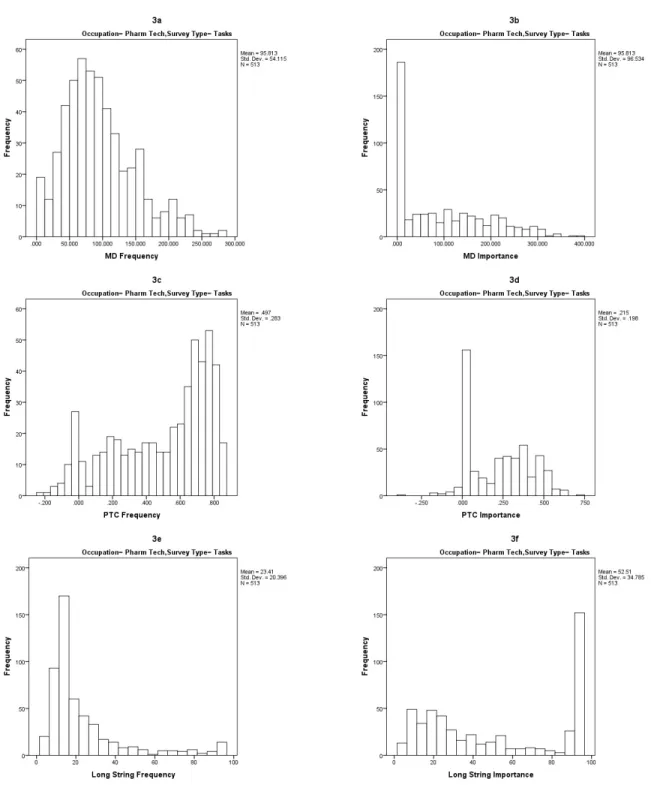
Figure B3. Histograms of task CI index values for pharmacy technicians ... 137
Figure B4. Histograms of knowledge CI index values for literacy coaches ... 138
Figure B5. Histograms of knowledge CI index values for patient care technicians ... 139
Chapter 1: Introduction to the Study
Surveys are a widely used method to collect data in social science research (Breitsohl & Steidelmüller, 2018; de Vaus, 2013; Fulton, 2016). In addition to their widespread use, data collected through surveys play an important role in drawing inferences on social issues (Barge & Gehlbach, 2012; Dillman, n.d.; Thomas, 2014). Given the role that surveys play in investigating social issues, the need for high quality data is paramount. Researchers rely on survey takers to provide honest and accurate responses, yet evidence suggests this does not always occur (Krosnick, 1999). For example, respondents may engage in socially desirable responding by selecting response options they believe will convey a favorable impression of themselves, or deliberately falsify their answers (Krosnick & Presser, 2010). With the proliferation of Internet-delivered surveys, survey takers are less motivated and may be careless or inattentive (CI) when answering survey questions, drawing into question the accuracy of the information provided (Godinho, Kushnir, & Cunningham, 2016; Ward & Pond, 2015).
This study addresses survey data quality through the investigation of CI responding to job analysis surveys supporting national occupational certification programs. Occupational certification is the means by which independent organizations evaluate and award credentials to individuals demonstrating the requisite background, knowledge, skills, and abilities (Sireci & Hambleton, 2009). Typically, candidates for certification must meet eligibility requirements and pass a knowledge-based examination
(Raymond & Luecht, 2013). Examination specifications are structured around domains of practice, tasks performed, and optionally, knowledge used in practice.
The number of certifications being offered and the number of individuals seeking certification are both growing (Albert, 2017). The increasing popularity of certification may be attributed to several factors. Certification may provide a competitive advantage in the workplace as possession of the credential indicates a certain standard has been achieved through meeting education, experience, and examination requirements. For employers, certifications demonstrate that an applicant or incumbent possesses specific knowledge, skills, and experiences needed for specific positions. For those seeking to gain employment or make career changes, certification can enhance mobility by providing credentials that give entrée to new opportunities. Finally, certification may help address the skills gap by providing a means for training and verification of specific knowledge, skills, and abilities (Kochan, Finegold, & Osterman, n.d.; National
Workforce Solutions Advisory Board, 2017).
The Bureau of Labor Statistics (2017) estimated that in 2017, 24.3% of the adult US population held occupational credentials, either licenses or certifications. Licenses are granted by US states to permit individuals to hold a title and practice in a profession. In contrast to licenses which are requirements for practice, certifications are voluntary, although some states may adopt certifications for licensure purposes. The Uniform Guidelines for Employee Selection Procedures (Equal Employment Opportunity
link between assessment content and evidence of job-relatedness. The certification industry adheres to this guidance when developing examinations for voluntary
certification programs. The credentialing industry also adheres to relevant standards such as the Standards for Educational and Psychological Testing (American Psychological Association [APA], American Educational Research Association [AERA], & National Council on Measurement in Education [NCME], 2014). The Standards for Educational and Psychological Testing specify that the content domain for a certification examination needs to be clearly defined, and that job analysis is an important method of defining the content domain. Accreditation standards for certification and licensure (Institute for Credentialing Excellence [ICE], 2014) require the conduct of occupational job analysis surveys in establishing a certification examination content outline, except in extenuating circumstances. Taken together, the legal environment, professional standards, and accreditation requirements all indicate the importance of job analysis as the means of establishing the content validity of certification examinations. Job analysis surveys conducted to support certification examinations play a key role in supporting the
validation argument for certifications, and the data collected in credentialing program job analysis surveys impact testing content for examinations taken by nearly a quarter of the US adult population. Identification and removal of CI survey responses can potentially increase the reliability of job analysis survey data and better support the content validity argument for test content outlines drawn from the data.
In this chapter, I introduce the phenomenon of CI survey responding and discuss its relationship to data quality. I review research on CI responding both in general and in a job analysis context. Next, I describe a research program focused on job analysis studies for three occupations (literacy coach, patient care technician, and pharmacy technician) undertaken to support national certification programs for the respective occupations. Literacy coaches are consultants who provide professional development to teachers to improve teaching practices and student achievement in literacy. Pharmacy technicians work primarily in community and hospital pharmacies under pharmacists’ direct supervision to fill prescriptions and support pharmacy operations. Patient care technicians work primarily under the supervision of nurses to provide basic care to patients, such as meals, toileting, and vital signs measurement. I describe researchable hypotheses, and outline steps to be undertaken to investigate the hypotheses.
Assumptions, delimitations, and limitations of the study are also described. Background
Beginning with an influential paper by Meade and Craig (2012) which reported an estimated 7 to 9% of survey data as careless, a growing body of research has focused on exploring CI survey responding (Godinho et al., 2016; Huang, Liu, & Bowling, 2015; Meade & Craig, 2012; Morgeson, Spitzmuller, Garza, & Campion, 2014; Steedle, 2018; Thomas, 2014; Ward & Pond, 2015). CI responding is differentiated from socially desirable responding, in which respondents select answers that create a favorable impression, or faking, in which respondents deliberately selecting false answers.
Response bias due to faking or socially desirable responding occurs when a respondent provides answers that are deliberate distortions based on the meaning of survey
questions. In contrast, CI responses are unrelated to the questions posed. Response bias is related to the construct being measured, while CI responding is not (Meade and Craig, 2012). More recent estimates of CI responding are in the 8 to 2% range (Curran, 2016). The presence of CI responses in survey datasets has been found to decrease statistical power (Maniaci & Rogge, 2014) and reliability (Huang, Curran, Keeney, Poposki, & DeShon, 2012; Meade & Craig, 2012). It can attenuate or amply correlations depending on the characteristics of the valid data. Because of this, Huang et al. (2012) called CI responding an insidious confound. It distorts factor analysis structures (Huang et al., 2012), and decreases factor analysis model-data fit (Steedle, 2018) leading to different conclusions being drawn about the relationships among variables.
The Internet is commonly used to deliver occupational job analysis surveys to geographically dispersed national samples. CI responding occurs more frequently with Internet surveys than with their paper and pencil counterparts (Barge & Gehlbach, 2012; Thomas, 2014; Ward & Pond, 2015). Johnson (2005) found that the extent of inattentive responding to a personality inventory was greater when the inventory was administered online than when it was administered via paper and pencil. Internet-based surveys allow for distraction and multitasking (Carrier, Cheever, Rosen, Benitez, & Chang, 2009; Fang, Wen, & Prybutok, 2014; Hardré, Crowson, & Xie, 2012; Ward & Pond, 2015), making it easier to respond carelessly and inattentively. While there is no published data regarding
the relationship between Internet delivery and CI responding to occupational analysis surveys, extrapolation from the existing literature suggests it occurs and is an important issue.
Careless responding may be more prevalent in low stakes contexts, such as job analysis surveys that support human resource (HR) activities (Huang et al., 2012). Such surveys are the primary means for establishing content validity for national certification examinations (Raymond, 2001, 2002; Raymond & Luecht, 2013). Huang et al. (2012) argued that CI response detection is a quality control method useful to detect unmotivated responding to job analysis surveys. However, limited studies to date has focused on CI responding in job analysis surveys. Studies by Green & Stutzman (1986), Morgeson et al. (2014), and Stetz, Button, and Quist (2012) incorporated bogus items such as, I was born on February 30, into job analysis surveys to flag for respondents endorsing these items. Carelessness was operationalized as the number of bogus items endorsed. No cutoffs were applied to categorize respondents as careful or careless, so the rate of CI responding in job analysis surveys is not known.
Data from certification organizations is almost entirely lacking. Most
certification organizations do not make their job analysis studies public. Of those that do, the majority do not mention data screening or data cleaning at all. I was able to identify only one organization, the American Registry of Radiologic Technologists (ARRT), that describes reviewing their collected job analysis data for aberrant responses. The ARRT used visual screening to identify unrealistic response patterns rather than mathematical
and statistical techniques. In addition, in 2017, I conducted a job analysis study of patient care technicians using bogus items and directed response items. Directed response items instruct respondents to select specific response options. This was the first time I used these techniques myself, and I believe my colleagues in the credentialing industry do not make these screening techniques part of their standard practice.
Outside of the job analysis context, several researchers have begun to study the utility of various post hoc statistical means of identifying and eliminating CI responses from datasets (Huang et al., 2012; Kam & Meyer, 2015; Maniaci & Rogge, 2014; Meade & Craig, 2012; Roivainen, Veijola, & Miettunen, 2016; Steedle, 2018; Ward & Meade, 2018; Ward & Pond, 2015). Numerous methods have been explored; however, no consistent pattern has emerged in the literature regarding which techniques to employ. DeSimone, Harms, and DeSimone (2015) and Huang et al. (2012) argued that a
combination of techniques should be used, while Mancini and Rogge (2014) suggested that only a single detection technique can be sufficient. Meade and Craig (2012)
identified two different types of CI responding, responding using a single response option and responding using a variety of response options, each identified by different
carelessness indices. Curran (2016) recommended a multiple hurdles approach to data cleaning through the sequential use of different indices. In my study, the techniques and findings from these studies were applied to the certification job analysis context.
CI responding to self-administered surveys is not a new problem but it has received increased focus in the literature. A recent call for papers (Bowling & Huang,
2016) for a special issue of a measurement journal on the topic of “measurement, causes, and consequences” of CI responding highlights the relevance of the topic. The potential threat to reliability and validity posed by CI responding is stimulating progress toward better understanding of the phenomenon and efforts mitigation of the problem. The problem of careless responding is particularly acute for longer (Huang, Bowling, Liu, & Li, 2015) and Internet-based surveys (Hardré et al., 2012; Zhang & Conrad, 2014), and long, Internet-based surveys are characteristic of most occupational certification job analysis surveys. As “the topic of rating accuracy is a central yet unresolved issue in the job analysis literature” (Aguinis, Mazurkiewicz, & Heggestad, 2009, p. 433), it is
essential to understanding the extent and impact of careless responding in this survey type.
Problem Statement
Limited research exists regarding CI responding in job analysis surveys, yet this type of responding is likely prevalent in job analysis (Huang et al., 2012). Careless responding exists and can distort survey results. Given the foundational role of job analysis data in determining examination content for occupational credentials, careless responding in occupational job analysis surveys is an important concern. Due to carelessness, findings from credentialing job analysis surveys may yield inaccurate certification test content outlines. If credentialing organizations award certifications to individuals who pass examinations based on content outlines of questionable validity, the meaning and value of credentials is compromised.
Purpose of the Study
The purpose of this quantitative study is to explore CI responding in self-administered Internet-based job analysis surveys that support occupational certification programs. A recommenced practice in certification program development is for
sponsoring organizations to conduct two-phase job analysis studies. In the first phase, subject matter expert panels delineate the key attributes of the profession in terms of domains of practice, task performed within domains, and/or knowledge, skills and abilities employed. In the second phase, surveys are conducted to gather evidence to validate the elements of the delineation and create test content outlines (ICE, 2014; Raymond & Luecht, 2013). Credential sponsors administer Internet-based job analysis surveys to large samples of job holders across organizations and jurisdictions. The self-administered survey is a practical mode of data collection when large numbers of people perform the role or function under study (Van De Voort & Whelan, 2012), and the
Internet provides a convenient way to deliver surveys to large samples of job holders who may be dispersed geographically.
This study draws upon two streams of prior research. The first is literature on job analysis quality. To date, studies regarding the quality of job analysis ratings have explored manipulations to encourage respondents to provide accurate responses (Lievens & Sanchez, 2007; Morgeson et al., 2014), as well as a limited set of techniques, typically the use of bogus items, to detect and eliminate poor quality responses (Green &
analysis arena have explored the potential use and utility of a broader set CI detection techniques. The second is the body of literature on the use of post hoc detection
techniques to investigate careless responding. Because the extent of CI responding varies widely across studies (Curran, 2016), it is difficult to generalize findings across survey types. Thus, the extent of careless responding in job analysis surveys is not known. This study is the first to specifically explore post hoc detection of CI responding in job
analysis surveys generally, and in national occupational job analysis studies for credentialing programs specifically.
In this study, the existing research on carelessness in job analysis surveys responding was extended to a larger set of detection methods than had been studied previously. The goals were to: (a) estimate the baseline rate of CI responding in job analysis questionnaires, (b) identify the types and extent of CI responding demonstrated with different survey questions and rating scales, (c) examine the psychometric
implications of careless responses on job analysis results, and (d) explore optimal sets of CI response detection indices to use with job analysis survey data. Predictor variables were factors hypothesized to increase ratings complexity and decrease respondent motivation. The three predictor variables were survey length, job aspect rated (task versus knowledge), and type of rating scale (concrete versus abstract).
Regarding survey length, job analysts have long pointed out the tedious nature of lengthy job analysis surveys (Harvey & Wilson, 2000; Morgeson & Campion, 1997; Morgeson et al., 2014; Sanchez & Levine, 2001). In a study of job analysis ratings for
surveys supporting certification examinations, Wang, Wiser, and Newman (1999) found that for blocks of tasks appearing later in surveys, respondents used fewer response categories, a finding they attributed to fatigue. In studies of surveys other than job analysis, longer surveys were associated with poorer data quality (Galesic & Bosnjak, 2009; Hardré et al., 2012; Zhang & Conrad, 2014). These findings suggest the potential more CI responding in the longer surveys in my study.
Regarding job analysis elements and rating scales, Harvey and Wilson (2000) made a distinction between two continua relevant to job analysis collection data: the descriptor item metric and the rating scale metric. The descriptor item metric refers to the level of specificity or abstraction in job aspects rated. The most concrete job aspects are specific, observable, and verifiable job tasks. More abstract job aspects are
knowledge, skills, abilities, and other attributes (KSAOs), with abilities and attributes being the most abstract. Morgeson and Campion (2000) made a similar distinction between ratings made for work activities/tasks and KSAOs, the “psychological constructs underlying job-related capabilities” (p. 823). Making KSAO ratings calls for an
inferential leap from job tasks to judgments of the requisite KSAOs employed in task performance (Morgeson & Campion, 1997, 2017; Sanchez & Levine, 2001). Dierdorff and Morgeson (2009) found that task ratings had higher reliability than KSAO ratings and posited that making KSAO ratings was more cognitively demanding than rating tasks, leading to more idiosyncratic rater variance.
Harvey and Wilson’s (2000) rating scale metric refers to the types of judgment a survey taker is required to make through the application of rating scales to tasks and KSAOs. A “behaviorally specific and easily verifiable” scale (Harvey & Wilson, 2000, p. 831), for example, an absolute frequency scale with response options such as annually, monthly, weekly, and daily is relatively straightforward, as it requires answers based in real time. Other job analysis scales are less concrete. For instance, a relativistic scale asking respondents to rate each task in relation to all other job tasks performed is complex, requiring the respondent to hold all job tasks in their minds simultaneously to make a judgment. Similarly, making yes/no task ratings for a hypothetical situation such as, I would be expected to perform this task should the need arise, is complex. In support of the distinction between abstract and concrete rating scales, Stetz et al. (2012) found that survey respondents endorsed bogus tasks more when rating whether they would be expected to perform the tasks if necessary than when rating the absolute frequency with which they performed the tasks. The implication is that having to determine whether they might be expected to perform a task was a more cognitively demanding and produced more careless responses.
The criterion variables in this study were three post hoc indices of CI responding. Long string analysis is an index indicting the number of consecutive identical responses in a response string (Meade & Craig, 2012). The Mahalanobis distance index compares each respondent’s patterns of ratings to those of all other respondents. It is an indication of the extent to which an individuals’ response patterns are inconsistent with those of all
other respondents (De Maesschalck, Jouan-Rimbaud, & Massart, 2000; Mahalanobis, 1936). The person-total correlation is the correlation between an individual’s survey responses and the mean responses of all other survey takers, averaged across items (Curran, 2016). Long string analysis is a within-person measure, while Mahalanobis distance and person-total correlation are between-person measures. Additional criterion measures focused on job analysis quality were rating scale reliability, average interitem correlations, and mean ratings. Findings from Huang, Liu, and Bowling (2015), Maniaci and Rogge (2014), and Meade and Craig (2012) suggest values on these criterion
measures will be attenuated for careless responders.
Research Questions and Hypotheses
RQ1: Is there a relationship between survey length and extent of carelessness? H01: There is no relationship between survey length and extent of carelessness
Ha1: There is a relationship between survey length and extent of carelessness.
Both variables are continuous and Pearson’s correlation coefficients were planned to address this question.
RQ2: Is there a relationship between job aspect rated and extent of carelessness? H02: There is no relationship between job aspect rated and extent of carelessness.
Ha2: There is a relationship between job aspect rated and extent of carelessness.
Job aspect rated refers to which aspect of the job was surveyed, tasks performed or knowledge bases used. Tasks are descriptors of the job and knowledge bases are characteristics of job holders. Each survey was versioned, so respondents were randomly
routed to either tasks or knowledge. Job aspect (tasks versus knowledge), is a categorical variable and point-biserial correlation coefficients were planned to address this question.
RQ3: Is there a relationship between rating scale used and extent of carelessness? H03: There is no relationship between rating scale used and extent of carelessness.
Ha3: There is a relationship between rating scale used and extent of carelessness.
For each survey version, two rating scales were used. For tasks, the scales were frequency and importance. For knowledge, the scales were frequency and point of acquisition. Rating scale is a categorical variable and point-biserial correlation coefficients were planned to address this question.
RQ4: Is each post hoc detection index equally useful for identifying careless responding in job analysis surveys?
H04: All indices will be equally useful in flagging careless responding.
Ha4: All indices will not be equally useful in flagging careless responding.
Addressing this question involved exploring the relationships among the indices through correlation and factor analysis and identifying data patterns and numbers of individuals flagged by each index.
RQ5: Is there a relationship between careless responding and the psychometric characteristics of job analysis data?
H05: There is no relationship between careless responding and the psychometric
Ha5: There is a relationship between careless responding and the psychometric
characteristics of job analysis data.
To address this question, rating scale reliability, interrater reliability, and correlations among mean task or knowledge ratings were calculated before and after removing responses flagged as careless.
RQ6: Are there differences in terms of selection of tasks for a certification test content outline?
H06: There is no difference in terms of tasks and knowledge for a certification test
content outline?
Ha6: There are differences in terms of tasks and knowledge selected a
certification test content outline?
To address this question, thresholds used by credential sponsors organizations were applied before and after removing responses flagged as careless.
Theoretical Framework
Satisficing is a framework for understanding suboptimal survey
responding (Krosnick, 1999). When responding to a survey question, the participant must undertake a four-step cognitive process. First, the participant must read and understand the meaning of the question. Second, they must perform a memory search to retrieve relevant information. Third, they must integrate the information into a judgment. Fourth, they must accurately convey that judgment in accordance with the required
must devote cognitive effort to all four steps. A respondent who is satisficing skips or shortcuts one or more steps in the process, thus providing less meaningful information (Vannette & Krosnick, 2014).
Satisficing is influenced by three factors: lack of motivation, lack of ability, and
task difficulty (Krosnick & Presser, 2010). Responding to a survey may require considerable cognitive effort (Vannette & Krosnick, 2014). Respondents might have difficulty answering survey questions due to their inability to engage in the four-step cognitive process. For those with the ability to respond, questions posed and judgments required may be challenging. Finally, even respondents who can respond and do not find the task too difficult may experience a waning in motivation to continue to expend effort, particularly when responding to lengthy surveys. Satisficing is more likely to occur when any of these three factors is present (Krosnick, 1999).
Satisficing offers a theoretical explanation for CI responding. Job analysis surveys require repetitive ratings for lists of tasks or knowledge areas. Typically, more than one rating scale is employed, doubling the number of judgments required for the listed items. Based on satisficing theory, predictions regarding the level of carelessness in different job analysis ratings contexts can be made. For example, the theory specifies that motivation is the proximal cause of carelessness and factors such as survey length and cognitive difficulty making the ratings are demotivating, resulting in more
satisficing. Satisficing and its relationship with CI responding are discussed in more detail in Chapter 2.
Nature of the Study
The nature of this study was quantitative. A quantitative approach is appropriate for exploring the relationship between the predictor variables (length of survey, type of rating scale, presence or absence of incentives, and type of incentive) and criterion variables (extent of CI responding using three different detection indices, job analysis psychometric properties, and tasks selected for a test content outline). Secondary data analysis was undertaken to address the research questions.
Secondary data analysis is a cost-effective and efficient means of comparing data collected in different contexts (Frankfort-Nachmias & Nachmias, 2008; Johnston, 2014). Curran, Kotroba, and Denison (2010), Huang, Liu, and Bowling (2015), and Johnson (2005) used archival data in their CI research. In the present study, job analysis survey data already collected for three different professions’ certification programs were re-analyzed.
Definitions
The following operational definitions were adopted for this study.
Abstract rating scale:Error! Bookmark not defined.Abstract rating scales require survey takers to make subjective evaluations of job tasks or KSAOs, such as importance to the job overall or importance to public protection. Scale anchors for abstract scales are non-verifiable (Harvey & Wilson, 2000). An example of an abstract rating scale is an importance scale for which respondents indicate whether a task is not important, minimally important, moderately important, or highly important to protecting patient
health and safety. Relative to concrete rating scales that focus on observable aspects of the job, abstract scales pose a heavier cognitive burden to respondents due to their greater information-processing demands and required level of inference (DuVernet, Dierdorff, & Wilson, 2015).
Certification Test Content Outline: A certification test content outline is comprised of domains of practice, tasks performed within domains, and optionally knowledge and skills. A content outline is hierarchical; the highest level is typically comprised of four to seven broad domains that encompass all tasks performed on the job. The outline specifies the percentage of test questions to assess content related to tasks in each domain. The percentage weights are derived empirically from job analysis ratings. The second level of a content outline is a list of tasks performed in the domain. Only tasks validated based on job analysis survey ratings are included.
CI Responding: This is “a survey response set in which a person responds to items without sufficient regard to the content of the items and/or the survey instructions” (Huang, Bowling, et al., 2015, p. 828). CI responses are a confound in survey data and researchers advocate screening for and removing these responses. Several screening methods exist, including explicit instructions, bogus survey items, self-report data, response time analysis, and post-hoc detection indices (Curran, 2016; DeSimone et al., 2015).
Concrete Rating Scales: Concrete ratings scales require survey takers to report on aspects of a job, such as how frequently they perform specific tasks. Concrete scales use
verifiable anchors (Harvey & Wilson, 2000). An example of a concrete rating scale is a frequency scale for which respondents indicate whether a task was performed daily, weekly, monthly, quarterly, or annually. Relative to abstract rating scales, which require subjective evaluations, concrete scales focus on observable aspects of work. Little inference is required to respond to concrete rating scales.
Job Aspects: Job aspects describe work activities and worker characteristics that are delineated in a job analysis study. In certification job analysis, the job aspects studied most frequently are domains of work and associated tasks (Raymond, 2001, 2002). Job analysis studies in certification may also include the testable knowledge and skills required to perform tasks in each domain. Job aspects are descriptors of various aspects of a job, occupation, or profession that are delineated in a job analysis study. In
certification job analysis, the job aspects studied most frequently are domains of work and associated tasks (Raymond, 2001, 2002). They may also include the testable knowledge and skills required to perform tasks in each domain.
Post-Hoc Detection Indices: Post-hoc detection indices are mathematical or statistical calculations applied to already-collected survey data. Three such indices are used in this study: long string analysis, Mahalanobis distance, and person-total
correlation.
Assumptions
An assumption underlying this study was that most responses to the job analysis surveys being studied represented careful and thoughtful responding. Some of the
indices being used will produce spurious results if they are run on datasets in which the percentage of carelessness responders exceeds 20%. While Curran (2016) estimates that the 10% of respondents are careless, which should mitigate the risk associated with excessive careless data, the baseline rate in job analysis is not known. However, I am assuming that enough careless responding exists in the datasets I am studying to permit hypothesis testing involving comparisons between groups.
Scope and Delimitations
Job analysis informs all HR functions within organizations; however, this study focuses only on job analyses conducted outside of a specific organizational context. National job analyses surveys that support certification programs sample broadly from individuals representing a variety of employers. While survey takers will reflect their own organizations’ ways of working when they make their survey ratings, the lack of systematic variance from a single organization will not dominate the results.
The study involves three jobs: literacy coach, patient care technician, and pharmacy technician. Findings from this study may generalize to occupations that have similar eligibility criteria for their certifications. Caution needs to be taken when generalizing to professions requiring significant postsecondary education, because
carelessness is related to level of education, with more carelessness associated with lower levels of education (Anduiza & Galais, 2017; Bowling et al., 2016; Morgeson et al., 2014; Roivainen et al., 2016). Professions requiring a master’s degree or higher, such as
nursing, pharmacy, law, and occupational therapy may be associated with higher levels of professionalism and engender greater sustained attention and hence less carelessness.
Limitations
An obvious limitation of the study is that it employs a nonexperimental design. The absence of experimental controls means that noncontrolled variables may have an impact on the variables of interest. This may mask true differences between variables and inflate type II errors. The study design does aim to identify sources of variance hypothesized to relate to carelessness, but other sources likely exist that are not addressed. Because the study employs secondary analysis, the data have already been collected. Manipulating variables or asking additional questions about variables believed to relate to carelessness cannot be done. Should significant results not be obtained, it may be because of confounding variables. In this study, the disadvantages of the
nonexperimental design can be weighed against the advantage of undertaking secondary data analyses of multiple studies. When several job analyses are examined
simultaneously, comparison across studies is possible. Should findings occur in multiple studies, this strengthens the generalizability of the results.
Significance
By examining the extent of CI responding in job analysis studies, factors that influence it, and best methods for detecting and eliminating it, the hope is that guidance for future job analysts using an Internet-based approach to survey delivery can be developed. Using this guidance, job analysts can design surveys to minimize careless
responding and employ optimal detection techniques to identify and mitigate it when it does occur. Improving data accuracy enhances the validity of decision making based on the data. Given the past and expected growth of occupational certification, enhancing data quality will lead to the highest quality test content outlines, which are used in all aspects of certification program development.
More broadly, the findings from this study may inform a larger audience of survey researchers. The use of surveys in data collection is widespread, and the rise of the Internet has increased the frequency of survey use (Hauser & Schwarz, 2015). Guidance regarding the relationships between survey length, rating scale choice, and rates of careless responding can lead to more accurate data for a variety of purposes and strengthen research practices across disciplines.
Summary
This chapter introduced the data quality issue of CI survey responding, or responding without sufficient consideration of question content, a topic which has recently received increased research scrutiny. CI survey responding distorts survey results, and methods to detect and mitigate it have been proposed. Carelessness is particularly a problem in lengthy Internet-based surveys such as job analysis surveys administered in support of professional certification programs. A gap in the literature related to carelessness in job analysis surveys was articulated. A study addressing this gap and the problem posed by it was proposed, and testable hypotheses were specified. Definitions were supplied for terminology used in the study. The scope, delimitations,
and limitations of the study were discussed, and the significance of the research was outlined.
In the next chapter, the existing literature related to CI responding is discussed. Chapter 2 addresses the emerging survey research literature on carelessness, as well as literature on job analysis quality. In addition, different types of careless survey
responding are defined, and methods to screen for and detect carelessness are described. Finally, the research to date on post hoc detection indices is reviewed.
Chapter 2: Literature Review Introduction
CI responding is a mode of survey responding in which less-motivated survey takers respond without due reference to the survey questions or instructions (Huang, Liu, and Bowling, 2015). As such, it is distinct from impression management and other systematic forms of bias. It can distort reliability of measurement and the validity of interpretations of results. Detection and elimination of such survey responses can produce data that better reflect careful responders’ judgments regarding the variables under study. Although under certain conditions removal of CI can decrease reliability rather than increase it, score reliability will generally increase scale reliability, item intercorrelations, and validity (Huang et al., 2012).
The purpose of this study is to employ post-hoc analysis to determine causes, types, and extent of CI responding in job analysis surveys used to determine the content of licensure and certification examinations by exploring the effects of CI data on scale reliability, correlations among tasks and knowledge, and decisions regarding testable content. Satisficing theory provides the theoretical basis for the study, as it offers an explanation for the relationships between survey length, job aspect rated, and type of rating scale used and the extent and type of CI responding.
Job analysis surveys were selected for study because of the importance of job analysis data in HR. Data from job analysis surveys are used to create position descriptions, candidate assessments, incumbent education and training material, and
promotion and performance evaluation systems (Morgeson & Campion, 2017; Sanchez & Levine, 2012; Singh, 2008). Job analysis to support licensure and certification testing was chosen because of the high-stakes nature of decisions made based on test scores. In addition, because 24% of the US population holds licenses or certifications, the potential reach of inaccurate job analysis data and test content outlines of questionable validity is wide. Finally, job analysis surveys are of a type likely to induce carelessness due to their length and numerous judgments required (Huang et al., 2012; Morgeson & Campion, 1997).
In this chapter, I review literature related to the topic. First, I review the job analysis carelessness literature. Second, I review the recent literature on CI responding. The review encompasses deterrence and detection methods, and findings from studies using post-hoc detection methods. Third, I discuss theoretical explanations of survey responding in general and CI responding specifically, including Krosnick’s influential theory of satisficing. Fourth, I discuss survey design features likely to influence CI responding.
Literature Search Strategy
The following databases were searched: PsycINFO, PsycArticles, Academic Source Complete, Business Source Complete, and SAGE Journals. The following search terms were used: satisficing, survey, random responding, inconsistent responding, careless responding, inattentive responding, insufficient effort responding, job analysis, work analysis, ratings, rating scales, practice analysis, and data quality. Reference
sections of all articles obtained during the initial search were examined for further
relevant references. As the literature review progressed, historical perspectives regarding survey responding from 1970 onward were included.
Job Analysis Literature
Job analysis is a foundation for virtually all HR functions, including selection, evaluation, and promotion (Morgeson & Campion, 1997; Siddique, 2004; Van Iddekinge,
Putka, Raymark, & Eidson, 2005). Given the changing nature of work in the 21st century,
the term work analysis has been more recently adopted to refer to the set of techniques used to identify key tasks and KSAOs required for a position (Sanchez & Levine, 2012). In addition to its role within organizations, job analysis plays a central role in the
development of test content outlines for licensure and certification examinations (Raymond & Luecht, 2013; Wang et al., 1999). Accreditation requirements for credentialing programs specify that a job analysis must be conducted and used as the basis for examination development (ICE, 2014; International Standards Organization/ International Electrochemical Commission, 2012).
Classical test theory underlies much of the research on job analysis accuracy (Morgeson & Campion, 2000), with the assumption that true scores exist and that variation represents noise in the data. Inconsistency among survey takers’ is not necessarily indicative of inaccuracy (Lievens, Sanchez, Bartram, & Brown, 2010). Lievens et al. pointed out that, to some extent, differences between raters can be job-related and logical. For example, level of autonomy, cognitive ability, and job skill
predicted differences in the number of job tasks performed by administrative professionals (Morgeson, Delaney-Klinger, & Hemingway, 2005). Occupational complexity predicted variance in competency ratings (Lievens et al., 2010), suggesting that greater professional autonomy in complex occupations permits individualized work patterns. However, not all variance is explainable. Van Iddekinge et al. (2005) found that the majority of variance in KSAO importance and needed at entry ratings made by customer service managers was unexplained. Job and organization-level factors could not account for it, and age and gender effects were nonsignificant. Level of experience may influence job analysis ratings. Richman and Quinones (1996) found that
undergraduate participants in a laboratory study in which they rated relative and absolute frequency of task performance after either building or observing the building of a toy model that those who had less experience building or observing model building gave more accurate frequency ratings.
Potential sources of inaccuracy in job analysis ratings include both social and cognitive factors (Morgeson & Campion, 1997, 2012). While these sources have been proposed, they have not yet been studied exhaustively. Social causes that might affect responding to Internet-based job analysis surveys include distance from the researcher and anonymity of responses. Cognitive causes include limitations in information processing, fatigue, and the adoption of heuristics. Morgeson and Campion (1997) posited that rating inaccuracies in job analysis would be more likely when
Morgeson and Campion (2012) outlined six potential manifestations of inaccuracy that affect reliability and validity: interrater reliability, interrater agreement, discriminability, dimensionality, mean ratings, and completeness.
Studies employing a bogus item approach to inaccurate responding found high rates of endorsement of bogus items. Green and Stutzman (1986) had mental health workers complete a 115-item task inventory, making ratings of time spent relative to other tasks and importance to the job. For each rating scale, they calculated the number of bogus items endorsed. Fifty-seven percent of job incumbents indicated they spent time performing at least one of the bogus tasks and 72% rated at least one bogus task at least somewhat important to their jobs. Pine (1995) found that 45% of corrections officers indicated they performed at least one of five bogus items in a job analysis survey. Stetz et al. (2012) found that phrasing of questions influenced level of endorsement of bogus tasks. Between 85% and 97% correctly indicated they never performed a bogus task in the past 12 months, yet 39% to 64% incorrectly indicated they were expected to perform the bogus task. Stetz et al. concluded that “as a scale becomes less specific, less
observable, and more ambiguous, there is a corresponding increase in rating inaccuracy” (p. 105). Green and Veres (1990) found that 70% of police corporals and 13% of mental health workers endorsed bogus items. Additionally, they found that the effect of bogus item endorsement on reliability was inconsistent and differed by profession. For mental health workers, reliability of a scale asking whether tasks were performed at entry level was higher for respondents who were accurate in their ratings. However, this relationship
was not found for an importance scale, nor was it found on either scale for police corporals or clerical workers. In addition, mean task ratings were higher for inattentive respondents, suggesting a pattern of greater endorsement of items in general for
respondents who had at least one incorrectly endorsed a bogus task. Finally, in a job analysis survey of government employees in an agency for international economic development that included bogus items, Morgeson et al. (2014) found large correlations between the endorsement of bogus and legitimate tasks.
Wilson, Harvey, and Macy (1990) used repeat items in a single task inventory to explore short-interval test-retest reliability. Although not treated as such by Wilson et al., one could consider lack of consistent endorsement or non-endorsement as in indicator of CI responding. For city municipal workers, 10 of 41 (24%) responded carelessly, as did 6 of 34 (18%) hospital foodservice employees and 5 of 20 (25%) manufacturing workers. Together with the findings related to bogus tasks, these findings suggest relatively high rates of carelessness on job analysis inventories.
Generalizability studies suggest that 5% to 9% of variance in job analysis ratings can be attributed to raters. In a study of competencies across 64 occupations employing a Q sort methodology (Lievens et al., 2010), the raters factor accounted for an average of 5% of the variance in individual competency ratings. In a study of job analysis surveys for two professions undertaken to create licensure examination content outlines (Wang et al., 1999), raters accounted for 7 to 9% of variance in task ratings. Based on IRT infit
and outfit statistics, Wang et al. were able to identify raters who consistently selected the middle or extreme categories.
Two recent studies in the job analysis literature examined ratings carelessness. Dierdorff and Morgeson (2009) examined O*Net ratings made by 47,137 incumbents in over 300 jobs based on work characteristics (i.e., tasks and responsibilities) and worker characteristics (i.e., knowledge, skills, and traits). The smallest amount of rater variance was for tasks (11.7%) and the largest percentage (34.8%) was for trait ratings.
Knowledge ratings exhibited slightly more variance (14.6%) than task ratings. Task ratings were more reliable (.80) than knowledge ratings (.70), and trait ratings had the lowest reliability of all work descriptors studied (.45). Dierdorff and Morgeson hypothesized that these differences were due to differing levels of inference required when making ratings. Morgeson et al. (2014) explored the relationship between holistic ratings of major job components and decomposed ratings of specific tasks in each component in a job analysis of government aid workers. Three bogus tasks were added to the survey and the number of bogus tasks endorsed was the measure of carelessness. Morgeson et al. found that the number of careless responses was negatively related to the consistency between respondents’ holistic and decomposed ratings. They hypothesized that inconsistency in ratings and endorsement of bogus tasks were both indicative of respondent carelessness. Because they did not employ cutoffs to classify raters as careless or not, the rate of carelessness in this study is not known. Neither study used post hoc detection methods.
Historical Perspective on Survey Response Accuracy
The quality of survey data has long been a focus of research interest (Alwin, 2016). Recognizing the potential impact on reliability of data and the validity of
inferences drawn from data, researchers have studied response rates and response bias for decades (Johnson & Wislar, 2012). Response rate research primarily focuses on the adequacy of the respondent group as a representation of the population (Groves et al., 2009). To the extent that the respondents share characteristics of the population, generalizations of findings can be made with greater confidence. If respondents are not representative, results may provide a distorted view of the population (Anseel, Lievens, Schollaert, & Choragwicka, 2010). Response bias research focuses on conscious or unconscious response distortions, including socially desirable responding, faking,
agreeableness, and acquiescence (McGrath, Mitchell, Kim, & Hough, 2010). These have been studied extensively in the context of personality assessments such as the Minnesota Multiphasic Personality Inventory and the NEO-PI, where specific scales have been developed to flag incongruous data (Baer, Ballenger, Berry, & Wetter, 1997; Berry et al., 1992, 1991; Kelley et al., 2016; McCrae, Kurtz, Yamagata, & Terracciano, 2011;
Piedmont, McCrae, Riemann, & Angleitner, 2000). Rates of CI Responding
The exact extent of CI responding in survey research is difficult to determine. Studies have identified widely differing estimates of the rate of CI responding (Curran, 2016). Estimates outside the job analysis arena range from a low of 1% (Johnson, 2005)
to a high of 50.5% (Curran et al., 2010). In their seminal work on careless responding, Meade and Craig (2012) estimated that between 10% and 12% of survey responses could be identified as careless. Maniaci and Rogge (2012) identified between 3 and 9% of their respondents as highly inattentive. A more recent estimate derived from a review of existing literature estimated the rate of CI responding at 8% to 12% (Curran, 2016). Most recently, Steedle (2018) found that 43% of responses to a college readiness measure could be classified as careless by at least one of nine detection methods studied. Some of the variance in these estimates can be attributed to the different survey instruments studied, indices used, and cutoff thresholds applied.
Deterrence and Detection Methods
Two general classes of strategies exist for mitigating CI responding: deterrence and detection. Deterrence strategies focus on encouraging respondent to be careful and attentive throughout the survey process. Detection strategies focus on identifying CI responding after responses have been collected. The latter strategies employ
mathematical and logical analyses. Deterrence Strategies
The three most commonly used deterrence strategies are instructional manipulation checks (IMCs), instructed response questions, and the infrequency
approach. The IMC technique was developed by Oppenheimer, Meyvis, and Davidenko (2009). In this approach, a lengthy paragraph of text is provided along with appropriate answer choices. Embedded in the paragraph are instructions to respond in a specific way
unrelated to the response choices provided, for example, to select, I have read these instructions, a message placed in a different screen location than the response options. IMCs are designed to measure attentiveness in reading instructions. The assumption is that failing an IMC implies a lack of attention to survey instructions in general (Hauser & Schwarz, 2015). A limitation in this approach is that a respondent’s level of attention may not be consistent throughout a survey (DeSimone et al., 2015). Instructed response questions explicitly instruct survey takers to answer questions in a specific way, e.g., for this question, select strongly agree. The infrequency approach seeds surveys with highly improbable questions for which the answer is obvious, for example, I have been to every country in the world (Maniaci & Rogge, 2014). Incorrect answers imply that attention to such questions was minimal.
Detection Strategies
Detection strategies are post-hoc logical and mathematical processes for identifying CI responding in collected survey data. Because deterrence methods are intrusive and may not be well received by survey takers (Curran, 2016), and are not 100% successful in curbing CI responding, post-hoc measures provide an alternate and complementary means to identify careless responses. CI detection methods have been described in detail by Curran (2016), Huang et al. (2012), and Meade & Craig (2012). They can be grouped into conceptually related approaches: inconsistency, invariance, and outlier.
Inconsistency approach. The within-person inconsistency approach focuses on a single individual’s responses and their level of internal consistency (Curran, 2016). Several CI detection methods fall within this category. The first is the repeated items approach. When an item is repeated at different points in a survey, inconsistent responses can indicate inattention and lack of effort (DeSimone et al., 2015). In the semantic synonym and antonym approach (Goldberg & Kilkowski, 1985), items with near identical or near opposite meanings form item pairs. Inconsistent responding to these pairs similarly can indicate inattention. The premise of this approach is that careful respondents should correctly give identical or opposite answers to the pairs.
Psychometric synonyms and antonyms (Johnson, 2005) are pairs formed on the basis of high positive or negative intercorrelations, irrespective of item meaning. Odd-even consistency (Jackson, 1977), which Huang et al. (2012) refer to as individual reliability, is the correlation between odd and even numbered items in a scale. This approach is useful when applied to unidimensional scales. Newer methods of examining
intraindividual consistency, including polytomous Guttman errors and the inter-item standard deviation, are beyond the scope of this study. The interested reader is referred to Curran (2016) for a discussion of these methods.
The person-total correlation can be conceptualized as a measure of between-person consistency. This index is derived by inverting the item-total correlation matrix familiar in item analysis work to correlate an individual’s consistency in responding with the consistency of all other survey takers’ responses. The person-total correlation is
relatively unstudied to date. The only study I was able to locate (Dupuis, Meier, & Cuneo, 2018) found it to be a good predictor of simulated, non-human random responses.
Invariance approach. The invariance approach to CI response detection
assumes that sequential identical responses to numerous items in a response sequence suggests a lack of attention to nuances in the items rated. Long string analysis (Herzog & Bachman, 1981; Johnson, 2005) is the primary means of exploring data for invariant patterns. It simply involves identifying the longest string of identical responses. Curran (2016) refers to cases identified through long string analysis as the “low-hanging fruit of CI responders” (p. 8).
Outlier approach. The outlier approach is exemplified by the Mahalanobis
distance technique (Mahalanobis, 1936). Mahalanobis distance is a multivariate outlier detection technique, calculated by using the inverse of the variance-covariance matrix of the survey data (De Maesschalck et al., 2000). In recent studies, Mahalanobis distance has shown promise in detecting CI responding (Curran, 2016; Meade & Craig, 2012; Ward & Pond, 2015).
Other methods. Other methods not easily categorized as deterrence or detection
approaches are response time and self-report measures. Response time is frequently used as a proxy for survey attention, with the premise that quicker responding implies a more superficial level of processing. Self-report measures are single-item survey questions included at the end of the survey addressing level of effort expended or attention devoted (DeSimone et al., 2015).
Types of CI Responding
In their research on the MMPI, Nichols, Greene and Schmolck (1989) drew a distinction between two types of problematic responses: content responsive and content non-responsive. Content responsivity occurs when respondents deliberately select answers to create an impression, either by faking good or faking bad. Content non-responsivity occurs when the test taker’s response is unrelated to the item content. Data indicative of content non-responsivity includes patterned responding (e.g., selecting 1 to all questions on one page and selecting 2 to all questions on the next), random
responding, and invariant responding.
Meade and Craig (2012) were the first to identify the latter as careless or
inattentive responding in a two-study exploration of the phenomenon. In the first study, undergraduates took an Internet survey of 300 items from the International Personality Item Pool (IPIP; (Goldberg, 1999). Participants answered questions under one of three conditions: anonymity, required name identification, or warning regarding response integrity. Multiple indicators of CI responding were used. Within the survey, indicators included 10 infrequency items; self-report questions regarding levels of engagement, attention, and effort; and a final question regarding whether the respondent’s survey data should be used. Post-hoc measures were time to complete the survey, number of
infrequency items answered incorrectly, correlations between psychometric synonyms and antonyms, odd-even consistency, average and maximum length of long strings of invariant responses, and Mahalanobis distance.
Meade and Craig (2012) found that the different experimental conditions generated modestly differing amounts of CI responding, indicating that survey
administration factors can influence rates of carelessness. The rate across conditions and indices ranged between 10% and 12% of total responses. Regarding relationships among different indices, exploratory factor analysis yielded three factors. The first was
comprised of the consistency measures, Mahalanobis distance, and infrequency. The second was comprised of the self-report measures, and the third consisted of the two long string measures. This result suggested that there were different types of CI responding. Latent profile analysis of the post-hoc measures revealed that the measures were tapping into two different classes of responders. One was characterized by inconsistent
responding and the other by patterned responding. Independent replication confirmed this distinction (Huang et al., 2012; Maniaci & Rogge, 2014).
Meade and Craig’s second study was a simulation in which level of carelessness (full versus partial), type of carelessness (random versus patterned), and extent of carelessness (5%, 10%, or 15%) were manipulated. The goal was to explore how well psychometric synonyms, psychometric antonyms, odd-even consistency, and
Mahalanobis distance detected CI responding under these different conditions. The outlier index Mahalanobis distance had the highest sensitivity and specificity for uniformly distributed random data across all levels of carelessness, but was worst for detecting responses with partially random, normally distributed data. Under conditions of uniformly distributed careless data, the odd-even consistency index performed better