Vol. 8, No. 2, 2019, Pp. 81-87
Sentiment Analysis on New Currency in Kenya
using Twitter Dataset
Ibrahim Moge Noor
1, Metin Turan
2Department of Engineering, Faculty of Computer Engineering Istanbul Commerce University
Istanbul, Turkey 1[email protected], 2[email protected] Article History Received February 9th, 2020 Revised February 10th, 2020 Accepted March 19th, 2020
Abstract— Social media sites recently became popular, it is clear that it has major influence in society. Twitter is one of these sites, full of people’s opinions, where one can truck sentiment express about different kinds of topics. Sentiment analysis is one of the major interesting research areas nowadays. In this paper, we focused on Sentimental insight into the 2019 Kenya currency replacement. Kenyans citizens expressed their reaction over new banknotes. We perform sentiment analysis of the tweets from twitter using the Multinomial Naïve Bayes algorithm. We split our dataset using k-folder cross validation since we had limited amounts of data, so to achieve unbiased prediction of the model we obtained an average accuracy of 75.3%.
Vol. 8, No. 2, 2019, Pp. 81-87
I. INTRODUCTION
Sentiment analysis was started a long time before and still, there is a lot of research on this topic. It is a common application of natural language processing where the emotion of the writer extracted from data information is distinguished whether it is positive, negative or neutral [1]. Nowadays most people consider a lot of reviews, in order to drive meaningful data from people’s opinions we need to apply a different kind of machine learning. Demonetization is a withdrawal of currency from circulation and replaces the old currency to the new currency [2]. In early June 2019 during the celebration of Madaraka day, Kenya decided to withdraw 1000 Kenya shilling notes which are equivalent to 10 dollars from circulation by 1st October 2019. The change of old currency with the new one is something that started back in 2010 when the new constitution was promulgated, which mandated the change of currency. The 2010 constitution commanded the Central Bank of Kenya (CBK) to spearhead the creation of new notes which should be fashioned to allow the visually impaired to use them. The constitution forbids the utilization of an individual's picture on monetary standards. The old notes have images of the successor of the first president Daniel Arap Moi and first president Jomo Kenyatta, the most interesting thing is why the Central Bank of Kenya delayed for almost a decade for the fulfillment of the constitution. The Central Bank of Kenya claimed that its immediate decision was based on fighting corruption such as illicit financial flow and money laundering, but on another hand, the CBK central bank decision has faced strong headwind from the private sector, although it is their constitutional provision to command this altar of banknotes.
The central bank of Kenya off after its decision of new currency faced a legal suit; Kenyan activists filed one of them. They argued that the designs of the new generation currency notes were not subjected to public participation. It is in line with the requirements of the Kenyan Constitution, article 231 that was executed without involvement or participation of public, These responsibility instruments are introduced on the conviction that administrators are not just political on-screen characters but on the other hand are "open authorities” who ought to work openly on the eyes of public [3]. After demonetization in Kenya, people across the country post their view on demonetization on social media. Specifically, we use Twitter as a source of our data set.
Twitter [4] is one of the best online social network site. This microblogging service has also become an important source of real-time events. Up-to-date it has over 48.6 million active users and 330 million active users per month. It plays an important role in expressing our feelings [5], and its users can share either opinion or information about product, events or politics. Twitter is also one of the popular microblogging where user can post a short massage of about 280 characters [6].
Tweet feature:
● Length of a tweet: the maximum characters per tweet are 280 characters, even though some user use abbreviation like ‘b4’, ’ur’, ’u8’, ’g8t’, ’sry’, ’coz’,
’pic’ which is not meaningful grammatically correct sentence, it can be considered as a sentence.
● Language: people use twitter in various languages, though we just considered English language tweets besides Kenya being a multilingual country, 90% of Twitter users tweet in English.
● Hashtag: are formed by using the pound sign (#) in front of the word with no space and punctuation like #kenyanewcurrency, it makes conversation centred around the same topic easier to search, this helps us when we extract tweets from twitter.
In the past to find the personality of individual differences in characteristic patterns of thinking, feeling and behaving was time-consuming and less practical. It is since that person had to take personality tests and answers various question but an according to recent research the personality of an individuals can be found automatically by observing the sentence they wrote [7]. Web scraper with the help of twitter advanced search was used to extract tweets data from twitter [8], on a related topic as discussed above.
II. LITERATURE REVIEW
Sentiment analysis is the automated process of understanding an opinion about a given subject from spoken language or written. Sentiment analysis became a trending topic of various researches and text mining has been done in past years. Some of the papers studied are as follows: Multinomial Naïve Bayes method used specifically addressing recurrence in the content of the document. Multinomial Naive Bayes (MNB), the state of art of the Bayesian classifier is the best since it is a fast and simple text classifier. TF-IDF substitution relatively improved the performance of the general classifier [9], [10].
The supervised machine learning tends to be more accurate since each of the classifiers is trained on an assortment of representative data called corpus. However, the supervised machine learning depends on the quality of training data as well the type of algorithm used [11].
The polarity of tweets such positive and negative, neutral in tweets was studied. One of the techniques that sentiment analysis that can be conducted is a lexicon-based approach in which the dictionary is made out of a lot of positive and negative assessment words, used to score the tweets either, positive, negative or neutral [12].
Hegde et.al. implemented supervised algorithms. They compared different feature extraction determination which algorithm is best suited in terms of execution time for Sentiment Analysis based on the given dataset [13].
K-fold cross-validation was studied in [14]. Since we had limited amounts of data, we use k-Fold cross-validation so to achieve unbiased prediction of the model we perform k-fold cross validation.
Vol. 8, No. 2, 2019, Pp. 81-87
III. METHODOLOGY
A. Data Preprocessing
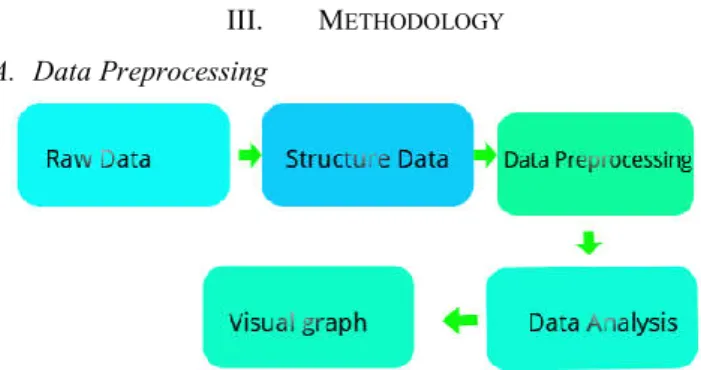
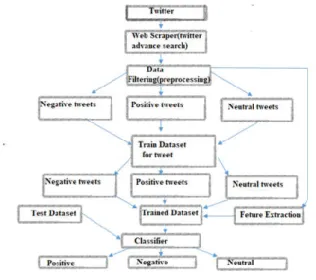
Figure 1. System Flowchart
Data Pre-processing: is a procedure that is utilized to change over the crude information into a clean data set. The data we extracted from twitter site was in raw format, which is not feasible for the analysis. Data Preprocessing is one way of preparing the data in a way that is suitable to analyse Figure 1. 1122 tweets were extracted from twitter, between 1st June to 11th October, although there was some shortage of tweets, the dataset was collected using web Scraper and twitter advanced search.it consisted of 436 negative tweets, 344 neutral tweets, and 342 positive tweets. The collected data was split into test and train datasets: 997 tweets for training and 125 for the test.
Demonetization data was collected between June and October, and then the gathered data was applied to important techniques in order to reduce the noise and dimensionality of sentences. The data was cleaned by removing symbols, non-English words, extra spaces, and numbers. Also, the collected tweets were mixed of hashtags ‘#’, URL links, annotation ’@’, also we remove the stop words, these are common words that don’t add value for classification such as and, either, to, the, so on. Stemming also was applied, we take out the root of the word.
B. Feature Extraction
The extracted tweets were stored in unstructured text format. This unstructured data supposed to change over meaningful data in order to feed it to a machine-learning algorithm. The algorithm needs numerical vectors and not textual data, in order to convert text into corresponding integers; the vectorization of the text file to numerical vectors is done utilizing the following approaches.
1) The Term Frequency–Inverse Document Frequency (TF– IDF)
A numerical measurement is aimed to reflect how important word is to corpus or a document. It is used in machine learning and text mining as a weighting plan in data recovery that has additionally discovered great use in archive characterization.
The weight increases as the frequency of a word in a document increases but it offsets by the frequency of the word in a document. The offset TF–IDF, which contains two elements term frequency and inverse document frequency, is calculated as follow:
● TF = (Frequency of a word in the document) / (Total of words in the document).
● IDF =Log ((Total number of documents) / (Number of documents containing the word)).
2) Count Vectorization
It gives a straightforward method to both tokenize collection of text documents and create a vocabulary of known words as well as encode new documents by utilizing that vocabulary, which will produce a sparse representation of counts. We use Count Vectorization in our dataset as follows. We created vectors that have a dimensionality equivalent to the size of our Sentiments, which is either negative, positive or neutral. Thus, if the content data features that sentiment word, we will put a one in that dimension and rest assign zero, each time we experience that word once more, we increased the count.
Figure 2. Train Words
As illustrated in Fig. 2, if the word is positive the first columns were assigned one. Otherwise, the second columns were assigned one and we assign all column zero for neutral words in case we did not find that word.
C. Sentiment Analysis of Tweets
It is estimated that 80% of the world's information is unstructured and not sorted out in a pre-characterized way. Thus, we should be able to guarantee the quality of these data. If data are qualified, we could extract information from the data.
One method to obtain information from data is to do sentiment analysis. Various methods can be used to implement sentiment analysis, see in Figure 3, which can be grouped as:
1) The automatic system depends on machine learning techniques to learn the data.
2) The rule-based system which performs sentiment analysis by a set of physically created principles. 3) The hybrid system combines both.
Machine learning and Rule-based system approach to address Sentiment Analysis are called Hybrid. We perform our twitter sentiment analysis using the Multinomial Naive Bayes algorithm, which is a type Naive Bayes, Naive Bayes classifier to get higher accuracy and we come up with a lexicon analysis that contains a word list, which is negative and positive.
Vol. 8, No. 2, 2019, Pp. 81-87
Figure 3. Sentiment analysis methods.
In order to classify the sentiment behind the tweets, count the negative and positive words to allocate a score for each tweet. In view of the score, the tweet will be classified into negative, positive and neutral. Extremity scores are additionally relegated to each tweet based emotional of tweets such as joy, sadness, happiness or anger likewise, and base on polarity such negative, positive and neutral.
D. Multinomial Naive Bayes method
Naive Bayes is a classification method, which is based on Bayes’ theorem. It is suitable for large data sets since it assumes independence between predictors. It also assumes that a feature in a class, which is not related to any other, is also fast; it only needs one pass over the data, Figure 4.
Figure 4. Sentiment Classification Based On Emoticons
We perform our sentiment categorization Multinomial Naïve Bayes that is a type of Naïve Bayes. Multinomial Naïve Bayes method used to represent the recurrence in the text of the document. It is a probabilistic classifier.
There are two fundamental methodologies to train our model in order to recognize the polarity tweets (positive, negative or neutral). A supervised, which is an object of interest
to gather labelled data, and train the algorithm, in a supervised way in which each word in a grouping relates to the result of in general sentence being positive, negative or neutral. This methodology requires physically marked data, which is regularly tedious, and not constantly conceivable. Unsupervised learning is that you do not give any past presumptions and definitions to the model about the result of factors you feed into it; you just supplement the information and need the model to become familiar with the structure of the data itself.
We found first the prior probability of our document by just dividing the number of documents of that class (either positive, negative and neutral) by the total number of the document.
P(c) = …(1) We calculate for the word given in a class, P (w|c) =
( , )
( ) | |, the Addison of 1 and v (vocabulary), for
smoothing purpose in case some word got zero counts, We have used the sum of logs to avoid underflow. Formula (2) does not use the sum of logs.
( ) ∝ ∏| | ( | ) . …(2)
Then, the application of the sum of logs produce Formula (3). Pr ( ) log ( Π Pr ( | ) | | =1). …(3)
IV. RESULT AND DISCUSSION
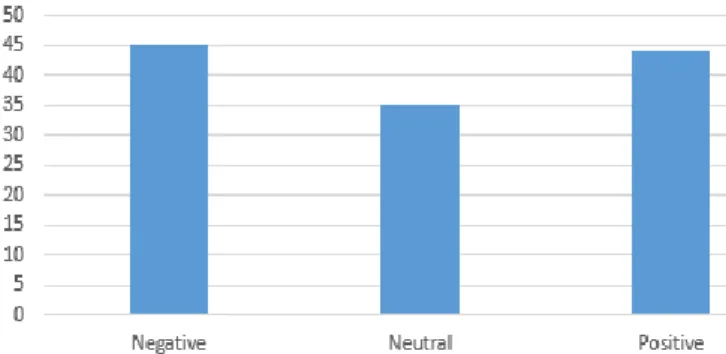
We have 1122 tweets from twitter, from June to October. The collected data was split into a test and train sets. We extracted tweets from twitter using web scraper with the help of twitter advanced search. Analyses were done on these marked datasets utilizing the term frequency-inverse document frequency (TF–IDF) extraction procedure. We use the framework where the pre-processor is applied to the raw sentences, which make it increasingly fitting to comprehend. The dataset collected was first split 89% for train data and 11% for test data as shown in Figure 5 and Figure 6 below and after test data was executed, as shown in Figure 7, an accuracy of 70.4% was obtained.
Vol. 8, No. 2, 2019, Pp. 81-87
Figure 6. Emotion Distribution of Test Data Set
Figure 7. Emotion Distribution of Predicted Data Set
▪ Cross validation
We implement k-cross validation in order find how accuracy our train model is. Since we divide our dataset into train and test sets randomly, whenever we change random state of splitting of dataset into train and test set, our model alter our output. Thus, our accuracy changes, to way out this problem we use K-cross validation.
▪ Confusion matrix
We use a confusion matrix to summarize the performance and prediction results of our classification algorithm, Confusion matrix it gives us a better idea of our classification model.
• Confusion matrix (error matrix) is a table format that permits visualization of the achievement of an algorithm, typically a supervised classification.
• Naïve Bayes is a supervised classification algorithm that is based on Bayes theorem, it follows a probabilistic approach, where the outcome output depends on a set of independent variables that are not related to each other, and predictor variables in machine learning mode are independent to one another. The principle behind Naïve Bayes is Bayes rule which calculates the conditional probability.
To validate our results, accuracy, precision, recall, and f1-score metrics are calculated.
Accuracy: Overall, how often is the classifier correct? Negative (N) - Observation is not positive Positive (P) - Observation is positive.
(FP) False Positive - Observation is negative, but is predicted positive.
(FN) False Negative (FN) - Observation is positive but is predicted as negative.
(TP) True Positive - Observation is positive and predicted to be positive.
(TN) True Negative - Observation is negative and is predicted to be negative.
Precision
● TP/total predicted positive. ● It is calculated as TP/ (TP+FP).
Recall
It calculates how many of the Actual Positives our model captures through labelling it as Positive: using the following formula. TP / (TP+FN).
F Score
This is a weighted average of the true positive rate precision and recall.it is calculated as 2TP/ (2TP+FP+FN).
For cross validation (k-fold), we use k=9, which is the most popular number of k. We randomly partition our dataset into K mutually exclusive subsets, with equal size. After we run the program we found below output
● Accuracy Score: 0.704 ● Confusion Matrix: [[30 6 8] [2 34 9] [5 7 24]] ● Result Report:
Vol. 8, No. 2, 2019, Pp. 81-87
From the above result, numbers 1, 2, and 3 before precision represent Sentiment polarities, Positive, negative and neutral respectively. We manage to get an accuracy average of 0.753.
V. CONCLUSION
In this paper, we perform twitter sentiment analysis to understand people’s opinions on demonetization. The gathered dataset, which was extracted from twitter using web scraper was about 1122 tweets. The data size was limited. We had to work on the small size, to avoid overfit models which can cause a poor result we applied k-fold cross validation. Multinomial Naive Bayes (MNB) algorithms are implemented. Analyses were done on these marked datasets utilizing the term frequency-inverse document frequency (TF–IDF) extraction procedure. We use the framework where the pre-processor is applied to the raw sentences, which make it increasingly fitting to comprehend and after tests data was executed, an average of 75.3% was obtained. As future work we will perform Sentiment analysis using N-gram, bigram, and trigram, in order to compare our classifications model and find the one with more accuracy.
REFERENCES
[1] B. Liu, Sentiment Analysis and Opinion Mining. 2012.
[2] “Demonetisation Decoded | A Critique of India’s Currency Experiment | Taylor & Francis Group.” [Online]. Available:
https://www.taylorfrancis.com/books/9781315160979. [Accessed: 29-Dec-2019].
[3] “Abuse of Power and Corruption in Kenya: Will the New Constitution
Enhance Government Accountability? on JSTOR.” [Online]. Available: https://www.jstor.org/stable/10.2979/indjglolegstu.18.1.341. [Accessed: 29-Dec-2019].
[4] “Twitter - Company.” [Online]. Available:
https://about.twitter.com/en_us/company.html. [Accessed: 29-Dec-2019].
[5] A. Agarwal, B. Xie, I. Vovsha, O. Rambow, and R. Passonneau,
“Sentiment Analysis of Twitter Data,” in Proceedings of the Workshop
on Language in Social Media (LSM 2011), Portland, Oregon, 2011, pp.
30–38.
[6] B. O’Connor, R. Balasubramanyan, B. R. Routledge, and N. A. Smith,
“From Tweets to Polls: Linking Text Sentiment to Public Opinion Time
Series,” in Fourth International AAAI Conference on Weblogs and Social
Media, 2010.
[7] G. Park et al., “Automatic personality assessment through social media language.,” Journal of Personality and Social Psychology, vol. 108, no. 6, pp. 934–952, Jun. 2015, DOI: 10.1037/pspp0000020.
[8] “[1803.09875] A Web Scraping Methodology for Bypassing Twitter API
Restrictions.” [Online]. Available: https://arxiv.org/abs/1803.09875. [Accessed: 29-Dec-2019].
[9] M. Abbas, K. A. Memon, A. A. Jamali, S. Memon, and A. Ahmed, “Multinomial Naive Bayes Classification Model for Sentiment Analysis,” p. 6, 2019.
[10] “Twitter’s Sentiment Analysis on Gsm Services using Multinomial
Naïve Bayes.: EKUAL Keşif.” [Online]. Available:
http://ezproxy.ticaret.edu.tr:2095/eds/pdfviewer/pdfviewer?vid=2&sid= e17af071-4179-4570-9a41-6c52275ba34a%40sdc-v-sessmgr02. [Accessed: 30-Dec-2019].
[11] P. Chaovalit and L. Zhou, “Movie Review Mining: a Comparison between Supervised and Unsupervised Classification Approaches,” 9th
Hawaii International Conference on System Sciences, p. 9, 2005.
[12] A. C. E. S. Lima, L. N. de Castro, and J. M. Corchado, “A polarity analysis framework for Twitter messages,” Applied Mathematics and
Computation, vol. 270, pp. 756–767, Nov. 2015, DOI:
10.1016/j.amc.2015.08.059.
[13] B. Hegde, “Sentiment analysis of Twitter data: A machine learning approach to analyze demonetization tweets,” vol. 05, no. 06, p. 7, 2018. [14] S. Yadav and S. Shukla, “Analysis of k-Fold Cross-Validation over Hold-Out Validation on Colossal Datasets for Quality Classification,” in 2016 IEEE 6th International Conference on Advanced Computing
![3 Chloro 6 {4 [3 (4 chlorophenoxy)propyl]piperazin 1 yl}pyridazine](data:image/gif;base64,R0lGODlhAQABAIAAAP///wAAACH5BAEAAAAALAAAAAABAAEAAAICRAEAOw==)