UCLA Previously Published Works
Title
Methods for fine-mapping with chromatin and expression data.
Permalink
https://escholarship.org/uc/item/3z78s87qJournal
PLoS genetics, 14(2)ISSN
1553-7390Authors
Roytman, Megan Kichaev, Gleb Gusev, Alexander et al.Publication Date
2018-02-26DOI
10.1371/journal.pgen.1007240 Peer reviewedAbstract
Recent studies have identified thousands of regions in the genome associated with chroma-tin modifications, which may in turn be affecchroma-ting gene expression. Exischroma-ting works have used heuristic methods to investigate the relationships between genome, epigenome, and gene expression, but, to our knowledge, none have explicitly modeled the chain of causality whereby genetic variants impact chromatin, which impacts gene expression. In this work we introduce a new hierarchical fine-mapping framework that integrates information across all three levels of data to better identify the causal variant and chromatin mark that are concor-dantly influencing gene expression. In simulations we show that our method is more accu-rate than existing approaches at identifying the causal mark influencing expression. We analyze empirical genetic, chromatin, and gene expression data from 65 African-ancestry and 47 European-ancestry individuals and show that many of the paths prioritized by our method are consistent with the proposed causal model and often lie in likely functional regions.
Author summary
Genome-wide association studies (GWAS) have revealed that the majority of variants associated with complex disease lie in noncoding regulatory sequences. More recent stud-ies have identified thousands of quantitative trait loci (QTLs) associated with chromatin modifications, which in turn are associated with changes in gene regulation. Thus, one proposed mechanism by which genetic variants act on trait is through chromatin, which may in turn have downstream effects on transcription. In this work, we propose a method that assumes a causal path from genetic variation to chromatin to expression and inte-grates information across all three levels of data in order to identify the causal variant and chromatin mark that are likely influencing gene expression. We demonstrate in simula-tions that our probabilistic approach produces well-calibrated posterior probabilities and outperforms existing methods with respect to SNP-, mark-, and overall path-mapping.
a1111111111 a1111111111
OPEN ACCESS
Citation: Roytman M, Kichaev G, Gusev A,
Pasaniuc B (2018) Methods for fine-mapping with chromatin and expression data. PLoS Genet 14(2): e1007240.https://doi.org/10.1371/journal. pgen.1007240
Editor: Barbara E. Stranger, University of Chicago
Department of Medicine, UNITED STATES
Received: June 15, 2017
Accepted: February 2, 2018 Published: February 26, 2018
Copyright:©2018 Roytman et al. This is an open access article distributed under the terms of the
Creative Commons Attribution License, which permits unrestricted use, distribution, and reproduction in any medium, provided the original author and source are credited.
Data Availability Statement: All genome,
epigenome, and gene expression data were obtained from a previous study by Grubert et al. at
http://mitra.stanford.edu/kundaje/portal/ chromovar3d/index.html.
Funding: This work was funded in part by National
Institutes of Health (NIH), under awards 1R01HG009120, R01HG006399, U01CA194393. The funders had no role in study design, data collection and analysis, decision to publish, or preparation of the manuscript.
Introduction
Discerning the genetic and molecular basis of complex traits is a fundamental problem in biol-ogy. Genome-wide association studies have revealed that the majority of variants associated with disease lie in noncoding regulatory sequences [1,2]. Identifying the target genes of these variants and the mechanisms through which they act remains an open problem [3]. Recent efforts to systematically characterize how genetic variation impacts more granular molecular phenotypes have yielded thousands of single nucleotide polymorphisms (SNPs) that associate with local and distal histone modifications—termed histone quantitative trait loci (hQTLs) [4–
7]. Furthermore, recent studies have identified many expression quantitative trait loci (eQTLs) that co-localize with hQTLs, implying there may exist a shared genetic influence on epigenetic traits and gene expression [8–11]. Therefore, one proposed mechanism by which regulatory variants may affect gene expression and thereby impact traits is through changes in chromatin state [10]. However, this putative chain of causality whereby the effects of SNPs on expression are mediated by chromatin modifications has yet to be established. This is further com-pounded by the complex space of plausible causal directions connecting transcription factor binding, DNA methylation, chromatin variation, and gene expression. Since laboratory experi-ments are very costly, there is a need for statistical methods that can accurately prioritize the causal SNP and chromatin mark within an implicated region under a plausible causal model. However, even if the causal direction is given, pinpointing the exact SNP and mark within a genomic region is very challenging due to the confounding effects of linkage disequilibrium (LD) among SNPs and correlations among marks [5,6,10,12–14].
Methods to investigate the relationships between the genome, the epigenome, and expres-sion have largely focused on quantifying the overlap between hQTLs and eQTLs [10,14,15]. Previous studies have sought to identify hQTLs by selecting the SNP with the strongest p-value for association to a local chromatin mark and to local gene expression [10,14,15]. Moreover, various methods exist for the fine-mapping of SNPs that may be concurrently affecting two traits, including eCAVIAR [16] and Coloc [17]. Although these methods can be applied to jointly analyze SNP, chromatin, and expression data, they do not model the causal path whereby SNPs impact expression through chromatin alteration.
Here we propose a fine-mapping framework,pathfinder, that explicitly models the hierar-chical relationships between genome, chromatin, and gene expression to predict both the causal SNP and the causal mark within a gene region that are influencing expression of a given gene. Our framework assumes a causal model where a SNP impacts a chromatin which in turn alters gene expression. In our framework we refer to a “causal” SNP as any SNP that disrupts inter-individual variation of chromatin state either through a direct biological mechanism (e.g., chromatin accessibility) or indirectly through an unobserved biological mechanism. Sim-ilarly, we refer to a “causal” chromatin mark as either a mark that biologically alters expression or that tags an underlying epigenetic regulatory mechanism of expression. Our framework takes as input the strength of association (as quantified through the standard Z-scores) between all SNP/mark pairs and all marks to expression as measured in a given set of individu-als. To explicitly account for the correlation structure among SNPs and marks, we use a Matrix-variate Normal distribution to model all Z-scores jointly. By construction, this allows our probabilistic model to assign posterior probabilities for each SNP, mark, and path (where paths include all possible SNP-mark combinations) to be causal in the region. A key advantage of our approach is that it produces well-calibrated posterior probabilities for causality. Thus, pathfindercan be used to prioritize variants and marks for validation experiments.
In simulations we compare against several existing methods, demonstrating that path-finderoutperforms alternative approaches with respect to both accuracy and calibration.
Competing interests: The authors have declared
Results
Overview of hierarchical fine-mapping with genetic, chromatin, and gene
expression data
Here we introduce a hierarchical statistical method for fine-mapping of causal SNPs and chro-matin marks (e.g., histone modifications) that may be concordantly influencing gene expres-sion within a genomic region. We build upon previous insights that a vector of Z-scores is well-described by a Multivariate Normal (MVN) distribution parameterized by LD [13,18,19] to model association statistics between chromatin marks and gene expression. We analyze all chromatin peaks across four mark types (DHS, H3K4me1, H3K4me3, and H3K27ac) jointly in the same framework; we refer to a “mark” as a chromatin peak at a particular location, and “mark types” as DHS, H3K4me1, H3K4me3, and H3K27ac. To simultaneously take into account both SNP LD and the correlations between chromatin marks, we use the Matrix-vari-ate Normal distribution to jointly model association statistics between all SNPs and marks within a region. Our method takes as input SNP-mark and mark-expression associations within a region centered around a particular gene, as well as correlations among all SNPs (LD) and correlations among all considered marks.Pathfinderenumerates over all possible causal paths, considering one causal SNP and one causal mark for each path, and outputs a posterior probability for each path to be causal, which can subsequently be used to prioritize SNPs and marks for validation. We compute marginal probabilities for individual SNPs (or marks) to be causal by summing the posterior probabilities over all paths that contain the SNP (or mark). For simplicity, in this work we refer to a “causal” mark as a mark that either causally drives inter-individual variation of gene expression or is correlated to an underlying causal mecha-nism (e.g. transcription factor binding), though it may not be biologically causal for
expression.
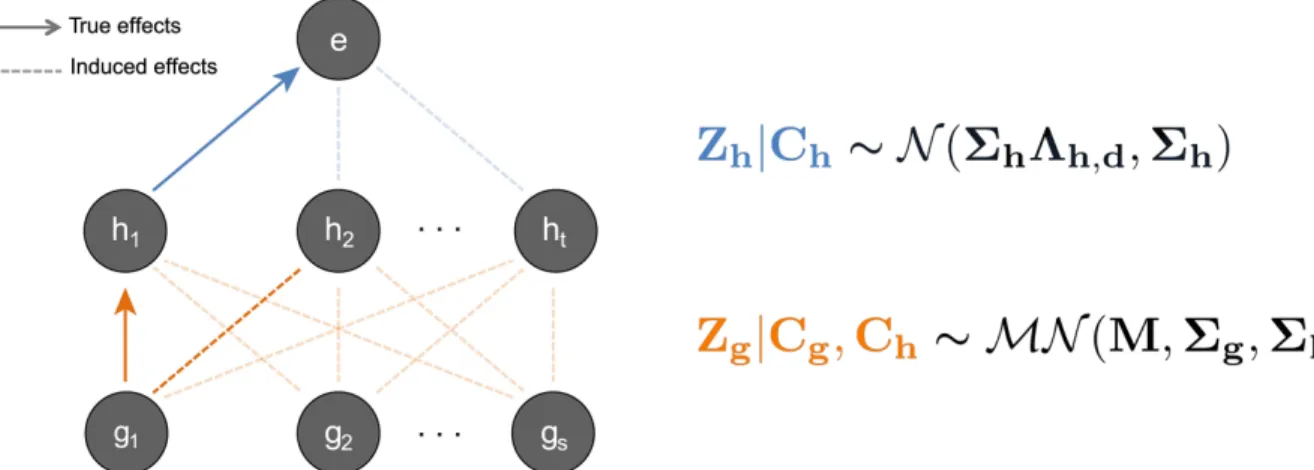
The advantage of our method over existing approaches is that it integrates mark-expression associations which may help distinguish between two paths with otherwise comparable evi-dence for causality. We illustrate a scenario inFig 1. Consider a genetic region where SNPg1
has a strong association with two local marksh1andh2, as well as a significant association with
gene expression. Using only SNP-mark and SNP-expression effects, we are unable to discern whether SNPg1influences expression through markh1orh2. However, if we consider
mark-expression effects, we see that markh1has a strong association with gene expression where
markh2does not. This additional information helps support the hypothesis that there is a
Pathfinder improves fine-mapping performance
We used simulations to comparepathfinder’s performance against alternative methods with respect to SNP-, mark-, and path-finding efficiency as well as the calibration of its posterior probabilities. We generated genetic, chromatin, and gene expression data for 10,000 50kb regions, each centered around a single gene, over 100 individuals, using SNP LD and mark correlations derived from 65 Yoruban (YRI) individuals (seeMethods). We define a “mark” as an individual peak location for any mark type in the dataset (DHS, H3M4me1, H3K4me3, or H3K27ac). For each gene, we randomly assigned a single causal pathway from one SNP to one mark to gene expression. We then ran our methods on all regions individually and assessed their ability to correctly prioritize the true causal path in each region (Methods).
We compare against an independent fine-mapping approach (whereby we fine-map SNP-mark associations and SNP-mark-expression associations independently and take the product of the resulting probabilities to produce posterior probabilities for paths), a Bayesian network analysis [20], a naive ranking (where we rank SNP-expression and mark-expression associa-tions to prioritize SNPs and marks within a region; for path-finding, we rank the product of these two), a formal colocalization method [17], and finally, against overlaps between eQTLs and hQTLs within a region centered around a gene of interest (seeMethods). Unlike the first four approaches, the overlap methods do not produce rankings, but yield candidate sets of causal SNPs, marks, and paths. For this reason, we present these results in a separate analysis using an alternative metric for comparison.
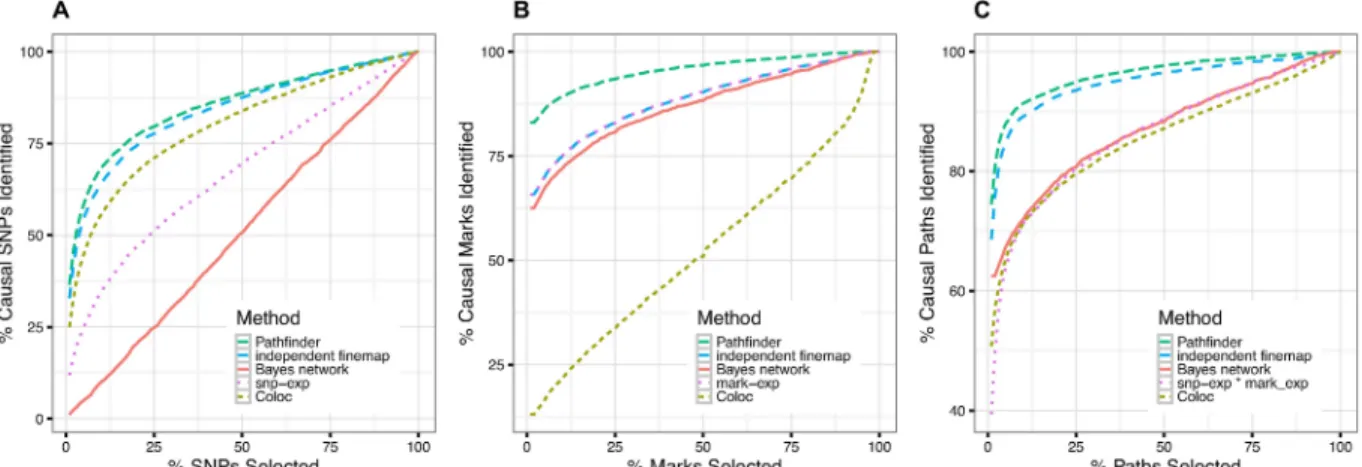
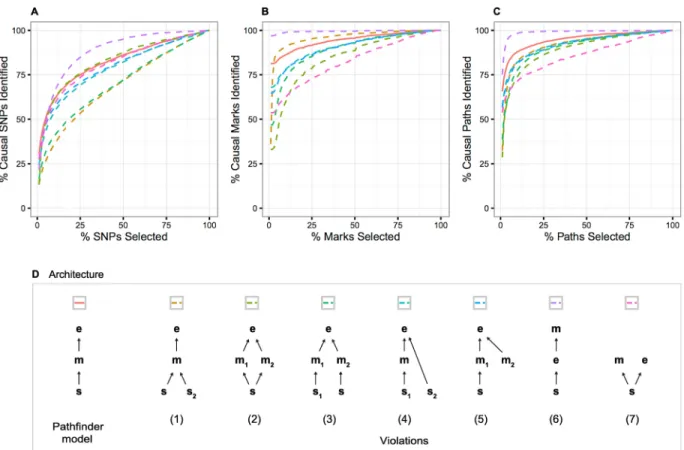
We find thatpathfinderhas consistently better performance than the other ranking
approaches with respect to all three features—SNP-, mark-, and path-mapping within a region (Fig 2). For example, association ranking, Coloc, Bayesian network analysis, and independent fine-mapping accumulate 55%, 62%, 47%, and 13% of the top paths on average in order to recapture 90% of the causal paths, whereas our method only requires 8% of the top paths. Note that SNP-expression association ranking is equivalent to running a basic eQTL analysis, which does not take into account chromatin data, in order to identify causal SNPs. A similar improvement in accuracy was observed for the size of the credible sets, defined as the number of SNPs required to capture a given percentage of the causal variants (S1 Table).
Fig 1. Schematic of hierarchical model whereby SNPs affect histone marks, which in turn affect gene expression. We illustrate a scenario where SNPg1and markh1are causal. All other induced correlations, such as the effect ofg1onh2, are an effect of LD and/or correlations among
marks. To the right we show our mathematical model for this hierarchical framework. On the top level, we model mark-expression associations with a Multivariate Normal (MVN) distribution. On the bottom, we jointly model all associations between all SNPs and marks with a Matrix Variate Normal distribution (seeMethods).
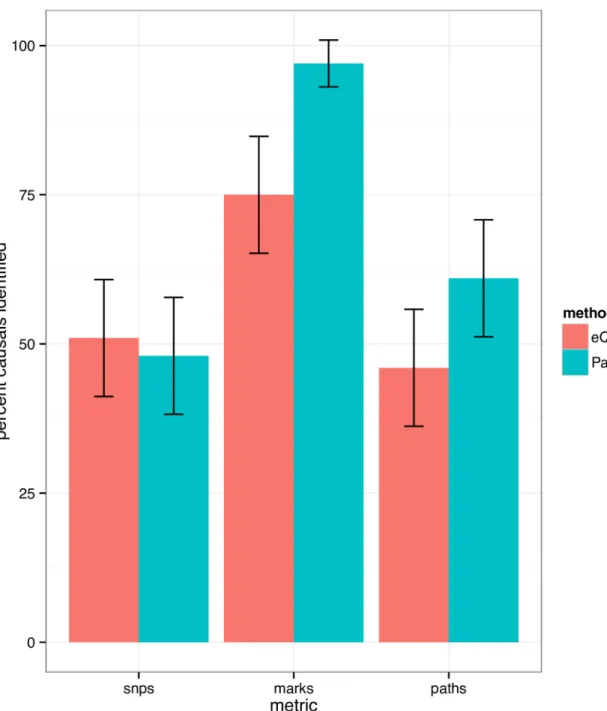
Next, we evaluatedpathfinder’s performance compared against standard analyses that investigate overlaps between hQTLs and eQTLs within a genomic region. In such experiments, the variant with the strongest association to each local chromatin mark is selected, as well as the variant with the strongest association to local gene expression. In addition, marks are fil-tered to ensure a 10% FDR (seeMethods). This produces a set of candidate marks, as well as one candidate SNP per mark, and one SNP deemed causal for gene expression in the region. Implicitly, the overlap of these variants suggests a set of candidate SNPs, marks, and paths for the region. For the same set sizes,pathfinderidentifies 96% of the causal marks versus 74% in the standard overlap approach (Fig 3). SNP-finding accuracy is comparable between the two methods.
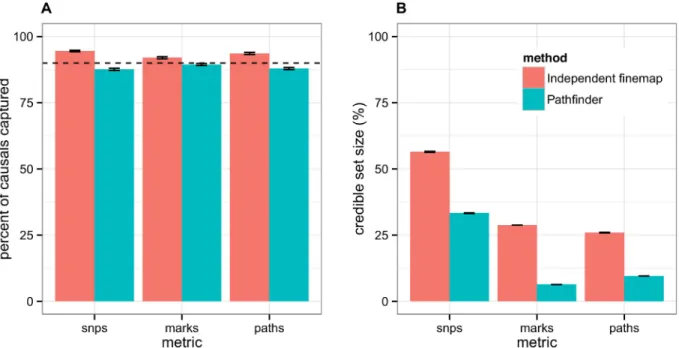
We next assessed the calibration of the posterior probabilities for causality output by path-finder. Our method has slightly deflated credible sets for SNP- and path-finding, but well-cali-brated credible sets for mark-finding (Fig 4). In contrast, the independent fine-mapping approach has consistently inflated credible sets—that is, it captures more causal paths than expected, but also has drastically larger credible set sizes. For example, when accumulating 90% of the posterior probabilities over all regions,pathfindercaptures 88% of the true causal paths within the top 380 candidate paths, whereas independent fine-mapping captures 94% of the causal paths within the top 1026 candidate paths. Similar outcomes were attained for the 50% and 99% credible sets (S1 Fig). Overall,pathfinder’s credible sets are less biased and nar-rower than those obtained through the independent fine-mapping approach.
Finally, we investigated the effects of simulation and method parameters onpathfinder’s accuracy. Firstly, we varied the causal SNP and mark effect sizes such that the variance explained of mark and gene expression ranged from 0.1 to 0.5. As anticipated, increased heri-tability leads to better performance (SeeFig 5A–5C). Secondly, in order to assess the impact of SNP LD and mark correlations on SNP- and mark-finding performance, we stratified our existing simulations based on the mean correlation of the causal SNP or mark to all other SNPs or marks (SeeFig 5D–5I). We grouped our simulations into three categories: low, medium, and high correlations. As anticipated, SNP-finding performance decreases slightly as SNP LD increases. Notably, mark-finding performance is actually improved at higher SNP LD. This is due to the redundancy in information about SNP-mark associations at the causal mark when these effects are exhibited across multiple correlated SNPs. SNP- and mark-finding
Fig 2. Comparison of our method against four potential competitors—Independent fine-mapping, a simple ranking of associations, Coloc, and Bayesian network analysis. We measure performance as the number of simulated causal SNPs, marks, and paths that each method is able to recapture, while varying the number of SNPs, marks, or paths considered.
performance, however, do not seem to be significantly affected by mark correlations in our simulations—at least not at the level of variation exhibited in our data. In addition to stratify-ing our existstratify-ing simulations by LD, we also assessed the impact of usstratify-ing European rather than African LD in the same regions, as European LD is known to be more extensive. Here we retained the YRI mark and expression data in order to isolate the effect of SNP correlations. The credible set sizes computed from the CEU dataset do not substantially differ from those obtained in YRI (S2 Table). This result demonstrates that the more extensive LD observed in European individuals will not significantly affectpathfinder’s performance. Thirdly, we
Fig 3. Comparison of our method to standard eQTL + hQTL overlap analyses. In overlap analyses, only the top SNP for association to each histone mark and gene expression is considered. We demonstrate significant gains in our method with respect to mark-finding accuracy, where SNP-mapping performance is comparable between the two methods.
evaluated the effect of the prior variance tuning parameter on fine-mapping performance (See
Fig 5J–5L). The prior variance is an estimate of the variance explained by the causal SNP and mark in the region, as we do not know a priori what the causal effect sizes are. We show that the optimal range for the prior variance parameters is between 5 and 10, in simulations with a variance explained of 0.25 on both levels. Overall, performance does not seem to change drasti-cally in response to variations in the prior variance, even significantly outside of this optimal range.
Violations of the model
Our hierarchical model makes several key assumptions that may sometimes be violated in empirical data. Firstly,pathfinderassumes that a single causal SNP and a single causal mark are driving the associations within a region, where in reality there may exist multiple true causal SNPs or marks [13,19]. Secondly,pathfinderassumes that SNP effects on gene expres-sion are mediated by a chromatin mark, which may not be the case in real data. We therefore assessed the performance of our method when these two assumptions are violated in various ways, diagrammed inFig 6.
First, we investigate violations 1–3, which include multiple causal pathways throughout the region. Path-mapping accuracy, measured by the proportion of causal paths identified, is reduced in all three scenarios (Fig 6). Note that the number of causals identified does not nec-essarily decrease, but rather the proportion, as there are more causal paths in each region. SNP- and mark-finding accuracy under these violations are also compromised, but with two notable exceptions. In the multi-causal-SNP scenario, mark-finding accuracy increased in comparison with the single-SNP simulations; for example, only 8% of marks were selected (versus 18% in the single causal simulations) to capture 90% of the causal marks. In the
multi-Fig 4. 90% credible sets for SNP-, mark-, and path-mapping. We comparepathfinderto the technique of independently fine-mapping the two levels of data, with respect to (A) the calibration of their credible sets and (B) the size of their credible sets. In (A), we compare the proportion of causal variants that were captured in the 90% credible sets usingpathfindervs. independent fine-mapping against the expected proportion (represented by the dotted line). In (B), we display the corresponding sizes of these credible sets.
Fig 5. Performance of our method as we vary levels of variance explained, SNP LD, mark correlations, and the prior variance parameter. (A-C) We simultaneously vary the variance explained by SNP and mark from 0.1 to 0.5 per region. (D-I) We stratified based on mean SNP/mark correlations at the causal SNP/mark. (J-L) We show thatpathfinderis not sensitive to variations in our prior variance parameter.
causal-mark scenario, SNP-finding accuracy increased. Intuitively, this is due to the redun-dancy in the signal that is captured by the Matrix-variate Normal distribution.
We next investigate violations 4–5, in which an additional SNP or mark influences gene expression directly. We observe in these two scenarios that performance is reduced for SNP-, mark-, and path-finding, but not drastically. For example, in order to capture 90% of the causal paths,pathfindermust select on average 25% and 28% of paths under violations 4 and 5, respectively (compared with 15% under standard simulations). Because anti-correlated marks (e.g. activating and repressing marks) often tend to act in the same region, we also assess path-finder’s behavior specifically when two marks have opposite effects on expression. As expected, pathfinder’s performance does not decline in the presence of anti-correlated peaks (S2 Fig).
Finally, we discusspathfinder’s performance under violations where the causal order is modified (violations 6–7). Under violation 6, where a single causal SNP affects gene expression directly, which in turn affects a single mark,pathfinderactually captures a higher proportion of the affected marks and overall paths. For example, in order to capture 90% of the causal paths,pathfindermust select on average only 3% of the top-ranked paths (compared with 15% under standard simulations). In violation 7, where the SNP has independent effects on the mark and the gene expression, we show thatpathfinder’s accuracy in finding the causal mark and path is significantly reduced. Note that in this case, the “path” is not truly a path but a
Fig 6. Performance of our method under violations of the causal model. (A-C)pathfinder’s SNP-, mark-, and path-mapping accuracy for standard simulations compared with seven model violations. (D) The model violations include the following scenarios: (1) multiple causal SNPs impact a single causal mark, which affects gene expression, (2) a single SNP impacts multiple causal marks, which both affect gene expression, (3) two SNPs affect two marks (respectively), which both impact gene expression, (4) a single causal SNP impacts a single causal mark that affects gene expression, with an additional SNP also impacting gene expression directly, (5) a single causal SNP impacts a single causal mark that affects gene expression, with an additional mark also impacting gene expression, (6) a single causal SNP affects gene expression directly, which in turn affects a single mark, and (7) a single causal SNP has independent effects on a single mark and gene expression.
SNP/mark pair, as effects of the SNP on mark and gene expression are independent. Our power in distinguishing between these two models depends on the prior variance explained parameter. Under violation 7, the variance explained in gene expression by the causal mark is much smaller than expected, thus reducing our confidence in the true causal configuration. We conclude that under the SNP!expression!mark violation,pathfinderwill identify causal paths very confidently even if they do not follow the assumed SNP!mark!expression model. Therefore a high posterior probability for a path may not be sufficient evidence for causality. On the other hand, when SNP effects on mark and expression are independent,pathfinderis less likely to produce false positives. For these reasons, we recommend a pre- or post-filtering step to retain only those regions that show some prior evidence for the SNP!mark! expres-sion model using a conditional analysis or partial correlation approach (Methods).
For completeness, we also assess existing methods under these simulations (S3 Fig). Most notably, the simple association-ranking approach shows a distinct improvement under viola-tions 6 and 7, in which SNPs have a direct effect on gene expression. This is expected as path-finderassumes the causal effect to be mediated by chromatin. A similar improvement can be observed for Coloc under violation 7, in which the SNP affects both chromatin and gene expression directly.
Empirical data analyses
We evaluated the behavior of our hierarchical fine-mapping method when applied to empirical data. We performed these analyses on data from 65 YRI individuals whose genotypes were obtained through 1000 Genomes, and whose PEER-corrected H3K4me1, H3K4me3,
H3K27ac, DHS, and RNA expression levels in lymphoblastoid cell lines (LCLs) were obtained from [10]. In each region, we analyzed all four mark types jointly (H3K4me1, H3K4me3, H3K27ac, and DHS) by including all peaks spanning the region for each mark type. Each peak of each mark type was therefore treated as a single chromatin mark. We filtered the 14,669 regions using a two-step regression analysis to yield 1,317 regions that showed evidence for the sequential model of SNPs affecting histone marks which in turn affect gene expression (see
Methods).pathfinder’s runtime scales approximately ass3t3, wheresandtare the number of SNPs and marks within a region, respectively. On average, each 50kb region contained 160 SNPs and 25 marks. Most runs were completed in under a few minutes. The most dense region contained 331 SNPs and 66 marks and took approximately 21 minutes (S4 Fig).
InTable 1, we report the average 50%, 90%, and 99% credible set sizes produced when run-ningpathfinderon real data. We compare against basic eQTL mapping, where we fine-map SNPs to gene expression ignoring chromatin data. We show that the credible set sizes are sig-nificantly narrower when runningpathfinderwith all three levels of data, consistent with our findings in simulations. For example, eQTL mapping requires an average of 45.3 SNPs in order to capture 90% of the posterior probability for SNP causality, whereaspathfinderonly requires 28.4 SNPs. If we define a gene to be fine-mapped if 99% of the posterior probability mass for SNP causality is contained within the top 10 SNPs or fewer, then standard eQTL mapping fine-maps 46 of the genes in our data, whereaspathfinderfine-maps 73 of the genes.
Table 1. 50%, 90%, and 99% credible sets for SNP-, mark-, and path-mapping for real data analysis. We comparepathfinderto basic eQTL mapping, with respect to the size of their credible sets, averaged across all regions. Standard errors are included next to each measurement.
method 50% credible set 90% credible set 99% credible set SNPs Marks Paths SNPs Marks Paths SNPs Marks Paths
pathfinder 4.9 (0.2) 1.0 (0.0) 7.4 (0.3) 28.4 (1.1) 1.8 (0.1) 158.4 (6.0) 64.2 (2.4) 6.3 (0.2) 765.5 (29.0)
eQTL mapping 8.1 (0.3) - - 45.3 (1.7) - - 92.9 (3.6) -
type in aggregate over all regions (S3 Table). H3K4me3 is the most informative mark type in this data, capturing 31% of the total probability mass despite being the least prevalent of all four mark types, constituting only 13% of all marks.
We also report the size ofpathfinder’s credible sets when applied to empirical CEU data rather than YRI inTable 2. These two datasets are not directly comparable, as the types of epi-genetic marks and their quantities differ substantially. Nonetheless, we demonstrate that path-finder’s performance on the CEU dataset does not drastically diverge from its behavior in YRI. Data pre-processing strategies such as PCA and PEER correction may substantially impact the number of mark-expression correlations that are retained [21]. We find that credible set sizes for PEER-corrected data are narrower, giving a slight but significant improvement in perfor-mance (S4 Table).
As our pre-filtering step was designed to preserve only regions in which SNP effects on gene expression are mediated by chromatin, we expected a large majority of the analyzed regions to show evidence for this mechanism. To confirm this, we investigated whether the top paths prioritized by our method demonstrate consistency with this causal model. We defined a set of top paths as those which were ranked first in a region and whose posterior probabilities for causality were assigned bypathfinderto be greater than 0.1. This resulted in 480 total top paths. Out of 480 top paths, only 12 had a significant (p<0.05/480) partial correlation between SNP and gene expression after controlling for chromatin. However, 193 paths had a significant partial correlation between SNP and chromatin after controlling for gene expression. This finding suggests that the top paths are more consistent with the SNP!mark!expression model than with a SNP!expression!mark model.
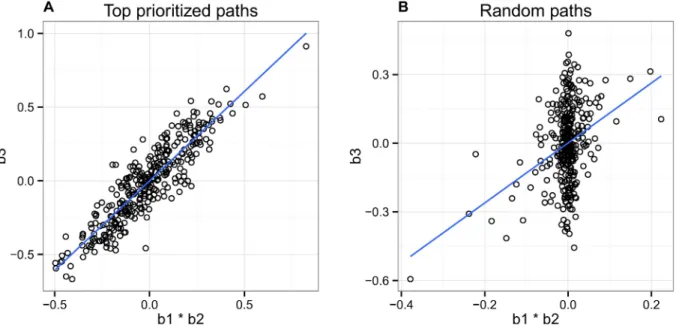
Next we examined the relationship between the product of the effect sizes between SNP-mark and SNP-mark-expression against the overall SNP-expression association (Fig 7). We expect this relationship to be correlative; if truly mediated by the mark in question, the overall SNP-expression effect size should be proportional to the product of the two contributing effect sizes. Note that we weight our correlation by the reported posterior probability for each path, such that the paths we have more confidence in will contribute more to this metric. We find a
Table 2. 50%, 90%, and 99% credible sets for SNP-, mark-, and path-mapping for simulations using empirical YRI and CEU data. We comparepathfinder’s perfor-mance when using SNP LD from YRI vs from CEU, with respect to the size of its credible sets, averaged across all regions. Standard errors are included next to each measurement.
method 50% credible set 90% credible set 99% credible set SNPs Marks Paths SNPs Marks Paths SNPs Marks Paths YRI 4.9 (0.2) 1.0 (0.0) 7.4 (0.3) 28.4 (1.1) 1.8 (0.1) 158.4 (6.0) 64.2 (2.4) 6.3 (0.2) 765.5 (29.0) CEU 7.4 (0.3) 1.0 (0.0) 10.6 (0.4) 30.1 (1.1) 1.3 (0.0) 90.1 (3.3) 59.5 (2.2) 2.8 (0.1) 269.6 (9.8)
high correlation (r = 0.91) between these effect size vectors for our top paths, as compared with a correlation of r = 0.36 when running the same analysis on random paths within each region. This result indicates thatpathfinderis identifying many pathways that are likely to be following its causal model.
InTable 3, we list the top ten paths prioritized bypathfinderacross all real data regions. Most SNPs implicated in these paths are known to alter several regulatory motifs and often lie in an enhancer region or a promoter region of the genes whose expression they affect. 59% (s.e. 2%) of the SNPs implicated in the top paths fall into active ChromHMM states (1–7) in LCLs, including active TSS, flanking active TSS, transcription at gene 5’ and 3’, strong tran-scription, weak trantran-scription, genic enhancers, and enhancers. Only 47% (s.e. 2%) of random
Fig 7. Relationship between the product of the SNP-mark and mark-expression effect sizes against the overall SNP-expression effect size. (A) We observe a high correlation (r = 0.91) between these effect size vectors, indicating that our method is identifying many pathways that are likely to be following our causal model. Here we included only the top paths whose posterior probabilities for causality were assigned to be greater than 0.1. (B) We show that a significant correlation does not exist for randomly chosen paths.
https://doi.org/10.1371/journal.pgen.1007240.g007
Table 3. Top causal paths produced by real data analysis. For each path, we report the chromosome, the RSID of the implicated SNP, the implicated mark type, the poste-rior probability we assigned to this path, three Z-scores (SNP to mark association, mark to expression association, SNP to expression association), the GENCODE gene around which this region was centered, the ChromImpute [24] annotation for the SNP, and the number of regulatory motifs altered by the SNP, as designated by HaploReg [25].
chr rsid mark type posterior SNP-mark Z mark-exp Z SNP-exp Z gene chromatin state motifs altered 12 rs835044 H3K27ac >0.99 -13.05 4.97 -4.65 NDUFA12 1TssA 5
1 esv3587154 H3K4me1 >0.99 -18.13 17.40 -14.97 GSTM1 15Quies
-19 rs385895 H3K4me1 >0.99 12.60 2.41 1.50 CLC 7Enh 3
15 rs8025332 H3K4me1 >0.99 -12.07 2.11 -2.35 CELF6 15Quies 1 5 rs1217817 H3K4me1 >0.99 -14.59 5.58 -4.52 MAP1B 7Enh 4 1 rs7417106 DHS >0.99 -8.62 -0.16 -0.54 C1orf170 4Tx 22 1 rs111900551 H3K4me3 >0.99 -8.82 2.26 -2.95 CLCNKA 15Quies 18 3 rs57339700 H3K4me1 >0.99 -9.66 2.37 -2.29 CAND2 14ReprPCWk 5 6 rs9349050 H3K4me3 >0.99 -12.47 10.80 -8.19 MDGA1 11BivFlnk 2 3 rs6763025 H3K4me1 >0.99 10.59 -2.21 -2.18 PRSS50 7Enh 4
paths fall into these active states (p = 0.001834). Moreover, on average, SNPs in the top paths disturbed 5.35 (s.e. 0.26) regulatory motifs, whereas random SNPs chosen at the same regions only disturbed 4.40 (s.e. 0.20) motifs on average (p<0.001). We did not, however, observe a similar change in transcription factor binding affinity at these motifs (δ= 5.26 vsδ= 5.27, (p = 0.511)). As an example, inFig 8A–8D, we display the genomic context for the top region reported bypathfinder, including average mark signals for DHS, H3K4me1, H3K4me3, and H3K27ac, stratified by genotype, in a 4kb region centered around the TSS of the NDUFA12 gene. The implicated SNP lies within the NDUFA12 TSS.Fig 8Eplots the gene expression sig-nal against that of the top mark, stratified by genotype. InS6 Fig, we show associations for the top region reported bypathfinder, spanning a 50kb region centered around the NDUFA12 TSS.
Fig 8. Genomic context of top path reported bypathfinder in real data. (A-D) Mark signals for DHS, H3K4me1, H3K4me3, H3K27ac in a
4kb region centered around the NDUFA12 TSS, stratified by genotype. The implicated SNP, signified by the vertical dotted line, lies 6bp downstream of the gene TSS, and falls within an H3K27ac peak, which is also the top mark reported bypathfinder. The posterior probability for causality for this peak was greater than 0.999. (E) Relationship between the H3K27ac peak signal and gene expression, stratified by genotype.
Next we examined the spatial relationships between the SNP, mark, and TSS implicated in the top paths reported bypathfinder(Fig 9). SNP to mark and mark to TSS distances were sig-nificantly lower in our selected paths compared with randomly chosen paths at the same regions. The average distance from SNP to mark inpathfinder’s top paths was approximately 11.7kb, compared to 15.3kb in randomly chosen paths (p<0.001). The average distance from mark to TSS in selected paths was approximately 8.6kb, compared to 9.7kb in randomly cho-sen paths (p = 0.026). SNP to TSS distances were not significantly different in top versus ran-dom paths (p = 0.108), with top SNPs lying on average 11.7kb away from the TSS and ranran-dom SNPs lying 12.4kb away. 5% of top SNPs lied within 2kb of the TSS while 15% lied within 2kb
Fig 9. Spatial relationships between SNP, mark, and TSS in top paths reported bypathfinder vs random paths. (A) Distances from SNP to
mark (B) Distances from mark to TSS (C) Distances from SNP to TSS.
Geuvadis eQTLs were also selected using standard fine-mapping approaches and we may thus expect a stronger agreement between the two resulting eQTL sets.
We also investigated the extent to whichpathfinder’s top SNPs overlap with eQTLs that have been experimentally validated through differential expression in an LCL dataset [23]. Here, we define the set of validated eQTLs to be those whose p-values for differential expres-sion passed a threshold of 0.01. We find that 2.2% (or 13) ofpathfinder’s top SNPs overlap with this validated set, where choosing the SNP with the highest association with gene expres-sion in each region resulted in an overlap of 2.3% (also 13 SNPs).
Finally, we investigated whether any of the top paths reported bypathfindercould be found within GWAS hit regions for various autoimmune diseases, as our data were collected from LCLs. These autoimmune diseases included Celiac disease, Crohn’s disease, PBC (Primary Bil-iary Cirrhosis), SLE (Systemic Lupus Erythematosus), MS (Multiple Sclerosis), RA (Rheuma-toid Arthritis), IBD (Irritable Bowel Disease), and UC (Ulcerative Colitis). We restricted to GWAS hits with variants associated to the trait withp<5×10⁻⁸. We found that 19 of our 480 top paths were contained in a GWAS-implicated region. InTable 4, we report the paths that localized within autoimmune GWAS regions. In order to determine whether our top paths are truly enriched in GWAS regions, we established how many of these paths appear in an equiva-lent number of random regions that have not been implicated by an autoimmune GWAS. We centered each random region around a SNP that was matched for a similar MAF and LD score as the GWAS tag SNP. We ran this analysis 100 times to define a null distribution for the num-ber of top paths found in a background region. We found that 19 out of 480 top paths was not a significant enrichment (p = 0.44).
Discussion
In this work we proposed a hierarchical fine-mapping framework that integrates three levels of data—genetic, chromatin, and gene expression—to pinpoint SNPs and chromatin marks that may be concordantly influencing gene expression. A key contribution of our approach is the ability to model the correlation structure in the association statistics using a Matrix-variate Normal distribution. Our approach is superior to existing methods, demonstrating the advan-tage of using a probabilistic approach that takes into account the full sequential model. More-over,pathfinderproduces well-calibrated posterior probabilities, and is thus a reliable method for the prioritization of SNPs and marks for functional validation.
We conclude by addressing some of the limitations of our method. Most notably, our method is based upon the SNP!mark!expression assumption. In many genomic regions that show simultaneous evidence for SNP to mark and SNP to gene expression effects, this model will not necessary hold true. In simulations, we show that under the SNP!expression!mark
violation,pathfindermay identify causal paths very confidently, leading to false positives under the proposed model. When a SNP is in fact independently influencing a mark and gene expres-sion,pathfinderis less likely to produce false positives. However, the risk of mis-appropriating our method in this way can be reduced by requiring genomic regions to show evidence for our causal model. We recommend a pre-filtering step before runningpathfinderon real data that we outline in Methods. In our empirical data analyses, we demonstrate that this two-step regression robustly filters out non-conforming regions. We also acknowledge that, though there are multiple lines of evidence for SNPs influencing expression through local hQTLs, recent works have also emphasized the importance of interactions with distal hQTLs. Thus, developing a systematic way to incorporate data in distal regions with evidence for interactions with a local eQTL would be a fruitful direction. Moreover,pathfinderassumes that the true causal SNP and mark within a region are present in the data, which may not always be the case. In this scenario,pathfinderwill instead place its confidence in the SNP or mark that best corre-lates with the missing causal SNP or mark in question. Similarly, many epigenetic marks are not themselves causal for gene expression, but are simply correlated to a causal event (e.g., tran-scription factor binding). It is also often the case that multiple marks at promoter and enhancer regions are concordantly acting to impact gene expression. In these cases, individual marks are not necessarily causal in themselves, but may be viewed as a cause for inter-individual variation or simply correlated to a causal factor. In this light,pathfinderaims to identify the epigenetically modifying region so that it can be tested experimentally and/or characterized functionally (for example, to identify the effector transcription factor). We also note thatpathfindercurrently uses an approximation whereby the observed Z-score at the causal SNP is used to estimate the true NCP at the causal SNP (Methods). We leave this to be addressed in future work; this
Table 4. Top causal paths reported in real data analysis that localized within GWAS regions for 8 autoimmune diseases. For each path, we report the chromosome, the RSID of the implicated SNP, the implicated mark type, the posterior probability we assigned to this path, three Z-scores (SNP to mark association, mark to expression association, SNP to expression association), the GENCODE gene around which this region was centered, the ChromHMM [24] annotation for the SNP, and the number of regulatory motifs altered by the SNP, as designated by HaploReg [25].
chr rsid GWAS mark type posterior SNP-mark mark-exp SNP-exp gene chrom state motifs altered 2 rs2975781 UC, IBD H3K27ac 1.00 -9.00 5.33 -4.96 GPR35 7Enh 9
8 rs2618481 SLE H3K27ac 0.94 -6.04 6.59 -3.99 BLK 2TssAFlnk 0 16 rs9927129 Crohn’s, IBD H3K4me1 0.66 -7.82 -0.79 1.59
RP11-1348G14.2
15Quies 1
6 rs2071889 UC, SLE, MS, RA, IBD DHS 0.61 6.51 -3.23 -1.78 TAPBP 4Tx 2 16 rs394502 Crohn’s, IBD H3K4me1 0.44 9.96 -1.59 -2.62 EIF3CL 15Quies 4 1 rs57126490 UC, MS, RA, IBD DHS 0.43 4.65 -0.14 0.04 PANK4 5TxWk 0 6 rs915654 UC, SLE, Crohn’s, PBC, MS, RA,
IBD
H3K4me3 0.42 3.48 5.98 3.51 LTA 7Enh 5
1 rs114312440 Crohn’s H3K4me3 0.41 -4.54 3.44 -2.79 MTX1 5TxWk 2
3 rs71155551 SLE H3K27ac 0.39 4.73 3.20 1.27 COPG1 5TxWk 2
1 rs34769708 Crohn’s H3K4me3 0.39 -4.86 2.13 -2.71 ASH1L 7Enh 3
6 rs13197384 MS H3K4me3 0.35 6.68 4.44 3.84 AHI1 1TssA 16
6 rs147085011 UC, SLE, PBC, MS, RA, IBD H3K4me3 0.32 5.11 -0.27 -0.42 RPP21 1TssA 16
16 rs243332 PBC, MS DHS 0.28 4.45 2.26 0.74 SOCS1 1TssA 9
6 rs575034 RA H3K4me1 0.23 3.73 3.51 0.85 SLC35B2 1TssA 1
2 rs737231 Crohn’s, Celiac H3K4me1 0.22 3.59 3.13 2.10 SLC9A4 15Quies 6 5 rs17097187 MS H3K4me3 0.22 -2.94 6.27 -4.93 PCDHGA1 9Het 4 2 rs737231 IBD H3K4me1 0.22 3.59 3.13 2.10 SLC9A4 15Quies 6 1 rs2641116 UC, IBD H3K4me3 0.20 4.57 0.59 1.08 PARK7 4Tx 1 20 rs6115319 MS H3K27ac 0.11 -5.58 6.39 -4.13 FAM182B 15Quies 0
For each individual, lethbe the signal value for the causal histone mark andGbe their vector of genotypes at a region containingsSNPs. LetEbe the individual’s mRNA expression level for the gene at this region andHbe a vector representing alltmarks at the region, which con-tainsh. Here we analyze all individual peak locations across all available mark types in a joint framework. As such, each oftindividual marks represents one peak location for a particular mark type. Our causal framework can be modeled as:
h¼Gbgþg ð1Þ
E¼Hbhþh ð2Þ
wheregNð0;1 s2
gÞandhNð0;1 s
2
hÞ. The vectorβgrepresents the allelic effects on
the causal histone mark whose entries will be non-zero only at the causal SNP. The vectorβh
represents the histone mark effects on expression levels whose entries will be non-zero only at the causal histone mark.s2
gands
2
hrepresent the variance explained at the SNP-mark and
mark-expression levels.
Modeling mark to expression associations. We estimate mark to expression effects with
linear regression to quantify the strength of association of thekth mark through the Wald sta-tistic: Zk h¼ ^ bkh SEðb^khÞ ð3Þ Zk hNðl k h;1Þ ð4Þ lkh¼b k h ffiffiffiffiffiffiffiffiffiffiffiffiffiffiffiffi VarðhkÞ p sh ffiffiffiffi N p ð5Þ
Here,b^khis the estimated effect size of the causal peak on expression.lkhrepresents the strength of our signal for causal marks [19]. However, correlations between histone marks will induce a non-zero non-centrality parameters (NCPs) at non-causal histone marks. If we collect all pairwise mark correlations intoSh, and letΛh,dbe the vector of NCPs for all histone marks
on expression given causal markd, all summary statistics can be approximated by an MVN.
ZhjChNðΣhΛh;d;ΣhÞ ð6Þ
markd, andΣhΛh,drepresents the vector of induced effect sizes at non-causal marks due to inter-mark correlations.
As we do not know the causal effect sizeΛh,d, we use a normal prior on the causal mark NCPs which can be integrated out as follows:
Λh;djCh;s 2 hNð0;ΣC;hÞÞ ð7Þ ΣC;h¼s 2 hDiagðChÞ þDiagðÞ ð8Þ ZhjΣh;Ch Z NðΣhΛh;d;ΣhÞNð0;ΣC;hÞdΛh;d PðChÞ ð9Þ ¼Nð0;ΣhþΣhΣC;hΣhÞPðChÞ ð10Þ
Here the prior probabilities of the causal set vectorP(Ch)) is set to be uniform. As a parameter of the model, we set a prior variance explaineds2
hfor the mark effects. We found the method
to be fairly robust to variations in this parameter (Fig 5J–5L), and chose a prior variance of 5 for our analyses. In practice, we add anof 0.0001 along the diagonal ofSC,hto ensure positive
semidefiniteness. Thus, the mark-expression association statistics can be expressed as:
ZhjChNð0;ΣhþΣhΣChΣhÞ ð11Þ
Modeling SNP to mark associations. As before, we estimate SNP to mark effects with
lin-ear regression to quantify the strength of association of thejth SNP on thekth mark through the Wald statistic:
Zj;k g ¼ ^ bjg;k SEðb^j;k g Þ ð12Þ Zj;k g Nðl j;k g ;1Þ ð13Þ ljg;k¼b j;k g ffiffiffiffiffiffiffiffiffiffiffiffiffiffiffi VarðgjÞ p sg ffiffiffiffi N p ð14Þ
Here,b^jg;kis the estimated effect size of the causal SNP on the causal peak.ljg;k, the NCP, rep-resents the strength of our signal for causal SNP-mark effects. However, LD between SNPs and correlations between marks will induce non-zero NCPs at non-causal SNP-mark pairs. We collect all pairwise SNP correlations intoΣgand all pairwise mark correlations intoΣh, and use
the Matrix-variate Normal distribution to jointly approximate the association statistics for all SNPs on all marks as:
ZgjCg;ChMNðM;Σg;ΣhÞ ð15Þ
Here, M is ans×tmatrix representing association means between allsSNPs and allt marks, where each entryMj;k¼Σ
j;c gΣ
k;d
h lc;d, such that the induced NCP for SNPjon markkis
just the NCP for causal SNPcon causal markd, attenuated by the correlation between SNPsj andc, as well as the correlation between markskandd. Here, rather than integrating out the causal NCPs as we did with the mark-expression associations, we use the observed Z-score for
PðZg;ZhÞ
¼PðZhjChÞðPðZgjCh;CgÞ PðZg;ZhÞ
ð18Þ
We obtainP(Zh|Ch) fromEq 11andP(Zg|Ch, Cg) fromEq 15. We then computeP(Zg, Zh) by summing over the individual likelihoods for all possible causal paths. Here our method assumes a single causal SNP and mark per region, as we restrict our enumeration to only pair-wise causal SNP-mark combinations.
Simulation framework
We simulated data for 100 individuals over 10,000 50KB regions, using genotypes and LD from 65 YRI individuals obtained through 1000 Genomes [26]. SNP and mark correlations in our simulations were taken from the true correlations exhibited in these regions derived from these individuals. To determine causal status, we randomly chose one SNP and one mark to be causal in each region, thus defining a causal path through the data. Subsequently, we standard-ized genotypes and simulated values for chromatin marks and gene expression over all 100 individuals.
In order to simulate correlations between histone marks as observed in our empirical data, we drew mark values from an MVN asNðHind; gShÞ, where the means,Hind=HcSh,c,
represent the induced values on non-causal marks due to correlations with the causal mark. The mean mark values for the causal mark were generated for each of the 100 individuals as Hc=βgGc, whereGcis the genotype of the individual at the causal SNP, the effect sizeβgwas
drawn from a normal distribution,Nð0;s2
gÞ, with variance set to the desired variance
explained by SNPs on markss2
g ¼0:25, with the error termgset to1 s2g. Finally, the
indi-viduals’ values for gene expression are computed asE=βhHc+h, whereHcis the causal
mark value as computed from the MVN, the effect sizeβhwas set to the desired variance
explained from mark to expressions2
g¼0:25, with the remaining error term given by Nð0;1 s2
gÞ.
For simulations in which there were multiple causal SNPs or marks, we randomly drewm orp, the number of causal SNPs or marks, from a binomial distribution where the expected number of causals per region was set to 1. However, we only included simulations with two or more causals. For multi-causal-SNP simulations, we then randomly selectedmcausal SNPs in the region and simulated chromatin marks and gene expression as described previously, but drew the effect sizes of each SNP asNð0;s2
explained remained at 0.25. For multi-causal-mark simulations, we randomly selectedpcausal marks in the region and simulated chromatin marks by defining the means,Hc, of each causal
mark independently as described for the single-causal simulations. We then computed gene expression by drawing the effect size,βh, of each causal mark fromNð0;s2g=pÞsuch that the
total expected variance explained remained at 0.25.
Existing approaches
We benchmark our method against five alternative approaches. Firstly, we compare against the standard overlap analysis whereby hQTLs and eQTLs are independently identified within a region centered around a gene. We follow the protocol outlined in [14]. In this experiment, we computed the best SNP association in each region with every mark measured in the region as well as with the gene expression value for that region. We determined adjusted p-values for each top association by performing permutation tests. We then accounted for multiple testing at the mark level by determining the minimum FDR at which each adjusted p-value would be considered significant. This was estimated via the qvalue package [27]. This procedure resulted in a set of significant SNP-mark associations, as well as one SNP-expression association within the region, as only the top SNP association is retained for each biological phenotype. We then evaluated the number of causal SNPs, marks, and paths that were ultimately included in these candidate sets.
Secondly, we compared against the approach of independently fine-mapping the two levels of data (SNP-mark and mark-expression), and multiplying together pairs of posterior proba-bilities to produce probaproba-bilities of causality for paths. For these independent fine-mapping experiments, we used a simple approach that assumes a single causal variant, approximating posterior probabilities for causality directly from Z-scores [28].
In addition, we compared against a basic ranking approach, where we independently com-puted SNP-mark, mark-expression, and SNP-expression associations for every SNP and mark within a region. For SNP and mark prioritization, we simply produced a ranking of the SNP-expression and mark-SNP-expression posterior probabilities for causality, respectively. For path pri-oritization, we produced a ranking of the product of SNP-mark and SNP-expression posterior probabilities.
We next compared against a bayesian network model which computes directed association strengths between all possible pairs of nodes in a given network [20]. The method takes as input raw genotype and phenotype values. As nodes, we included all SNPs and marks, as well as the gene expression value, within a region. We allowed only for node pairings directed from SNP to mark or from mark to gene expression. For SNP and mark prioritization, we ranked association strengths over all directed SNP-expression edges and mark-expression edges, respectively. For path prioritization, we produced a ranking of the product of SNP-mark and mark-expression strengths.
Finally, we compared against Coloc, which is designed to identify SNPs that are likely to be causal for multiple traits at once. Specifically, Coloc outputs a posterior probability that a SNP is causal for two arbitrary traits simultaneously. We adapted Coloc for our purposes by running the method on all SNPs independently. For each SNP, the two given traits were (1) gene expression, and (2) a mark value. Thus, we ran Coloc independently for all SNP-mark combinations. This produced a set of posterior probabilities indicating, for each SNP-mark combination, the likelihood that the SNP is causal for both the mark value and gene expres-sion simultaneously. For path prioritization, we ranked these probabilities over all SNP and mark combinations. For SNP and mark prioritization, we marginalized over all marks and
in each region). Overall, from 14,669 50kb regions, we filtered for regions that exhibited evi-dence for our sequential model where SNPs affect chromatin marks, which in turn affect gene expression. Specifically, for each region we performed a two-stage regression where we first regressed gene expression on all chromatin marks, and (2) regressed the proportion of expres-sion explained by the chromatin marks on each SNP. If at least one SNP had a low p-value for association (p<0.05/n.snps) to the proportion of gene expression explained by chromatin data, we kept this region for our real data analysis. After this filtering procedure, we retained 1,317 regions.
We obtained motif annotations from HaploReg [25] and ChromHMM annotations from the NIH Roadmap Epigenomics Consortium [30]. When comparing annotations of top priori-tized paths with those of random paths, we established corresponding background paths by choosing a random SNP/mark combination at every region where a top path was reported.
For GWAS analyses, we explored regions whose tag SNP was associated to an autoimmune trait withp<5×10⁻⁸. Associations were obtained from recent literature for eight autoim-mune phenotypes [31–36]. For each ofpathfinder’s top reported paths, we determined whether the corresponding SNP was contained within any of the GWAS regions in our dataset. In order establish a null distribution for this statistic, we ran the same analysis for random regions in the genome not overlapping with the GWAS regions in our dataset. Specifically, for each GWAS region, we randomly selected a SNP in the same chromosome matched for MAF (= 0.01) and LD score (= 0.001) with the GWAS tag SNP. We established a window around this matched SNP corresponding to the window size of the GWAS region. Finally, we deter-mined the number of top paths that fell within these random regions. We repeated this experi-ment 100 times to establish the null distribution of this measureexperi-ment and calculated a p-value using a Z-test.
Supporting information
S1 Table. 50%, 90%, and 99% credible sets for SNP-, mark-, and path-mapping in simula-tions. We comparepathfinderto basic eQTL mapping with respect to the size of their credible sets, averaged across all regions. Standard errors are included next to each measurement. (TIF)
S2 Table. 50%, 90%, and 99% credible sets for SNP-, mark-, and path-mapping for simula-tions using YRI LD and CEU LD. We comparepathfinder’s performance on simulations using SNP LD from YRI versus from CEU, with respect to the size of its credible sets, averaged across all regions. Standard errors are included next to each measurement.
S3 Table. Aggregate probability mass assigned to DHS, H3K4me1, H3K4me3, and
H3K27ac. We compare the total probability amassed at all peaks for each mark type after
run-ningpathfinderon empirical data. We display both the raw probability mass and the average mass contribution per peak location for each mark type.
(TIF)
S4 Table. 50%, 90%, and 99% credible sets for SNP-, mark-, and path-mapping for real data analysis in CEU individuals. We comparepathfinder’sperformance on PEER-corrected data and raw data, with respect to the size of its credible sets, averaged across all regions. Stan-dard errors are included next to each measurement.
(TIF)
S1 Fig. 50%, 90%, and 99% credible sets for SNP-, mark-, and path-mapping, in compari-son to independent fine-mapping. We comparepathfinderto the technique of independently fine-mapping the two levels of data, with respect to the calibration of their credible sets (A, C, E) and the size of their credible sets (B, D, F).
(TIF)
S2 Fig. Performance of the method in the presence of two anti-correlated mark effects. We
assesspathfinder’s behavior in simulations with respect to SNP-, mark-, and path-mapping (A-C) when an additional peak in the region has an effect on expression that is opposite from the mediating peak in question, compared with regions in which the effect of the additional peak has a matching sign.
(TIF)
S3 Fig. Comparison of ranking approaches in response to violations of the causal model.
We comparepathfinder’s response to violations of the causal model against the behavior of other ranking approaches. Causal models are illustrated to the left of the figure. (A, D, G, J, M, P, S) display SNP-mapping accuracy. (B, E, H, K, N, Q, T) display mark-mapping accuracy. (C, F, I, L, O, R, U) display path-mapping accuracy.
(TIF)
S4 Fig. Runtime analysis.pathfinder’s runtimes on empirical data with respect to the number of SNPs, marks, and paths within a region (A-C). We plot each simulation as a point and fit a line to all points.
(TIF)
S5 Fig. Observedh2
gin empirical data. We report the distribution of SNP-mark (A),
mark-expression (B), and SNP-mark-expression (C)h2
glevels observed across all top paths selected by path-finder.
(TIF)
S6 Fig. Association plots for top region reported bypathfinder in real data, spanning a
50kb region centered around the NDUFA12 TSS. (A) Mark-expression Z-scores are reported
for all marks. (B) SNP-mark Z-scores are reported for the top mark chosen bypathfinder. The implicated SNP, rs835044, lies 6bp downstream of the NDUFA12 TSS.
(TIF)
S7 Fig. Spatial relationships between SNP, mark, and TSS in top paths reported by path-finder vs random paths, stratified by mark type. (A-C) DHS. (D-F) H3K4me1. (G-I)
H3K4me3. (J-L) H3K27ac. (TIF)
Methodology: Megan Roytman, Gleb Kichaev, Bogdan Pasaniuc. Resources: Megan Roytman, Alexander Gusev, Bogdan Pasaniuc. Software: Megan Roytman.
Supervision: Bogdan Pasaniuc. Visualization: Megan Roytman.
Writing – original draft: Megan Roytman.
Writing – review & editing: Megan Roytman, Gleb Kichaev, Alexander Gusev, Bogdan
Pasaniuc.
References
1. Manolio TA. Genomewide association studies and assessment of the risk of disease. New England Journal of Medicine. 2010; 363(2):166–176.https://doi.org/10.1056/NEJMra0905980PMID:20647212
2. Maurano MT, Humbert R, Rynes E, Thurman RE, Haugen E, Wang H, et al. Systematic localization of common disease-associated variation in regulatory DNA. Science. 2012; 337(6099):1190–1195.
https://doi.org/10.1126/science.1222794PMID:22955828
3. Albert FW, Kruglyak L. The role of regulatory variation in complex traits and disease. Nature Reviews Genetics. 2015; 16(4):197–212.https://doi.org/10.1038/nrg3891PMID:25707927
4. Kasowski M, Kyriazopoulou-Panagiotopoulou S, Grubert F, Zaugg JB, Kundaje A, Liu Y, et al. Exten-sive variation in chromatin states across humans. Science. 2013; 342(6159):750–752.https://doi.org/ 10.1126/science.1242510PMID:24136358
5. Kilpinen H, Waszak SM, Gschwind AR, Raghav SK, Witwicki RM, Orioli A, et al. Coordinated effects of sequence variation on DNA binding, chromatin structure, and transcription. Science. 2013; 342 (6159):744–747.https://doi.org/10.1126/science.1242463PMID:24136355
6. McVicker G, van de Geijn B, Degner JF, Cain CE, Banovich NE, Raj A, et al. Identification of genetic variants that affect histone modifications in human cells. Science. 2013; 342(6159):747–749.https:// doi.org/10.1126/science.1242429PMID:24136359
7. Ernst J, Kheradpour P, Mikkelsen TS, Shoresh N, Ward LD, Epstein CB, et al. Mapping and analysis of chromatin state dynamics in nine human cell types. Nature. 2011; 473(7345):43–49.https://doi.org/10. 1038/nature09906PMID:21441907
8. Astle WJ, Elding H, Jiang T, Allen D, Ruklisa D, Mann AL, et al. The allelic landscape of human blood cell trait variation and links to common complex disease. Cell. 2016; 167(5):1415–1429.https://doi.org/ 10.1016/j.cell.2016.10.042PMID:27863252
9. Chen L, Ge B, Casale FP, Vasquez L, Kwan T, Garrido-Martı´n D, et al. Genetic drivers of epigenetic and transcriptional variation in human immune cells. Cell. 2016; 167(5):1398–1414.https://doi.org/10. 1016/j.cell.2016.10.026PMID:27863251
10. Grubert F, Zaugg JB, Kasowski M, Ursu O, Spacek DV, Martin AR, et al. Genetic control of chromatin states in humans involves local and distal chromosomal interactions. Cell. 2015; 162(5):1051–1065.
11. Li YI, van de Geijn B, Raj A, Knowles DA, Petti AA, Golan D, et al. RNA splicing is a primary link between genetic variation and disease. Science. 2016; 352(6285):600–604.https://doi.org/10.1126/ science.aad9417PMID:27126046
12. Visscher PM, Brown MA, McCarthy MI, Yang J. Five years of GWAS discovery. The American Journal of Human Genetics. 2012; 90(1):7–24.https://doi.org/10.1016/j.ajhg.2011.11.029PMID:22243964
13. Kichaev G, Yang WY, Lindstrom S, Hormozdiari F, Eskin E, Price AL, et al. Integrating functional data to prioritize causal variants in statistical fine-mapping studies. PLoS Genet. 2014; 10(10):e1004722.
https://doi.org/10.1371/journal.pgen.1004722PMID:25357204
14. Waszak SM, Delaneau O, Gschwind AR, Kilpinen H, Raghav SK, Witwicki RM, et al. Population varia-tion and genetic control of modular chromatin architecture in humans. Cell. 2015; 162(5):1039–1050.
https://doi.org/10.1016/j.cell.2015.08.001PMID:26300124
15. Banovich NE, Lan X, McVicker G, Van de Geijn B, Degner JF, Blischak JD, et al. Methylation QTLs are associated with coordinated changes in transcription factor binding, histone modifications, and gene expression levels. PLoS Genet. 2014; 10(9):e1004663.https://doi.org/10.1371/journal.pgen.1004663
PMID:25233095
16. Hormozdiari F, van de Bunt M, Segre AV, Li X, Joo JWJ, Bilow M, et al. Colocalization of GWAS and eQTL Signals Detects Target Genes. The American Journal of Human Genetics. 2016; 99(6):1245– 1260.https://doi.org/10.1016/j.ajhg.2016.10.003PMID:27866706
17. Giambartolomei C, Vukcevic D, Schadt EE, Franke L, Hingorani AD, Wallace C, et al. Bayesian test for colocalisation between pairs of genetic association studies using summary statistics. PLoS Genet. 2014; 10(5):e1004383.https://doi.org/10.1371/journal.pgen.1004383PMID:24830394
18. Kichaev G, Roytman M, Johnson R, Eskin E, Lindstroem S, Kraft P, et al. Improved methods for multi-trait fine mapping of pleiotropic risk loci. Bioinformatics. 2016; p. btw615.
19. Hormozdiari F, Kostem E, Kang EY, Pasaniuc B, Eskin E. Identifying causal variants at loci with multiple signals of association. Genetics. 2014; 198(2):497–508.https://doi.org/10.1534/genetics.114.167908
PMID:25104515
20. Scutari M. Learning Bayesian networks with the bnlearn R package. arXiv preprint arXiv:09083817. 2009;.
21. Degner JF, Pai AA, Pique-Regi R, Veyrieras JB, Gaffney DJ, Pickrell JK, et al. DNase [thinsp] I sensitiv-ity QTLs are a major determinant of human expression variation. Nature. 2012; 482(7385):390–394.
https://doi.org/10.1038/nature10808PMID:22307276
22. Lappalainen T, Sammeth M, Friedla¨nder MR, ’t Hoen PA, Monlong J, Rivas MA, et al. Transcriptome and genome sequencing uncovers functional variation in humans. Nature. 2013; 501(7468):506.
https://doi.org/10.1038/nature12531PMID:24037378
23. Tewhey R, Kotliar D, Park DS, Liu B, Winnicki S, Reilly SK, et al. Direct identification of hundreds of expression-modulating variants using a multiplexed reporter assay. Cell. 2016; 165(6):1519–1529.
https://doi.org/10.1016/j.cell.2016.04.027PMID:27259153
24. Ernst J, Kellis M. Large-scale imputation of epigenomic datasets for systematic annotation of diverse human tissues. Nature biotechnology. 2015; 33(4):364–376.https://doi.org/10.1038/nbt.3157PMID:
25690853
25. Ward LD, Kellis M. HaploReg: a resource for exploring chromatin states, conservation, and regulatory motif alterations within sets of genetically linked variants. Nucleic acids research. 2012; 40(D1):D930– D934.https://doi.org/10.1093/nar/gkr917PMID:22064851
26. Consortium GP, et al. An integrated map of genetic variation from 1,092 human genomes. Nature. 2012; 491(7422):56–65.https://doi.org/10.1038/nature11632PMID:23128226
27. Storey JD, Tibshirani R. Statistical significance for genomewide studies. Proceedings of the National Academy of Sciences. 2003; 100(16):9440–9445.https://doi.org/10.1073/pnas.1530509100
28. Maller JB, McVean G, Byrnes J, Vukcevic D, Palin K, Su Z, et al. Bayesian refinement of association signals for 14 loci in 3 common diseases. Nature genetics. 2012; 44(12):1294–1301.https://doi.org/10. 1038/ng.2435PMID:23104008
29. Stegle O, Parts L, Piipari M, Winn J, Durbin R. Using probabilistic estimation of expression residuals (PEER) to obtain increased power and interpretability of gene expression analyses. Nature protocols. 2012; 7(3):500–507.https://doi.org/10.1038/nprot.2011.457PMID:22343431
30. Kundaje A, Meuleman W, Ernst J, Bilenky M, Yen A, Heravi-Moussavi A, et al. Integrative analysis of 111 reference human epigenomes. Nature. 2015; 518(7539):317–330.https://doi.org/10.1038/ nature14248PMID:25693563
31. Liu JZ, van Sommeren S, Huang H, Ng SC, Alberts R, Takahashi A, et al. Association analyses identify 38 susceptibility loci for inflammatory bowel disease and highlight shared genetic risk across popula-tions. Nature genetics. 2015; 47(9):979–986.https://doi.org/10.1038/ng.3359PMID:26192919