Version: Published Version
Monograph:
Mazzone, P. orcid.org/0000-0003-0944-8031, Carlton, J. orcid.org/0000-0002-9373-7663
and Griffiths, H. orcid.org/0000-0003-4286-5371 (2019) Summary vision screening data :
Poland. Report. Vision Screening Country Reports . EUScreen
©2019 EUScreen. For reuse permissions, please contact the publisher.
[email protected] https://eprints.whiterose.ac.uk/ Reuse
Items deposited in White Rose Research Online are protected by copyright, with all rights reserved unless indicated otherwise. They may be downloaded and/or printed for private study, or other acts as permitted by national copyright laws. The publisher or other rights holders may allow further reproduction and re-use of the full text version. This is indicated by the licence information on the White Rose Research Online record for the item.
Takedown
If you consider content in White Rose Research Online to be in breach of UK law, please notify us by
Summary Vision Screening Data: Poland
Produced as part of Work Package 3
Paolo Mazzone
1, Dr Jill Carlton
2, Dr Helen Griffiths
31. Research Assistant, School of Health and Related Research, University of Sheffield, United Kingdom (UK) 2. Senior Research Fellow, School of Health and Related Research, University of Sheffield, United Kingdom
(UK)
3. Senior Lecturer, Academic Unit of Ophthalmology and Orthoptics, University of Sheffield, United Kingdom (UK)
Information provided by Dr Michal Szuminski, Department of Paediatric Ophthalmology with
Strabismus Treatment Centre & Professor Alina Bakunowicz-
Ł
, Department of
Paediatric Ophthalmology with Strabismus Treatment Centre
23rd January 2019
Disclaimer: This is a summary report representing the responses from a country representative working within eye care services of the country reported. This report does not represent conclusions made by the authors, and is the product of professional research conducted for the EUSCREEN study. It is not meant to represent the position or opinions of the EUSCREEN study or its Partners. The information cannot be fully verified by the
authors and represent only the information supplied by the country representatives.
T E U H
ii
Contents
1 Glossary of Terms: Vision Screening iii
2 Abbreviations vi
3 Population and Healthcare Overview 1
4 Vision Screening Commissioning and Guidance 3
5 Screening programme 4
5.1 Vision screening - Preterm babies 4
5.2 Vision screening - Birth to 3 months 4
5.3 Vision screening - 3 months to 36 months 4
5.4 Vision screening - 36 months to 7 years 4
6 Automated Screening 8
7 Provision for Visually Impaired 9
8 Knowledge of existing screening programme 10
8.1 Prevalence/Diagnosis 10
8.2 Coverage 10
8.3 Screening evaluation 10
8.4 Treatment success 10
9 Costs of vision screening in children 11
9.1 Cost of vision screening 11
9.2 Cost of treatment for amblyopia 11
9.3 Cost of Treatment for strabismus 11
9.4 Cost of treatment for cataract 11
iii
1
Glossary of Terms: Vision Screening
Abnormal test result
A
detected under good conditions. The result on screening
Attendance rate
The proportion of all those invited for screening that are tested
and receive a result:
Invited for screening includes all those that are offered
the screening test.
Tested and
Attendance rate provides information on the willingness of
families to participate in screening.
Compliance with
referral (percentage)
The percentage of those who are referred from screening to a
diagnostic assessment that actually attend the diagnostic
assessment.
Percentage of compliance provides information on the
willingness of families to attend the diagnostic assessment after
referral from screening.
Coverage
The proportion of those eligible for screening that are tested and
receive a result:
Eligible for screening includes those within the population
that are covered under the screening or health care
programme.
T
Factors such as being offered screening, willingness to
participate, missed screening, ability to complete the screen, and
ability to document the screening results will influence the
coverage.
False negatives
The percentage of children with a visual deficit (defined by the
iv
Example: If 100 children with visual deficit are screened, and 1
child passes the screening, the percentage of false negatives is
1%.
False positives
The percentage of children with normal vision that are referred
from screening to a diagnostic assessment.
Guidelines
Recommendations or instructions provided by an authoritative
body on the practice of screening in the country or region.
Vision screening
professional
A person qualified to perform vision screening, according to the
practice in the country or region.
Inconclusive test
result
A
detected due to poor test conditions or poor cooperation of the
child.
Invited for screening
Infants/children and their families who are offered screening.
Outcome of vision
screening
An indication of the effectiveness or performance of screening,
such as a measurement of coverage rate, referral rate, number of
children detected, etc.
Untreated amblyopia
Those children who have not received treatment for amblyopia
due to missed screening or missed follow-up appointment.
Persistent amblyopia
Amblyopia that is missed by screening, or present after the child
has received treatment.
Positive predictive
value
The percentage of children referred from screening who have a
confirmed vision loss.
For example, if 100 babies are referred from screening for
diagnostic assessment and 10 have normal vision and 90 have a
confirmed visual defect, the positive predictive value would be
90%.
Prevalence
The percentage or number of individuals with a specific disease
or condition. Prevalence can either be expressed as a percentage
or as a number out of 1000 individuals within the same
demographic.
Programme
An organised system for screening, which could be based
nationally, regionally or locally.
Protocol
Documented procedure or sequence for screening, which could
include which tests are performed, when tests are performed,
procedures for passing and referring, and so forth.
v
Referral criteria
A pre-determined cut-off boundary for when a child should be
re-tested or seen for a diagnostic assessment.
Risk babies / Babies
at-risk
All infants that are considered to be at-risk or have risk-factors
for vision defects/ophthalmic pathology according to the
screening programme.
Two common risk factors are admission to the neonatal-intensive
care unit (NICU) or born prematurely. However, other risk factors
for visual defects may also be indicated in the screening
programme.
Sensitivity
The percentage of children with visual defects that are identified
via the screening programme.
For example, if 100 babies with visual defects are tested, and 98
of these babies are referred for diagnostic assessment and 2 pass
the screening, the sensitivity is 98%.
Specificity
The percentage of children with normal vision that pass the
screening.
For example, if 100 babies with normal vision are tested, and 10
of these babies are referred for diagnostic assessment and 90
pass the screening, the specificity is 90%.
Target condition
The visual defect you are aiming to detect via the screening
programme.
vi
2
Abbreviations
GDP
Gross Domestic Product
GP
General Practitioners
NICU
Neonatal-intensive care unit
PPP
Purchasing Power Parity
ROP
Retinopathy of Prematurity
VA
Visual Acuity
1
3
Population and Healthcare Overview
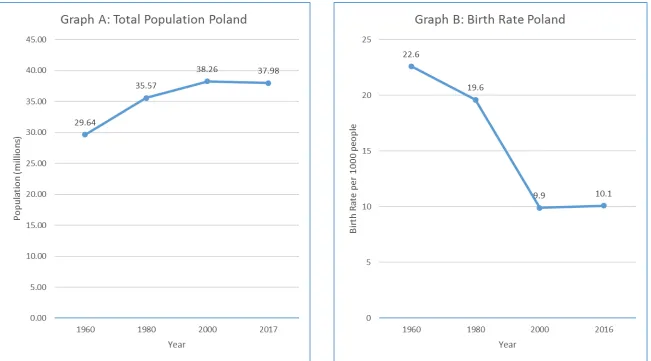
The population of Poland is 37,975,841 (World Bank, 2018a) and birth rate is estimated at
10.1 births/1,000 population in 2016 (World Bank, 2018b). The change in population and
birth rate from 1960 to 2017 is shown in Figure 1, graphs A and B respectively.
Poland has a reported population density of 124 people per square kilometre in 2017 and
this has risen from 98 people per square kilometre in 1961 (World Bank, 2018c). In terms of
healthcare facilities, the total density of hospitals in 2013 was 0.94 per 100,000 population
(WHO, 2016a). Infant mortality in 2017 is estimated at 4 deaths/1,000 live births in total
(World Bank, 2018d).
2
Figure 1: Change in the Total Population and Birth Rate in Poland between 1960 and 2017
3
4
Vision Screening Commissioning and Guidance
Vision screening is organised nationally in Poland, there are no regional differences. The vision screening programme is not embedded into a general preventative child healthcare screening system. The content of the vision screening programme is decided upon by the Ministry of Health, and implemented nationally. T and has not been changed since its implementation.
Vision screening is conducted by General Practitioners (GP), ophthalmologists, paediatricians and nurses, of which there are approximately 850 per million population. No other general health professionals have been identified who could screen with additional training. There is no specific training to perform vision screening. Vision screening is performed during vaccination visits. Invitations are sent by the local GPs office; there is no central database.
There are national general health screening guidelines for vision screening and the programme is reviewed once every several years. Any revisions would be implemented by the Ministry of Health and funded by state health insurance. Any revisions to the vision screening programme are conducted through consultations between the Ministry of Health and ophthalmology consultants.
4
5
Screening programme
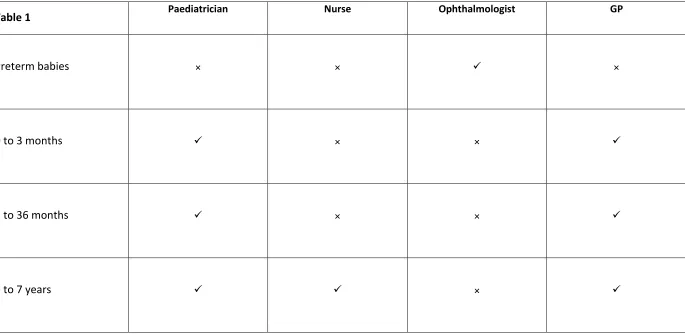
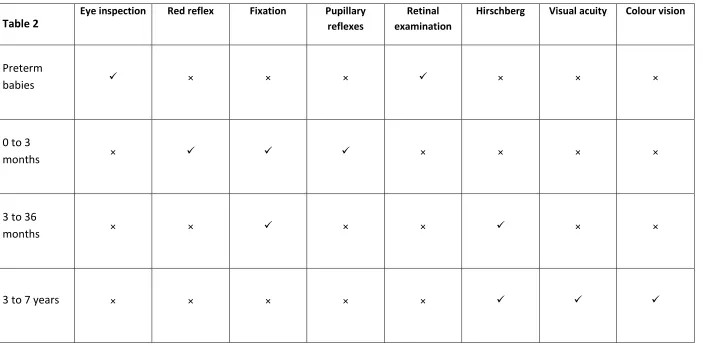
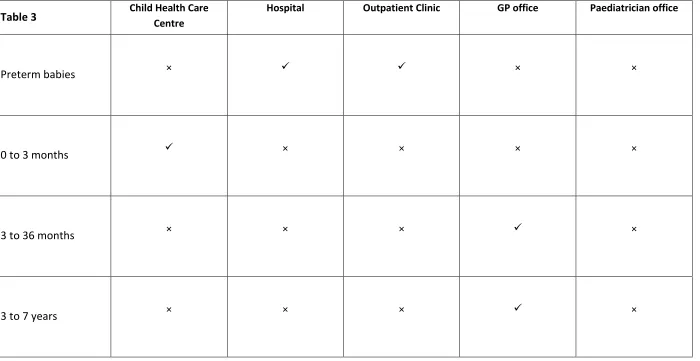
The target conditions screened for are retinopathy of prematurity (ROP), congenital eye disorders, reduced visual acuity and strabismus. The health care professionals delivering vision screening, venue for screening and tests used vary depending on the age of the child as shown in Tables 1, 2 and 3 respectively. Specific details of the screening offered within each age group are described more fully in sections 5.1 to 5.4 below
5.1
Vision screening - Preterm babies
Preterm babies up to the age of 3 months are screened by an ophthalmologist in outpatient clinics or within hospitals using eye inspection and retinal examinations. This occurs four weeks after birth; follow-ups are conducted at 2 to 4 week intervals depending on a diagnosis of ROP.
5.2
Vision screening - Birth to 3 months
Well, healthy babies up to the age of 3 months are screened by either a paediatrician or a GP. This is conducted at either 1 or 3 months of age, in a child healthcare centre using a fundus red reflex examination, fixation and pupillary reflexes. Referral is made if any suspected abnormality is identified, babies are referred for further diagnostic examination after one abnormal or one inconclusive test result.
5.3
Vision screening - 3 months to 36 months
Children aged 3 to 36 months are screened by either a paediatrician or a GP. This is conducted in the GPs office by both professionals. At the age of 1 to 3 months, fixation is conducted and at the age of 36 months, the Hirschberg test is conducted. Referral is made if any suspected abnormality is identified, children are referred for further diagnostic examination after one abnormal or inconclusive test result.
5.4
Vision screening - 36 months to 7 years
Children aged 3 to 7 years are screened by a paediatrician, GP or nurse. This is conducted in a GPs office, where visual acuity (VA) and Hirschberg test are conducted. Colour vision is assessed after the age of 7 years. VA and Hirschberg test are assessed at 3, 4, 5, 6 and 7 years of age.
At the age of 3 years, the GP or paediatrician will conduct the VA assessment, at the age of 7 years, the nurse, GP, or paediatrician will conduct the screening. The optotype charts used for VA measurement are numbers or pictures. These are crowded linear tests or uncrowded single optotypes for pre-schoolers. From the age of 7 years the Snellen chart is used.
5
Table 1:
Healthcare professionals who conduct vision screening in each age group
Table 1
Paediatrician Nurse Ophthalmologist GPPreterm babies
× × ×0 to 3 months
× × 3 to 36 months
× × [image:12.842.84.769.120.454.2]6
Table 2:
Vision screening tests used in vision screening for each age group
Table 2
Eye inspection Red reflex Fixation Pupillary
reflexes
Retinal examination
Hirschberg Visual acuity Colour vision
Preterm
babies
× × × × × ×0 to 3
months
× × × × ×3 to 36
months
× × × × × ×7
Table 3:
Location of vision screening for each age group
Table 3
Child Health CareCentre
Hospital Outpatient Clinic GP office Paediatrician office
Preterm babies
× × ×0 to 3 months
× × × ×3 to 36 months
× × × × [image:14.842.78.778.119.480.2]8
6
Automated Screening
Automated vision screening is carried out using handheld, portable devices designed to detect presence of refractive error in infants and young children. It provides objective results and is used to detect amblyopic risk factors. This differs from other methods used to screen children for amblyopia which focus on detection of the actual condition and the resulting visual loss.
9
7
Provision for Visually Impaired
10
8
Knowledge of existing screening programme
8.1
Prevalence/Diagnosis
The prevalence of treated or untreated amblyopia in Poland, by the age of 7 years, is estimated as 3%, with prevalence of persistent amblyopia (missed by screening or failed treatment) estimated as 1% by the age of 7 years. The prevalence of strabismus, by the age of 7 years, is estimated as 5%. From all cases of amblyopia it is estimated that the distribution of strabismic amblyopia is 30%, refractive amblyopia 40%, combined mechanism amblyopia 20% and deprivation amblyopia 10%.
8.2
Coverage
It is approximated that 99% of children are invited for vision screening; invitations are sent out in the form of a letter with a vaccination invitation by the GP. Approximately 0.5% of children in Poland do not attend obligatory vaccination visits (according to the report of The Supreme Chamber of Control, 2017), data from 29.5% of attenders do not contain visual acuity measurements. The attendance of vision screening before the age of 7 years is estimated as 70%. The percentage of compliance with referral after an abnormal screening test result is estimated at 95%.
8.3
Screening evaluation
Estimations concerning the screening evaluation in Poland are based on the percentage of prescribed treatment from referred children in the Podlasie region. The percentage of false negatives for vision screening, after the screening has been completed is estimated as 2%. The percentage of false positives for vision screening is low and estimated by the country representative as 0.5%. The positive predictive value of a refer results after vision screening is estimated as 98%. The sensitivity and specificity of vision screening is not known.
8.4
Treatment success
The percentage of infants treated for congenital eye disorders is estimated as 0.1%. The percentage of children treated for strabismus after being screened before the age of 7 years is estimated as 4%. The percentage of all children treated for strabismus before the age of 7 years is estimated as 3.5%. The percentage of children treated for amblyopia, after being screened before the age of 7 years is estimated as 2%.
The number of patients treated by ophthalmologists for congenital cataracts is estimated as 90 per year, the number of patients treated by ophthalmologists for amblyopia is estimated as 7,500 per year and the number of patients treated for strabismus by ophthalmologists and orthoptists is estimated as 1,316 per year. All eligible children are offered treatment. Ophthalmologists are the only professional to prescribe glasses for children under the age of 7 years. Other treatments include patching and cataract surgery as appropriate.
11
9
Costs of vision screening in children
9.1
Cost of vision screening
The salary costs, per year, for vision screening professionals in Poland has not been reported. The salary costs per hour for vision screening professionals is estimated at 19 PLN (4.5 Euros, 20/12/2018). The costs to train general preventative child healthcare screening professionals, from leaving secondary education to qualification has not been reported. The screening costs per year for vision screening and the screening costs per child for vision screening are not known.
9.2
Cost of treatment for amblyopia
The estimated costs for treatment of typical patients with refractive amblyopia and/or strabismic amblyopia are not known.
9.3
Cost of Treatment for strabismus
The estimated costs for strabismus surgery, including follow-up, are 2,515 PLN (587 Euros, 20/12/2018) per patient. Each patient requires 2 visits.
9.4
Cost of treatment for cataract
The estimated costs for congenital cataract surgery, including follow-up of deprivation amblyopia, are approximately 2,980 PLN (695 Euros, 20/12/2018) per patient.
12
10
References
The World Bank (2018a). Population, total | Data. [online] Available at:
https://data.worldbank.org/indicator/SP.POP.TOTL?locations=PL [Accessed 20 December 2018]. The World Bank. (2018b). Birth rate, crude (per 1,000 people) | Data. [online] Available at:
https://data.worldbank.org/indicator/SP.DYN.CBRT.IN?locations=PL [Accessed 20 December 2018]. The World Bank. (2018c). Population density (people per sq. km of land area) | Data. [online] Available at: https://data.worldbank.org/indicator/EN.POP.DNST?locations=PL [Accessed 20 December 2018].
The World Bank. (2018d). Mortality rate, infant (per 1,000 live births) | Data. [online] Available at: https://data.worldbank.org/indicator/SP.DYN.IMRT.IN?locations=PL [Accessed 20 December 2018]. The World Bank. (2018e). Life expectancy at birth, total (years) | Data. [online] Available at:
https://data.worldbank.org/indicator/SP.DYN.LE00.IN?locations=PL [Accessed 20 December 2018]. The World Bank. (2018f). Death rate, crude (per 1,000 people) | Data. [online] Available at:
https://data.worldbank.org/indicator/SP.DYN.CDRT.IN?locations=PL [Accessed 20 December 2018]. World Health Organisation (WHO). 2016a. Health Infrastructure - Data by country. [ONLINE]
Available at: http://apps.who.int/gho/data/view.main.30000. [Accessed 20 December 2018]. World Health Organisation (WHO). 2016b. Countries, Poland. [ONLINE] Available at: