This is a repository copy of A peptide display protein scaffold to facilitate single molecule ‐
force studies of aggregation prone peptides‐ . White Rose Research Online URL for this paper: http://eprints.whiterose.ac.uk/127258/
Version: Accepted Version Article:
Doherty, CPA orcid.org/0000-0001-5685-4716, Young, LM, Karamanos, TK et al. (4 more authors) (2018) A peptide display protein scaffold to facilitate single molecule force studies‐
of aggregation prone peptides. Protein Science, 27 (7). pp. 1205-1217. ISSN 0961-8368 ‐
https://doi.org/10.1002/pro.3386
[email protected] https://eprints.whiterose.ac.uk/
Reuse
Items deposited in White Rose Research Online are protected by copyright, with all rights reserved unless indicated otherwise. They may be downloaded and/or printed for private study, or other acts as permitted by national copyright laws. The publisher or other rights holders may allow further reproduction and re-use of the full text version. This is indicated by the licence information on the White Rose Research Online record for the item.
Takedown
If you consider content in White Rose Research Online to be in breach of UK law, please notify us by
1
A peptide-display protein scaffold to facilitate single
molecule force studies of aggregation-prone peptides
Authors:
Ciaran P A Doherty1, 2, Lydia M Young1,2, Theodoros K Karamanos1,2, Hugh I Smith1,2, Matthew P Jackson1,2, Sheena E Radford1, 2, David J Brockwell1, 2
Affiliations:
1 Astbury Centre for Structural Molecular Biology, University of Leeds, LS2 9JT, United Kingdom
2 School of Molecular and Cellular Biology, Faculty of Biological Sciences, University of Leeds, LS2 9JT, United Kingdom
Corresponding author:
David J Brockwell
0113 343 7821
Running Title:
2
Abstract
Protein aggregation is linked with the onset of several neurodegenerative disorders, including
P disease (PD), which is associated with the aggregation of -synuclein ( Syn). The
structural mechanistic details of protein aggregation, including the nature of the earliest
protein:protein interactions, remain elusive. In this study we have used single molecule force
spectroscopy (SMFS) to probe the first dimerisation events of the central aggregation-prone
region of Syn (residues 71-82) that may initiate aggregation. This region has been shown to
be necessary for the aggregation of full length Syn and is capable of forming amyloid fibrils
in isolation. We demonstrate that the interaction of Syn71-82 peptides can be studied using
SMFS when inserted into a loop of protein L, a mechanically strong and soluble scaffold
protein that acts as a display system for SMFS studies. The corresponding fragment of the
- S propensity, has also
been studied here. The results from SMFS, together with native mass spectrometry and
S 71-82 is lower than
that of Syn71-82, but that a mixed Syn71-82 S 71-82 dimer forms with a similar propensity to the Syn71-82 homodimer, slowing amyloid formation. This work demonstrates the utility of
a novel display method for SMFS studies of aggregation-prone peptides which would
3
Impact statement
In this study, a display system for the investigation of the intermolecular interactions of small,
aggregation-prone peptides via SMFS has been developed and validated. The data obtained
using this method provides insight on the interactions between the central aggregation-prone
region of Syn and its homologue Syn, revealing an inhibitory interaction of Syn on Syn
aggregation by formation of heterodimers.
Key words
Single molecule force spectroscopy, alpha-synuclein, gamma-synuclein, aggregation, amyloid,
4
Introduction
Studying protein aggregation is a significant challenge, owing to the fact that the aggregating
species along the assembly pathway are often heterogeneous, transiently populated and
evolve on an exponential timescale towards higher order, end point species(1-3). Early events
in the aggregation cascade are consequently difficult to study but are of critical importance
in enhancing our fundamental understanding of the aggregation process. Gaining a greater
mechanistic and structural understanding of early events in aggregation is especially
important for amyloid diseases where the identity of the toxic species is still unclear(4).
Inhibition of early events in the aggregation cascade are thus attractive targets for
preventative and curative treatments for these diseases.
Single molecule approaches using fluorescence(5; 6), or force spectroscopy using either the
AFM(7-17) or optical tweezers(18) are potentially powerful methods to interrogate
aggregating systems as they can be performed at low concentrations, limiting aggregation
and decreasing the rate of assembly. In SMFS, monomers of the aggregation-prone species
are immobilised to force sensors, separating the first protein-protein interactions from
heterogeneous higher order species that complicate data analysis in other approaches. SMFS
can yield information on both the strength of the interaction (and therefore off rates)(19) and
on the location of the interaction interface via measurement of the end-to-end length of the
complex at rupture(20). Application of SMFS to the aggregation field, however, is challenging
due to difficulties in deconvoluting non-specific interactions from bone fide protein-protein
interactions, both of which usually occur close to the surface (21). Separation of signal from
noise is especially challenging when studying small aggregation-prone proteins, such as
5
such as the non-amyloid component (NAC) region of Syn (23; 24). This is because these
peptides can interact with inert surfaces and take part in multipartite interactions between
the tip and surface. As the peptide end-to-end length is inherently short (<5 nm), these
non-specific interactions occur close to the surface. For experiments that extend a single protein
(mechanical unfolding), some of these problems have been addressed by site-specific
immobilisation onto passivated surfaces(25) or by insertion of the protein of interest into a
mechanically strong protein within a protein concatemer(26). For protein-protein interaction
studies, Lyubchenko and colleagues method(27; 28)
whereby pairs of aggregation-prone peptides are tethered onto an extensible linker at a
defined separation, allowing dimerisation events to be analysed(27). Extending the tether
using the AFM allows dissociation to be measured away from the surface. While allowing
measurement of dissociation, this approach requires the synthesis of bespoke polyethylene
glycol-phosphoramidite linkers(21). Another approach developed by Carrion-Vasquez and
colleagues(29) used a disulphide-linked polyprotein construct that allowed direct
identification of single molecule dissociation events of the highly avid cohesin dockerin
complex. This method allows for internally controlled SMFS experiments on protein-protein
interactions. It is, however, complex to implement, requires formation of a trimer and has not
been used to analyse intermolecular interactions in a non-cognate, aggregation-prone
system.
In this study, we report the development and validation of a novel, easy to implement method
in which an aggregation-prone region of a protein of interest is engineered into a loop of the
mechanically stable monomeric carrier protein, protein L. The central NAC region (residues
6
assess this display system as this hydrophobic, 12-residue sequence (71VTGVTAVAQKT82V) is known to be both sufficient and necessary for aggregation(24) and to form the core of fibrils
of wild-type Syn (30). We show that protein L is a suitable scaffold protein, maintaining its
structure and stability after insertion of guest sequences. SMFS experiments using an AFM tip
and surface derivatised with the protein L scaffold containing Syn71-82 yield rupture events
with correlated dissociation force and unfolding distances. By contrast, protein L constructs
containing a control (GS)6 linker or Syn71-82 (the central NAC region derived from the less
aggregation-prone Syn homologue of Syn(31; 32)) yielded insignificant rupture events.
Interestingly, an interaction is observed between Syn71-82 and Syn71-82 using SMFS in the pL
scaffold, consistent with the postulated interaction between the full length proteins(32). We
then use native electrospray ionisation-ion mobility spectrometry-mass spectrometry
(ESI-IMS-MS), which enables the detailed interrogation of individual species within a
heterogeneous, assembling mixture(33-37), to validate these results. SMFS can thus yield
novel insight into the early stages of amyloid formation by insertion of aggregation-prone
sequences of interest into the mechanically and thermodynamically stable scaffold, protein
7
Results
Design and characterisation of a protein L scaffold.
A scaffold protein should (a) allow the presentation of the amyloidogenic peptide in a defined
geometry away from the surface; (b) be thermodynamically and mechanically stable after
insertion of the sequence of interest and (c) display minimal self aggregation. The IgG binding
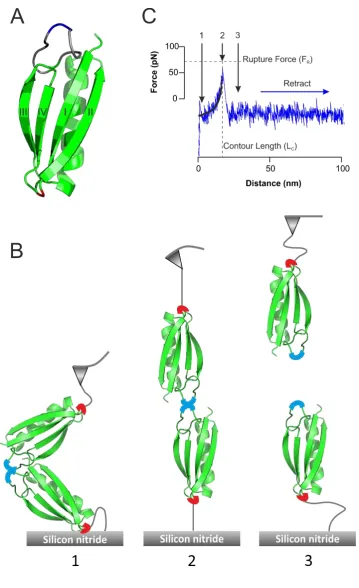
domain of protein L (Figure 1A) fulfils these criteria. This protein comprises a four stranded
-sheet packed against an -helix and has been shown previously to withstand the insertion
of both folded and unfolded amino-acid sequences into the 3- 4 loop(38) and to show
mechanical resistance when extended via its termini(39). The scaffold shown in Figure 1A is
based on protein L W47Y I60F (herein termed pL), a variant rationally designed to display
enhanced mechanical strength(40). To ensure that the guest peptide sequence is sterically
free from the pL host, the amyloidogenic peptide was inserted into the centre of the 3- 4
loop that had been extended by 13 residues (generating 55G GGA‘GS
GSA‘GGG 56Y, Supplementary Figure S1). Finally, a cysteine residue was
introduced into the 1- 2 loop (N14C) distal to the graft site. This allows the specific
immobilisation of the scaffold onto a substrate in a geometry that presents the guest
sequence to the solution (allowing dimerisation when immobilised onto the AFM tip and
surface, Figure 1B) and that upon extension would shear the pL N- and C-terminal strands
apart. This extension geometry has previously been shown to be mechanically robust(39; 40).
pL scaffolds presenting Syn71-82 (Supplementary Figure S2) and a twelve-residue
non-aggregating control sequence ((GS)6, herein named GS) were constructed and each protein
expressed and purified (Supplementary Figure S3, Materials and Methods). After verification
8
construct was assessed by far-UV CD and fluorescence emission spectroscopy. These
experiments verified that all three proteins exhibited CD-spectra consistent with a mixed /
topology similar to that reported for wild-type protein L(41) (Supplementary Figure S4A).
Similarly, fluorescence emission spectra which exhibit a red shift in their maxima upon
denaturant-induced unfolding were observed for all proteins (Supplementary Figure S4B). As
expected for natively folded variants of protein L, thermal denaturation monitored by far-UV
CD revealed co-operative unfolding transitions at a similar temperature for pL GS and pL
Syn71-82 (Tm values of 45.5 and 46.6 oC, respectively, Supplementary Figures S4C and D).
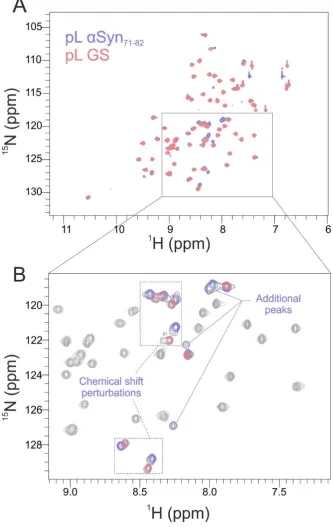
As a more sensitive probe for structural perturbations, the 1H-15N heteronuclear single quantum coherence spectroscopy (HSQC) NMR spectra of pL Syn71-82 and pL GS were
acquired (Figure 2). Both spectra show similarly dispersed, well defined peaks of similar
intensity, characteristic of stably folded proteins (Figure 2A). Five additional main chain peaks
were observed for pL Syn71-82 compared with pL GS (Figure 2B), likely due to the chemical
shift redundancy of the glycine residues in the (GS)6 linker and extended loop. Most of the
additional peaks for pL Syn71-82 are observed at 1H chemical shifts that are diagnostic of an unfolded protein conformation (8.0 ppm), suggesting that these peaks indeed arise from the
Syn71-82 in an unfolded conformation within the loop region. Overall, the CD, fluorescence
and NMR data show that grafting a twelve residue peptide sequence into the extended
3-4 loop does not perturb the structure or stability of pL, validating its use a display scaffold
for SMFS experiments.
Dimerisation of the Syn central NAC region detected by SMFS
To determine whether the association of Syn71-82 could be detected in the context of the
9
decorated with either pL Syn71-82 or pL GS (Materials and Methods). After mounting in the
AFM, force-extension profiles were accumulated. After filtering (Materials and Methods),
traces rofile (Figure 1C) were
binned for analysis. The number of these events relative to the total number of
approach-retract cycles (in triplicate)
probability of measuring the rupture (and therefore the presence) of a protein-protein
interaction. As shown in Figure 1C, for each force-extension profile, the force at rupture (FR)
of the interaction and the end-to-end length of the dimer (Lc) at rupture was measured. To
obtain Lc, force-extension profiles were fitted to the WLC model (Materials and Methods,
Equation 1). Finally, to assess whether the observed dissociation events produced
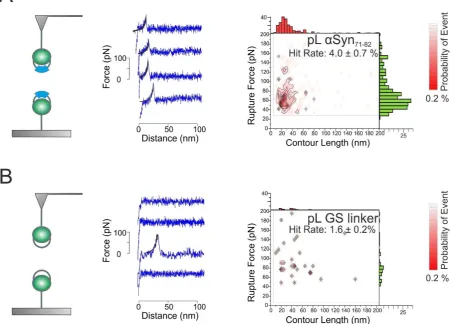
reproducible and correlated values of LC and FR, contour plots were generated (Figure 3).
Comparison of the force-extension profiles and contour plots obtained for pL Syn71-82 and pL
GS (Figure 3A, B) revealed that the dissociation of pL Syn71-82, but not pL GS, can be detected
and quantified using SMFS. Force-extension profiles for pL Syn71-82 typically produced a
single sawtooth (Figure 3A), as expected for an extensible chain(42) with correlated FR and LC
values (57 ±1 pN and 22 ±1 nm, respectively) and a hit-rate of 4.0 ± 0.7 %. By contrast,
force-extension profiles for pL GS were generally featureless (Figure 3B). For this protein, the
frequency of binned events was lower (1.6 ± 0.2
interaction) in the contour plot. These data indicate that SMFS can detect intermolecular
interactions between amyloidogenic peptides. The modal rupture force is surprisingly large
given the expected transient nature and the relatively small interaction surface of the
10
to that measured for full length Syn(14; 16; 17) and other protein:protein interactions
mediated by short peptide sequences(43).
Dynamic force spectroscopy of the Syn central NAC region
Despite the small size of the peptide fragment Syn71-82 under study here, the data
demonstrate that interaction between these sequences is sufficiently strong to be detected
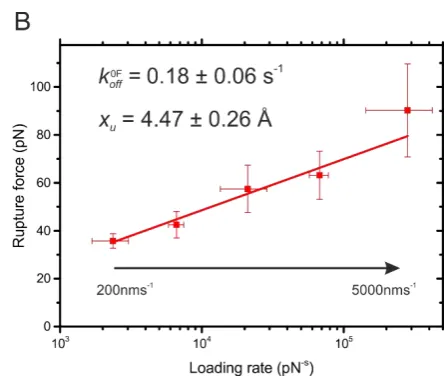
by SMFS. In order to characterise this dimer interaction further, Dynamic Force Spectroscopy
(DFS) was carried out allowing parameters of the unbinding energy landscape to be calculated
(Figure 4A). The SMFS experiments were carried out at pulling velocities ranging from 200
5000 nms-1 (Figure 4B). After calculation of the loading rate at rupture Materials and Methods,
Equation 2), the dissociation rate constant in the absence of force ( ) and the distance
between the dissociation energy barrier and the bound ground state (xu) was calculated using
the Bell-Evans model(44; 45) (Materials and Methods, Equation 3). The dissociation rate
constant for pL Syn71-82 dimers ( = 0.18 s-1, lifetime 6s) is comparable to the dissociation
rate constant of full length Syn (0.25 s-1 at pH 2.7 and 0.74 s-1 at pH 3.7 measured by SMFS)(9). The finding that the lifetimes of dimers of full length Syn and Syn71-82 dimers are
of comparable magnitude suggests that residues 71-82 play a key role in the stability of
dimeric species formed from the intact protein.
SMFS identifies a novel interaction between Syn71-82 S 71-82
While the presence or absence of SMFS rupture peaks for dimers of pL Syn71-82 and pL GS,
respectively suggests that the former protein self-interacts, it does not report on the
specificity of this interaction. To address this question, we inserted the central NAC domain
of another member of the synuclein fam S into the pL scaffold. The central NAC
11
71VSSVNTVATKTV82) and these differences (Supplementary Figure S2) may play a role in the greater amyloidogenic propensity observed for Syn(31; 32).
A L S 71-82 (Supplemental Figure S3
and S4, Supplementary Table 1), SMFS L S 71-82 on the
AFM L S 71-82 on the AFM tip and pL Syn71-82 on
surface) dissociation events. Surprisingly, the force-extension profiles and contour plots for
L S 71-82 dissociation (Figure 5A) show no evidence for formation of
a force-resistant structure (hit rate = 0.6 ± 0.3 By contrast, the
L S 71-82:pL Syn71-82 heterodimers was readily detected using SMFS
yielding comparable LC and FR values (19 ± 1 nm and 53 ± 1 pN, respectively) to that of the
Syn71-82 homodimeric interaction, albeit at a lower frequency of detection (3.2 ± 0.8 %).
Importantly, the possibility that these observations arise from differences in immobilisation
efficiencies between each scaffold was ruled out by sequential experiments that used the
same derivitised tip but different substrates (Supplemental Figure S5). The results thus
portray the first observation of a heterodimeric interaction in an aggregating system by SMFS
and also the first observation that the central NAC region of Syn is sufficient to interact with
the corresponding sequence of its homologue Syn. Uversky and colleagues have shown
previously that full length Syn fibrillation is inhibited by the presence of Syn(32). One
possible interpretation is that this inhibitory effect is mediated by the interaction between
the central NAC regions of these proteins.
Native mass spectrometry of pL constructs
SMFS shows that the central NAC regions of - and Syn are able to dimerise and be of
12
observation, ESI-MS was used as an orthogonal method to detect dimerisation. This soft
ionisation method enables preservation of non-covalent interactions in the gas phase and
allows resolution of heterogeneous species that differ in mass or charge state and, when
coupled to ion mobility spectrometry (ESI-IMS-MS), cross-sectional area (46). These
experiments were performed using 100 M pL constructs in 100 mM ammonium acetate pH
6.8 and, to measure formation of heterodimers, equal volumes of each sample were mixed.
ESI-MS data were then accumulated immediately (t = 0) or after quiescent incubation for 4 h
at 25 °C. Comparison of the ESI mass spectra for pL GS, pL Syn71-82, pL Syn71-82 and 1:1 pL
Syn71-82:pL Syn71-82 showed that all pL constructs were initially monomeric upon dilution (t
= 0, Supplemental Figure S6). In accord with the SMFS experiments described above, pL GS
remained monomeric after incubation. In contrast, dimers, in addition to monomers, were
observed for pL Syn71-82 alone, with monomers-trimers present for pL Syn71-82 and for
mixtures of 1:1 pL Syn71-82:pL Syn71-82 (Supplementary Figure S6). For each charge state of
the heterodimeric species, the difference in the molecular masses of pL Syn71-82 and pL
Syn71-82 (10,391 and 10,423 Da, respectively) is sufficient to resolve three peaks representing
homodimers of pL Syn71-82 and pL Syn71-82 (at m/z values centred on 2282 and 2289, Figure
6) and a heterodimer (m/z centred on 2285) corroborating the observation of a heterodimer
in SMFS experiments. Interestingly, despite mixing an equal concentration of each variant,
the relative intensity of each dimer species differs and mirrors the hit rate observed by SMFS
experiments (from highest to lowest apparent dimer population: > In the mixed
samples, peaks from monomeric proteins (Supplementary Figure S6) were of similar
intensities, suggesting that the two peptides ionise with similar efficiency. This observation
suggests that the intensities of dimer peaks indeed reflect the relative affinity of the different
13
To preclude the possibility that the interactions observed by SMFS and ESI-MS arise from the
pL scaffold, the ESI-MS experiments were repeated using Syn71-82 and Syn71-82 as synthetic
peptides. ESI-IMS-MS driftscope plots of the peptides alone and in a 1:1 mixture showed the
presence of monomeric to tetradecameric species (Supplemental Figure S7). The higher order
of species observed for the peptide-only variants suggests that packing restraints of the
scaffold disfavours larger oligomer formation. Despite these differences, homodimers and
heterodimers were formed upon mixing equimolar Syn71-82: Syn71-82, confirming that
Syn71-82 and Syn71-82 sequences interact independently of the pL scaffold.
Characterising the aggregation of pL constructs
We have shown that the central NAC regions of Syn and Syn are sufficient to allow the
formation of transient homo- and hetero-dimers and that this interaction is preserved when
these short sequences are inserted into the pL scaffold. To investigate whether these
pL-peptide chimeras are able to form amyloid fibrils, we examined the amyloid growth kinetics
of pL Syn71-82 and pL Syn71-82 using thioflavin T (ThT) fluorescence (Figure 7). In addition, as
full length Syn has previously been shown to inhibit the kinetics of Syn aggregation(32), we
also measured the amyloid growth kinetics of a 1:1 mixture of pL Syn71-82 and pL Syn71-82 to
test whether this inhibitory interaction was mediated by the central NAC region. The end
point of ThT fluorescence emission intensity was similar for both pL Syn71-81 and pL Syn71-82
(785 ± 122 and 929 ± 83 arbitrary units, respectively after 100 h) while the mixed sample
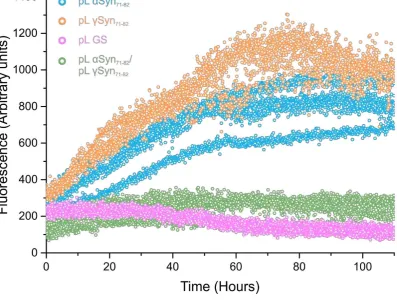
appeared unable to aggregate as studied by this assay (Figure 7). pL GS did not aggregate into
ThT-positive species. Similar experiments performed on the synthetic peptides also showed
that a 1:1 mixture of Syn71-81 and Syn71-82 resulted in a significant increase in lag-time (2.5 x
14
(Supplemental Figure S8)). These data suggest that the heterodimeric interaction identified
by SMFS and ESI-MS inhibits aggregation. This supports the finding that the inhibitory effect
reported for full length Syn on the aggregation of Syn is mediated by the interaction
between their central NAC regions. It is important to note however, that the SMFS and
ESI-MS experiments were carried out in different buffer conditions due to the buffer limitations
in ESI-MS experiments. It is widely recognised that ionic strength and pH affect the rates and
the dominating mechanisms in amyloid formation (47-49). However, the inhibitory effect that
Syn71-82 exerts on Syn71-82 was also observed in aggregation assays performed in ESI- MS
buffer conditions (Figure S9).
Discussion
In this study we describe the generation, characterisation and proof-of-concept of a novel
approach to facilitate the investigation of interactions between amyloidogenic peptides using
SMFS. Using protein L as a display system, we were able to interrogate the specific
interactions between synuclein sequences and to minimise the contributions of non-specific
events that often occur at the surface-proximal regions of force-distance curves(50). Our
approach also restricts the application of force to a defined geometry, giving more confidence
that specific dimer interactions are being interrogated in a consistent manner.
Importantly, we have shown that protein L maintains sufficient stability upon insertion of
amyloidogenic sequences to fold to a native state. This is significant as the ability of chimeric
pL constructs to fold to a native state is integral to the ability to display peptide sequences to
reduce non-specific tip-surface interactions.
Whilst the aim of this study was to assess the potential of a scaffold display for SMFS
15
Syn and its less aggregation-prone homologue Syn, by both SMFS and native ESI-mass
spectrometry. Firstly, DFS of the dissociation of pL Syn71-82 dimers revealed a lifetime that is
similar to that of full length Syn (6 and 4 s for pL Syn71-82 and full length Syn, respectively)
measured using the same technique (9). It is important to note, however, that previous SMFS
experiments on full length Syn were conducted at acidic pH where the full length protein is
closer to its pI and therefore more prone to aggregation(7; 9; 12; 14; 16; 17). The experiments
carried out here were conducted at a more physiological pH (pH 7.5) and are therefore more
applicable to the conditions in which the protein self-associates in vivo.
To investigate the specificity of the dimer interaction, the dissociation of pL Syn71-82:pL
Syn71-82 heterodimers was also investigated by SMFS. Surprisingly, no reproducible
correlation between FR-Lc values was found for pL S 71-82 homodimers, suggesting that under the conditions used, dimerisation did not occur or that these dimers dissociated more
quickly or at a force that cannot be detected in this experiment. By contrast, dissociation of
the Syn71-82 S 71-82 heterodimer yielded AFM data that were similar to those obtained for pL Syn71-82 homodimers. Despite this similarity, a population of pL Syn71-82:pL Syn71-82
dimers inhibits aggregation in the context of both chimeric pL constructs and synthetic
peptides equivalent to the central NAC region in isolation. This suggests that the mechanism
by which full length Syn inhibits the aggregation of Syn(32) may be mediated by the central
NAC region of the proteins. As both Syn and S sed in many of the same
cells of the brain(51), it may be postulated that heterogeneous Syn and S
in vivo which may chaperone Syn away from aggregation under normal cellular conditions.
16
study(52) S 71-82 S
peptides can increase its aggregation.
Together these observations provide further support for the central role of the NAC sequence
in the aggregation of full length Syn. The ability of Syn to inhibit the aggregation of Syn,
challenges this notion, as this homologue has no NAC region but forms transient interactions
with Syn up- and down-stream from the NAC sequence(32; 53). It is becoming clear that
this intrinsically disordered protein displays conformational plasticity and that long range
intra- and inter-chain interactions between the termini of this protein, which can be disrupted
by changes in pH or mutation, may modulate the interaction potential of NAC(54-56). The
development of a facile method that will allow the relative frequency and dissociation rate of
these, and other interactions, such as that reported here, may help to understand the early
events in the aetiology of Syn aggregation relevant to P
Materials and methods
Expression and purification of pL constructs
pL constructs (Supplementary Figure S1) encoded on pET23a plasmids were expressed in E.
coli BL21 (DE3) cells. Briefly, overnight starter cultures were used to inoculate 10 x 1L LB
medium supplemented with 100 g/ml ampicillin and grown to an optical density at 600 nm
= 0.6. Protein expression was then induced by addition of IPTG to a final concentration of 1
mM. The cultures were allowed to grow for a further 4 h before harvesting. Cell pellets were
resuspended in lysis buffer (20 mM Tris.HCl pH 8.0, 300 mM NaCl, 20 mM imidazole, 2 mM
DTT, 0.025 % (w/v) sodium azide, 1 mM PMSF, 2 mM benzamidine, 0.15% (v/v) Triton X100,
DN and ), homogenised and further lysed by cell disruption
17
were purified by affinity chromatography using a 5ml His-Trap FF column (GE Healthcare)
equilibrated with lysis buffer (without Triton X100, DNase and lysozyme) and eluted by a
stepped gradient (25, 50 and 100%) of 20 mM Tris.HCl pH 8.0, 300 mM NaCl, 250 mM
imidazole, 2 mM DTT, 0.025 % (w/v) sodium azide, 1 mM PMSF, 2 mM benzamidine. pL
complexes were further purified using size exclusion chromatography (HiLoadTM 26/60
Superdex 75 prep grade column, GE Healthcare) equilibrated with 25 mM Tris.HCl, 300 mM
NaCl, 2 mM DTT, pH 8. The protein was then dialysed into 20 mM HEPES, pH 7.5 (for pL SMFS
experiments) and flash frozen with liquid N2. The presence, purity and the correct mass of
proteins were confirmed by ESI-MS.
Thioflavin T (ThT) aggregation assays
M L M HEPES M T T H were incubated at 37 oC shaking
at 600 rpm in a BMG Labtech FLUOstar optima plate reader in Corning 96-well flat bottom
assay plates. Plates were sealed with StarSeal advanced polyolefin film (Starlab, Hamburg,
Germany). To monitor growth kinetics, samples were excited at 444 nm and the fluorescence
emission was monitored at 480 nm with a gain of 1450. Data were accumulated every 6.67
minutes over a period of >100 h.
Synuclein peptides and Thioflavin T (ThT) fluorescence
S 71-82 S 71-82 peptides were purchased from Genscript, NJ, USA at > 99% purity. All
peptides were N-terminally acetylated and C-terminally amidated. Peptides were dissolved in
HFIP M C -well flat
18
dry peptide in the we M HEPES M T T H
M I C
Plates were sealed with StarSeal advanced polyolefin film from Starlab, Hamburg, Germany.
The fluorescence of the samples were excited at 444 nm and the fluorescence emission was
monitored at 480 nm on a BMG Labtech FLUOstar optima plate reader with a gain set at 1450.
Where normalised data is presented, it has been processed on the plate reader software and
normalised (after buffer subtraction) between 0 and 100. Lag time analysis was carried out
by manually fitting a linear regression of the steepest exponential region of the ThT curves on
Origin Pro 9.1 software. The fit was extrapolated to calculate the x-intercept (quoted lag
times).
1H-15N HSQC NMR spectroscopy
1H-15N HSQC spectra of M pL Syn71-82 L S 71-82 (20 mM HEPES buffer, 10 % (v/v)
D2O and 0.02% (w/v) sodium azide, pH 7.5) were recorded on an AVANCE III Bruker
spectrometer (600 MHz) equipped with a cryogenic probe. Spectra were processed in
NMRPipe and analysed in CCPN analysis.
Negative stain transmission electron microscopy (TEM)
Protein samples were pipetted onto the surface of carbon coated copper grids and stained
with 1 % (w/v) uranyl acetate. Images were taken on an FEI T12 electron microscope.
AFM surface and cantilever derivatisation
AFM surface and cantilever functionalisation was performed as described previously(43).
Prior to an experiment, AFM probes and surfaces were immersed in 1 ml chloroform
l of 250 mM maleimide-PEG-NHS ester (MW 3400 Da, Nanocs NY USA) in
19
polydisperse with masses ± 5% of the stated mass. AFM probes and surfaces were then
washed with chloroform and dried with a stream of N2 gas.
100 l pL constructs (50 µM in 20 mM HEPES, pH 7.5) containing engineered cysteine residues
were deposited over the functionalised surface and AFM probe and left to incubate in a
covered container for 30 minutes at room temperature. All proteins analysed by SMFS were
immobilised to functionalised probes and surfaces in the presence of 1 mM TCEP
(tris(2-carboxyethyl)phosphine) to limit disulphide cross-linkage between proteins. Unreacted
protein was then washed from the surface and AFM probe with excess reaction buffer.
Force spectroscopy
All AFM measurements were conducted on an Asylum MFP-3D microscope using Si3N4
cantilevers with nominal spring constants of 30 pNnm-1 (Bruker MLCT). For each cantilever used, the spring constant was determined using the thermal method(57) using Asylum
software. The approach speed was kept constant at 2 µms-1. A retraction speed of 1000 nms -1 was used for SMFS experiments that probed the dimerisation of scaffolds. Typically force
maps of 500 force-distance curves were taken over a 20 µm2 area. One dataset typically comprised 4 force maps (2000 force distance curves). All experiments were conducted in
20mM HEPES pH 7.5 at room temperature.
All force spectroscopy data were analysed using IGOR pro 6.32A with an Asylum Research
extension (MFP3DXop v30). A force-extension profile was binned for analysis when single
characteristic, parabolic WLC events were observed. For each profile, the force (FR) and
contour length (LC) at rupture was measured. To obtain LC, each force-extension profile was
20
(1)
where is the entropic restoring force, is the extension, is the persistence length, is
the Boltzman constant, T is absolute temperature, LC is the contour length. Hit rates were
calculated as the number of hits as a percentage of total approach-retract cycles. The average
values over multiple experiments are quoted. The errors on hit rates are the standard
deviation between experiments.
Single Gaussian distributions were fit to frequency histograms in order to determine the most
probable FR and LC for each retraction velocity investigated. For each pulling velocity used,
data were collected in triplicate (using a freshly prepared cantilever for each repeat).
To obtain a dynamic force spectrum (DFS), force-extension data were collected using
retraction speeds between 200-5000 nms-1. To analyse these data, loading rates were calculated by fitting a WLC model to the rising edge of each unbinding profile when plotted
as force versus tip-sample separation. The instantaneous gradient of this fit at rupture
(WLCslope) was calculated by inserting the derived contour length and extension at rupture
into a differentiated form of the same equation (Equation 2). The loading rate at rupture was
then obtained by multiplying this value by the retraction velocity.
21
where; p is the persistence length, LC is the contour length, x is the extension, is the
Boltzmann constant and T is the temperature.
The natural logarithm of the mean loading rate (Ns-1) at each velocity was plot against the mean rupture force (N) which gives a linear relationship. The Bell-Evans model(44) (Equation
3) was rearranged to use the gradient of the linear fit to calculate the distance from the
transition state (xu) and the y-intercept for the off rate at zero force ( )
(3)
where kB B T is temperature (in Kelvin), rf is the rate at which force is
loaded onto the complex or loading rate, xu is the distance from the low energy state to the
transition state and is the spontaneous unfolding or unbinding rate in the absence of
force.
Mass spectrometry
A Synapt HDMS quadrupole-time-of-flight mass spectrometer (Waters Corpn., Manchester,
UK), equipped with a Triversa NanoMate (Advion Biosciences, Ithaca, NY, USA) automated
nano-ESI interface, was used for these analyses. The instrument has a travelling-wave IMS
device situated between the quadrupole and the time-of-flight analysers.
S S an pL chimeric constructs M
mM ammonium acetate buffer, pH 6.8) were analysed using positive mode nanoESI with a
capillary voltage of 1.7 kV and a nitrogen nebulising gas pressure of 0.8 psi. The following
22
pressure 3.2 mBar; ramped travelling wave height 7 20 V; travelling wave speed 300 ms-1; IMS cell pressure 0.55 mBar. Data were acquired over the range m/z 500 6,000. Data were
processed by use of MassLynx v4.1 and Driftscope v2.4 software supplied with the mass
spectrometer. Mass calibration was achieved using caesium iodide solution, prepared by
dissolving the compound in 50 % (v/v) water/ isopropanol to a concentration of 2 mg/ml.
Circular dichroism (CD)
Far UV (190- CD M L M
phosphate buffer, 2 mM DTT, pH 8.0) in a 1 mm path length curvette (Hellma) using a
ChirascanTM plus CD Spectrometer (Applied Photophysics, U.K.). CD spectra were acquired
using a 1 nm bandwidth at room temperature, 1 s time step. Three scans were taken per
sample.
For thermal denaturation experiments, a temperature gradient from 20 to 90 oC in 1 oC steps was performed. Protein samples were incubated for 180 s at each temperature before CD
spectra were taken as above. The thermal melt data were analysed on Photophysics Global3
software.
Fluorescence spectroscopy
I M L M
buffer, 2mM DTT, pH 8.0) were measured on a Photon Technology International fluorometer
(Ford, West Sussex, UK). Excitation and emission slit widths were set to 1 and 2 nm,
respectively. Proteins were excited at 280 nm and emission spectra were recorded at 290-
23
state. The unfolded state was recorded in the same conditions as above in the presence of
24
Supplementary material
Supplementary figures and tables are included in the file Supplementary_Material.docx
Acknowledgments
The authors acknowledge funding of BBSRC BRIC case studentship to CPAD (BB/K02101X/1),
and the support of the European Research Council under the European Union S
Framework Programme FP7.2007-2013/Grant agreement number 322408. We thank the
Wellcome Trust (grant code 094232) for the purchase of a Chiroscan CD spectrometer and
the Wellcome Trust (grant code 094232) and the University of Leeds for funding the NMR
instrumentation. The Synapt HDMS mass spectrometer was purchased with funds from the
BBSRC (BB/E012558/1).
Figure Legends
Figure 1.Using pL as a peptide-presenting scaffold. (A) Structural model of the pL scaffold.
The 3-4 loop, peptide insert and Cys residue for immobilisation are shown in grey, blue and
red, respectively. The 3-4 loop was extended using SWISS-MODEL and the PDB file
1HZ6(59)). (B) Measuring chimeric pL dimer dissociation using the AFM. The derivitised AFM
tip is brought into contact with a similarly derivitised surface (1) allowing dimerisation via the
guest peptide. The complex is then extended by retracting the cantilever, the force generated
bends the cantilever and reaches a maximum (2) at complex dissociation (rupture force (FR))
prior to relaxation (3). (C) Typical force-extension profile of the force induced dissociation of
a mechanically resistant dimer. The positions of dimerisaton (1), dissociation (2) and
relaxation (3) are shown. The contour length (LC) and FR are measured for each dissociation
event, the latter parameter obtained by fitting the Worm Like Chain (WLC) model (black
25
Figure 2. pL Syn71-82 and pL GS have similar structures as revealed by HSQC NMR. The data
presented shows 600 MHz 1H-15N HSQC-NMR spectra of 15N labelled pL Syn71-82 and pL GS. (A) Overlaid spectra of pL GS (red peaks) and pL Syn71-82 (blue peaks). Both spectra have
dispersed and well defined peaks characteristic of folded proteins. Additional peaks observed
for pL Syn71-82 at 8 ppm in the 1H dimension most likely arise from residues in the inserted
peptide in an unfolded conformation. (B) Expanded region highlighting additional peaks that
are observed for pL Syn71-82 in the region of the spectrum consistent with inserted peptide
having an unfolded dynamic conformation. A small number of residues showing chemical shift
perturbations are also highlighted (blue dashed boxes). Shifts arise because residues form
part of, or are close to, the 3- 4 loop.
Figure 3.SMFS can detect dissociation events for pL Syn71-82 but not pL GS. Schematic (left),
sample force extension profiles (middle) and a FR versus Lc scattergram (right, rendered as a
contour plot and showing the associated Lc and FR frequency-histograms above and to the
side, respectively for (A) pL Syn71-82 and (B) pL GS dissociation events. WLC fits (black line)
are fit to the force-extension profiles. The contour plot for pL Syn71-82 shows a
reproducible and correlated LC and FR values. N s visible for pL GS dissociation
events. The total number of force-retract cycles (total triplicate) are 8000 and 2500 for pL
S 71-82 and pL GS dimerisation interactions, respectively.
Figure 4. Using dynamic force spectroscopy to investigate Syn71-82 dissociation. (A)
Schematic representation of an unbinding energy landscape. The dotted line depicts the tilted
energy landscape under force. xU is depicted as the distance from the bound energy well to
26
barrier. (B) Dynamic force spectrum of Syn71-82 dissociation. Data (mean of the triplicate
datasets, error bars are the standard deviation) are fitted to the Bell-Evans model(44; 45) to
obtain values and xU (shown inset). The errors of the and xU were calculated by
manual bootstrapping. The total number of approach retract cycles (total triplicate) for pL
Syn71-82 dimer dissociation events are 5200, 5500, 6500, 6000 and 5500 for pulling speeds
200, 500, 1000, 3000 and 5000 nms-1, respectively.
Figure 5. SMFS can detect dissociation events for pL Syn71-82: pL Syn71-82 heterodimers
but not pL Syn71-82 homodimers. Schematic (left), sample force extension profiles (middle)
and a FR versus Lc contour plot (right), showing the associated Lc and FR frequency-histograms
above and to the side, respectively for (A) pL Syn71-82 homodimer dissociation events and (B)
pL Syn71-82:pL Syn71-82 heterodimer dissociation events. WLC fits (black line) are fit to force
W L Syn71-82
homodimers, the contour plot for dissociation of the heterodimer
reproducible and correlated LC and FR values. The modal LC and FR were calculated to be 19 ±
1 nm and 53 ± 1 pN, respectively. The total number of approach retract cycles (total triplicate)
for pL S 71-82 S 71-82 S 71-82 heterodimerisation interactions are both 2500.
Figure 6. Dimeric species of chimeric pL constructs analysed by ESI-MS. ESI-mass spectra
showing two different charge states (7+ and 9+) of the dimeric species formed after 4h
incubation of pL GS (pink), pL Syn71-82 L S 71-82 (orange) and 1:1 pL Syn71-82 and
L S 71-82 (heterodimer coloured green). The numbers denote the oligomer order, with the
27
after 4h. The difference in mass between pL Syn71-82 L S 71-82 allows pL Syn71-82 and
L S 71-82 homodimers and heterodimeric species to be readily discerned from one another.
Figure 7. ThT fibril formation assays show that pL Syn71-82 inhibits the aggregation of pL
S 71-82. ThT fluorescence assay showing the normalised fluorescence over time of pL
Syn71-82 L S 71-82 (orange), pL GS (pink) and the 1:1 mix of pL Syn71-82 and pL
S 71-82 (green). Proteins were incubated at 37°C, 600 rpm at a final concentration of 100
28
Conflict of Interest Statement
29
References
1. Dobson CM (2003) Protein folding and misfolding. Nature 426:884-890.
2. Dobson CM (2004) Principles of protein folding, misfolding and aggregation. Semin Cell Dev Biol 15:3-16.
K TPJ V M D CM T
Nat Rev Mol Cell Biol 15:384-396.
4. Verma M, Vats A, Taneja V (2015) Toxic species in amyloid disorders: oligomers or mature fibrils. Ann Indian Acad Neurol 18:138-145.
5. Cremades N, Cohen SIA, Deas E, Abramov AY, Chen AY, Orte A, Sandal M, Clarke RW, Dunne P, Aprile FA, Bertoncini CW, Wood NW, Knowles TPJ, Dobson CM, Klenerman D (2012) Direct observation of the interconversion of normal and toxic forms of alpha-synuclein. Cell 149:1048-1059.
6. Lv ZJ, Krasnoslobodtsev AV, Zhang YL, Ysselstein D, Rochet JC, Blanchard SC, Lyubchenko YL (2015) Direct detection of alpha-synuclein dimerization dynamics: single-molecule fluorescence analysis. Biophys J 108:2038-2047.
7. McAllister C, Karymov MA, Kawano Y, Lushnikov AY, Mikheikin A, Uversky VN,
Lyubchenko YL (2005) Protein interactions and misfolding analyzed by AFM force spectroscopy. J Mol Biol 354:1028-1042.
8. Sandal M, Valle F, Tessari I, Mammi S, Bergantino E, Musiani F, Brucale M, Bubacco L, Samori B (2008) Conformational equilibria in monomeric alpha-synuclein at the single-molecule level. PLoS Biol 6:99-108.
9. Yu JP, Malkova S, Lyubchenko YL (2008) Alpha-synuclein misfolding: single molecule AFM force spectroscopy study. J Mol Biol 384:992-1001.
10. Brucale M, Sandal M, Di Maio S, Rampioni A, Tessari I, Tosatto L, Bisaglia M, Bubacco L, Samori B (2009) Pathogenic mutations shift the equilibria of alpha-synuclein single molecules towards structured conformers. ChemBioChem 10:176-183.
11. Dougan L, Li J, Badilla CL, Berne BJ, Fernandez JM (2009) Single homopolypeptide chains collapse into mechanically rigid conformations. Proc Nat Acad Sci 106:12605-12610. 12. Yu JP, Lyubchenko YL (2009) Early stages for parkinson's development: alpha-synuclein
misfolding and aggregation. J Neuroimmune Pharm 4:10-16.
13. Kim BH, Palermo NY, Lovas S, Zaikova T, Keana JFW, Lyubchenko YL (2011) Single-molecule atomic force microscopy force spectroscopy study of amyloid beta-40 interactions. Biochem 50:5154-5162.
14. Yu JP, Warnke J, Lyubchenko YL (2011) Nanoprobing of alpha-synuclein misfolding and aggregation with atomic force microscopy. Nanomed Nanotech Biol Med 7:146-152. 15. Hervas R, Oroz J, Galera-Prat A, Goni O, Valbuena A, Vera AM, Gomez-Sicilia A,
Losada-Urzaiz F, Uversky VN, Menendez M, Laurents DV, Bruix M, Carrion-Vazquez M (2012) Common features at the start of the neurodegeneration cascade. PLoS Biol 10. 16. Krasnoslobodtsev AV, Peng J, Asiago JM, Hindupur J, Rochet JC, Lyubchenko YL (2012)
Effect of spermidine on misfolding and interactions of alpha-synuclein. Plos One 7. 17. Krasnoslobodtsev AV, Volkov IL, Asiago JM, Hindupur J, Rochet JC, Lyubchenko YL (2013)
Alpha-synuclein misfolding assessed with single molecule AFM force spectroscopy: effect of pathogenic mutations. Biochem 52:7377-7386.
18. Yu H, Liu X, Neupane K, Gupta AN, Brigley AM, Solanki A, Sosova I, Woodside MT (2012) Direct observation of multiple misfolding pathways in a single prion protein
30
19. Lee CK, Wang YM, Huang LS, Lin SM (2007) Atomic force microscopy: determination of unbinding force, off rate and energy barrier for protein-ligand interaction. Micron 38:446-461.
20. Farrance OE, Paci E, Radford SE, Brockwell DJ (2015) Extraction of accurate biomolecular parameters from single-molecule force spectroscopy experiments. ACS Nano 9:1315-1324.
21. Tong ZH, Mikheikin A, Krasnoslobodtsev A, Lv ZJ, Lyubchenko YL (2013) Novel polymer linkers for single molecule AFM force spectroscopy. Methods 60:161-168.
22. Lv ZJ, Roychaudhuri R, Condron MM, Teplow DB, Lyubchenko YL (2013) Mechanism of amyloid beta-protein dimerization determined using single-molecule AFM force spectroscopy. Sci Rep 3.
23. Ueda K, Fukushima H, Masliah E, Xia Y, Iwai A, Yoshimoto M, Otero DAC, Kondo J, Ihara Y, Saitoh T (1993) Molecular-cloning of cDNA-encoding an unrecognized component of amyloid in Alzheimer Disease. Proc Natl Acad Sci USA 90:11282-11286.
24. Giasson BI, Murray IVJ, Trojanowski JQ, Lee VMY (2001) A hydrophobic stretch of 12 amino acid residues in the middle of alpha-synuclein is essential for filament assembly. J Biol Chem 276:2380-2386.
25. Walder R, LeBlanc M-A, Van Patten WJ, Edwards DT, Greenberg JA, Adhikari A, Okoniewski SR, Sullan RMA, Rabuka D, Sousa MC, Perkins TT (2017) Rapid
-helical protein enabled by efficient site-specific bioconjugation. J Am Chem Soc 139:9867-9875.
26. Oroz J, Hervas R, Carrion-Vazquez M (2012) Unequivocal single-molecule force spectroscopy of proteins by AFM using pFS vectors. Biophys J 102:682-690.
27. Krasnoslobodtsev AV, Zhang YL, Viazovkina E, Gall A, Bertagni C, Lyubchenko YL (2015) A flexible nanoarray approach for the assembly and probing of molecular complexes. Biophys J 108:2333-2339.
28. Maity S, Viazovkina E, Gall A, Lyubchenko YL (2017) Single-molecule probing of amyloid nano-ensembles using the polymer nanoarray approach. Phys Chem Chem Phys 19:16387-16394.
29. Vera AM, Carrion-Vazquez M (2016) Direct identification of protein-protein interactions by single-molecule force spectroscopy. Angewandte Chemie (International ed in English) 55:13970-13973.
30. Tuttle MD, Comellas G, Nieuwkoop AJ, Covell DJ, Berthold DA, Kloepper KD, Courtney JM, Kim JK, Barclay AM, Kendall A, Wan W, Stubbs G, Schwieters CD, Lee VMY, George JM, Rienstra CM (2016) Solid-state NMR structure of a pathogenic fibril of full-length human alpha-synuclein. Nat Struct Mol Biol 23:409-415.
31. Biere AL, Wood SJ, Wypych J, Steavenson S, Jiang YJ, Anafi D, Jacobsen FW, Jarosinski MA, Wu GM, Louis JC, Martin F, Narhi LO, Citron M (2000) Parkinson's disease-associated alpha-sylnuclein is more fibrillogenic than beta- and gamma-synuclein and cannot cross-seed its homologs. J Biol Chem 275:34574-34579.
32. Uversky VN, Li J, Souillac P, Millett IS, Doniach S, Jakes R, Goedert M, Fink AL (2002) Biophysical properties of the synucleins and their propensities to fibrillate - inhibition of alpha-synuclein assembly by beta- and gamma-synucleins. J Biol Chem 277:11970-11978.
31
34. Woods LA, Platt GW, Hellewell AL, Hewitt EW, Homans SW, Ashcroft AE, Radford SE (2011) Ligand binding to distinct states diverts aggregation of an amyloid-forming protein. Nat Chem Biol 7:730-739.
35. Young LM, Cao P, Raleigh DP, Ashcroft AE, Radford SE (2014) Ion mobility spectrometry-mass spectrometry defines the oligomeric intermediates in amylin amyloid
formation and the mode of action of inhibitors. J Am Chem Soc 136:660-670. 36. Young LM, Mahood RA, Saunders JC, Tu LH, Raleigh DP, Radford SE, Ashcroft AE (2015)
Insights into the consequences of co-polymerisation in the early stages of IAPP and amyloid beta peptide assembly from mass spectrometry. Analyst 14:6990-6999. 37. Young LM, Saunders JC, Mahood RA, Revill CH, Foster RJ, Ashcroft AE, Radford SE (2016)
ESI-IMS-MS: A method for rapid analysis of protein aggregation and its inhibition by small molecules. Methods 95:62-69.
38. Minard P, Scalley-Kim M, Watters A, Baker D (2001) A "loop entropy reduction" phage-display selection for folded amino acid sequences. Protein Sci 10:129-134.
39. Brockwell DJ, Beddard GS, Paci E, West DK, Olmsted PD, Smith DA, Radford SE (2005) Mechanically unfolding the small, topologically simple protein L. Biophys J 89:506-519.
40. Sadler DP, Petrik E, Taniguchi Y, Pullen JR, Kawakami M, Radford SE, Brockwell DJ (2009) Identification of a mechanical rheostat in the hydrophobic core of protein L. J Mol Biol 393:237-248.
41. Aden J, Wittung-Stafshede P (2014) Folding of an unfolded protein by macromolecular crowding in vitro. Biochem 53:2271-2277.
42. Marko JF, Siggia ED (1995) Stretching DNA. Macromolecules 28:8759-8770. 43. Hickman SJ, Cooper REM, Bellucci L, Paci E, Brockwell DJ (2017) Gating of
TonB-dependent transporters by substrate-specific forced remodelling. Nat Commun 8. 44. Evans E, Ritchie K (1997) Dynamic strength of molecular adhesion bonds. Biophys J
72:1541-1555.
45. Evans E (2001) Probing the relation between force - lifetime - and chemistry in single molecular bonds. Annu Rev Biophys Biomol Struct 30:105-128.
46. Erba EB, Petosa C (2015) The emerging role of native mass spectrometry in
characterizing the structure and dynamics of macromolecular complexes. Protein Sci 24:1176-1192.
47. Morel B, Varela L, Azuaga AI, Conejero-Lara F (2010) Environmental conditions affect the kinetics of nucleation of amyloid fibrils and determine their morphology. Biophys J 99:3801-3810.
48. Buell AK, Galvagnion C, Gaspar R, Sparr E, Vendruscolo M, Knowles TP, Linse S, Dobson CM (2014) Solution conditions determine the relative importance of nucleation and growth processes in alpha-synuclein aggregation. Proc Natl Acad Sci U S A 111:7671-7676.
49. Tipping KW, Karamanos TK, Jakhria T, Iadanza MG, Goodchild SC, Tuma R, Ranson NA, Hewitt EW, Radford SE (2015) pH-induced molecular shedding drives the formation of amyloid fibril-derived oligomers. Proc Nat Acad Sci 112:5691.
32
52. Jha NN, Ranganathan S, Kumar R, Mehra S, Panigrahi R, Navalkar A, Ghosh D, Kumar A, Padinhateeri R, Maji SK (2017) Complexation of NAC-derived peptide ligands with the C-Terminus of alpha-Synuclein accelerates its aggregation. Biochem.
53. Janowska MK, Wu KP, Baum J (2015) Unveiling transient protein-protein interactions that modulate inhibition of alpha-synuclein aggregation by beta-synuclein, a pre-synaptic protein that co-localizes with alpha-synuclein. Sci Rep 5.
54. Bertoncini CW, Fernandez CO, Griesinger C, Jovin TM, Zweckstetter M (2005) Familial mutants of alpha-synuclein with increased neurotoxicity have a destabilized conformation. J Biol Chem 280:30649-30652.
55. Bertoncini CW, Jung YS, Fernandez CO, Hoyer W, Griesinger C, Jovin TM, Zweckstetter M (2005) Release of long-range tertiary interactions potentiates aggregation of natively unstructured alpha-synuclein. Proc Natl Acad Sci USA 102:1430-1435.
56. Cho MK, Nodet G, Kim HY, Jensen MR, Bernado P, Fernandez CO, Becker S, Blackledge M, Zweckstetter M (2009) Structural characterization of alpha-synuclein in an aggregation prone state. Protein Sci 18:1840-1846.
57. Hutter JL, Bechhoefer J (1993) Calibration of atomic-force microscope tips. Rev Sci Instrum 64:1868-1873.
58. Bustamante C, Marko JF, Siggia ED, Smith S (1994) Entropic elasticity of lambda-phage DNA. Science 265:1599-1600.
Supplementary Material
[image:41.595.72.520.145.422.2]Supplementary figures
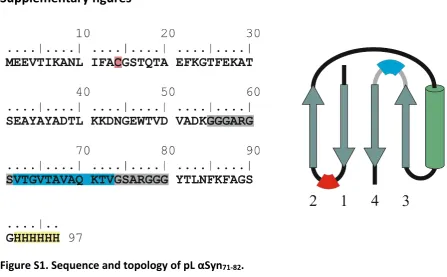
Figure S1. Sequence and topology of pL Syn71-82.
Left: primary sequence of pL Syn71-82. The sequences and position of the 3-4 loop
extension and the inserted Syn71-82 peptide are highlighted in grey and blue, respectively.
Peptide sequences for Syn71-82 and the non-aggregation control (GS)6 were inserted at the
same position as Syn71-82. The engineered cysteine residue used for immobilisation is
highlighted in red. Yellow highlighted text indicates the presence of a (His)6 tag to enable Ni2+ -affinity purification. Right: structural schematic showing the position of the engineered
cysteine residue used for immobilisation (red) relative to the position of the guest peptide
(blue) with the extended 3- 4 loop (pale grey). Extension by the blue and red regions would
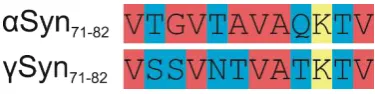
Figure S2. Sequence alignment of the central NAC regions of - and -synuclein.
Residue properties are colour coded: red (hydrophobic), blue (polar) and yellow (charged).
The sequences are highly homologous, 7/12 residues are identical and 3 of the 5 substitutions
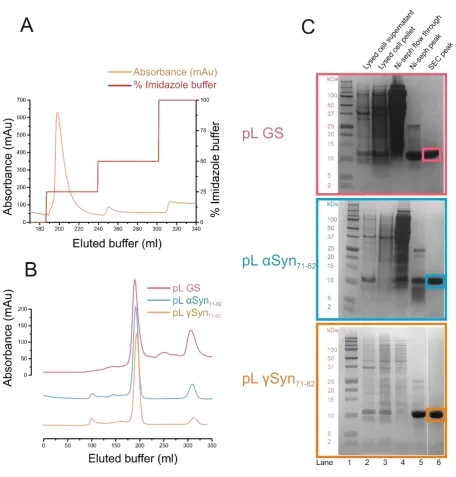
Figure S3. Two-step purification of pL variants.
(A) Typical elution profile for the Ni2+-Sepharose affinity chromatography step (pL Syn71-82). The protein eluted in 25 % imidazole is visualised in the fifth lane in each gel in (C). (B) Elution
profiles of the size exclusion chromatography step (SEC). The final purified protein after SEC
is shown in lane 6 of the gels shown in (C), highlighted with a coloured box. (C)
SDS-polyacylamide gels following the purification of pL GS (pink), pL 82 (blue) and pL
Figure S4.Spectroscopic analyses of pL variants.
(A) Far-UV CD spectra of 50 M pL GS (pink); pL Syn71-82 (blue) and pL Syn71-82 (orange). The
spectra are similar, exhibiting broad minima from ~210-220 nm, consistent with the mixed
/ topology of folded pL. (B) Intrinsic tryptophan fluorescence emission spectra of pL GS
(pink), pL Syn71-82 (blue) and pL Syn71-82, (orange) in the absence (solid lines) or presence of
8M urea (dashed lines). (C) Far UV-CD spectra as a function of temperature for pL S 71-82. (D) The relative populations of folded and unfolded conformations of pL S 71-82 and pL GS (blue and pink respectively) calculated from the global analysis of CD thermal melt data. The
Figure S5. SMFS experiment showing presence of interaction-competent L S 71-82 on the
AFM tip.
(A) Schematic of experimental setup. First the frequency of dissociation of pL Syn71-82
dimers (hit rate) was measured. The surface was then changed to one derivatised with pL
Syn71-82 and the frequency of heterodimer dissociation measured. This sample was then
replaced by the L S 71-82 functionalised surface and the dissociation frequency measured once more. (B) Contour plots and calculated hit rates from the experiments
described in (A). The intra-experimental errors between force maps are shown. The total
Figure S6. Native ESI-mass spectra of pL constructs immediately after dilution (t = 0) and
after 4 h.
ESI-mass spectra of pL GS (pink) L S 71-82 (blue), L S 71-82 (orange) and a 1:1 mix of pL
S 71-82 L S 71-82 (green) at t= 0 (left) and t = 4 h (right). The numbers above the peaks
denote the oligomer order, with the positive-charge state of ions in superscript. All variants
in isolation and a 1:1 mixture of pL Syn71-82 and pL Syn71-82 were present as monomer at t =
0 (left panel). After 4 h, all variants except the non-aggregating pL GS construct showed
self-association (right panel). All samples were diluted to a final total protein concentration of 100
Figure S7. Mass spectrometric analyses of S 71-82 S 71-82 peptides.
ESI mass spectra (left) and ESI IMS-MS driftscope plots (right) of S 71-82 (top), S 71-82 (middle) and S 71-82 and S 71-82 (bottom). The numbers above the peaks denote the oligomer order, with the positive-charge state of ions in superscript. All mass
spectra (left) confirm self-association of the peptides up to pentamer, with the 1:1 mix
showing a random distribution between the numb S 71-82 S 71-82 monomers in the oligomers. ESI IMS MS Driftscope plots (right) show monomeric to tetradecameric
species present in all of the samples, two minutes after diluting the monomer to a final
M mM acetate buffer pH 6.8. ESI IMS MS Driftscope
Figure S8 T T S 71-82 S 71-82 synthetic peptides. (A)
Normalised fluorescence signal over time of M S 71-82 (blue), M S 71-82 (orange) S 71-82 S 71-82 peptides (both at M, green). The lag times for Syn71-82, Syn71-82 and for the Syn71-82: Syn71-82 mixed incubation are 13.2 ± 2.1,
11.8 ± 1.2 and 34.6 ± 8.5 h, respectively. (B) Normalised fluorescence signal over time of 450
M S 71-82, 450 M S 71-82 S 71-82 S 71-82 peptides (both at 225
M giving a final peptide concentration of 450 M). Colours denote the same peptides as
described in (A). Note: t S 71-82 S 71-82 mix is the same data as presented in (A). The
lag times for Syn71-82 and Syn71-82 are 13.3 ± 3.2 and 6.1 ± 1.0 h, respectively. (C) TEM images
taken at the end points (100 h) of the incubations (colour coded as above). All three
[image:48.595.71.527.69.403.2]Figure S9. ThT fluorescence assay of Syn71-82 and Syn71-82 synthetic peptides in ESI-MS
buffer conditions. N M S 71-82 (blue), 225
M S 71-82 (orange) S 71-82 S 71-82 peptides with a total peptide
concentration of 225 M (both at 112 M, green). T S 71-82 S 71-82 and
S 71-82 S 71-82 mixed incubation are 4.2 ± 0.6, 2.5 ± 1.1 and 7.8 ± 2.0 h, respectively.
ThT experiments presented here were carried out in 100 mM ammonium acetate, pH 6.8 (in
[image:49.595.112.488.71.359.2]Supplementary Tables
Protein Expected mass Da Observed mass Da Mass difference
(Da)
pL GS 10 100 9 967 ± 3 -133
pL Syn71-82 10 390 10 257 ± 4 -132
pL Syn71-82 10 423 10 290 ± 4 -133
Supplementary Table 1. Observed and expected masses from ESI-MS data. The observed
mass is 133 Da below the expected mass as the N-terminal Met residue is excised, due to the
activity of the E. coli enzyme methionyl-aminopeptidase which has increased activity with
decreasing residue size in the penultimate N-terminal position (alanine in this case)(1). Errors
are quoted to the nearest Dalton.