STUDY ON COMPARISON OF THREE
METHODS OF GRADUAL WEANING FROM
MECHANICAL VENTILATORS
Dissertation submitted for
MD DEGREE EXAMINATION
BRANCH VII – PEDIATRIC MEDICINE
INSTITUTE OF CHILD HEALTH AND HOSPITAL FOR
CHILDREN
MADRAS MEDICAL COLLEGE
THE TAMILNADU DR. M.G.R. MEDICAL UNIVERSITY
CHENNAI
CERTIFICATE
This is to certify that the dissertation titled
“STUDY ON
COMPARISON OF THREE METHODS OF GRADUAL
WEANING FROM MECHANICAL VENTILATORS”
submitted by Dr.
P. BHARATHI to the faculty of pediatrics, the Tamilnadu Dr. M.G.R.
Medical university, Chennai in partial fulfillment of the requirement for the
award of M.D. Degree (pediatrics) is a bonafide research work carried out
by her under our direct supervision and guidance.
Dr.J.MOHANASUN DARAM Dr. P. RAMACHANDRAN
M.D.,Phd.,DNB, M.D., DNB
Dean, Director & superintendent,
Madras medical college, Institute of child health &
Chennai - 3 Hospital for children,
Egmore, Chennai - 8
Prof. Dr. P.S. MURALIDHARAN Prof. Dr. P. JAYACHANDRAN
M.D.,DCH M.D.,DCH
DECLARATION
I. DR.P.BHARATHI
solemnly declare that the dissertation titled
“STUDY ON COMPARISON OF THREE METHODS OF GRADUAL
WEANING FROM MECHANICAL VENTILATORS”
has been
prepared by me. This is submitted to
The Tamilnadu Dr.M.G.R. Medical
University,
Chennai in partial fulfillment of the rules and regulations for the
M.D. Degree Examination in Pediatrics.
SPECIAL ACKNOWLEDGEMENT
My sincere thanks to prof. Dr. Mohana sundaram M.D.,DNB.,Phd
the Dean, Madras medical college, for allowing me to do this
ACKNOWLEDGEMENTS
I would like to express my sincere gratitude to Prof. Dr. P.
Ramachandran, M.D., DNB , director and superintendent of
Institute of child health and hospital for children for permitting me
to undertake this study and for his guidance, invaluable help,
encouragement and support throughout the study.
I am extremely thankful to Prof. Dr. P.S. Muralidharan
M.D., DCH , my unit chief for his guidance , invaluable and timely
help , encouragement and support throughout the study.
I would like to thank Prof. Dr. P. Jayachandran M.D.,DCH ,
Chief, Pediatric intensive care unit, Dr. S. Shanthi, M.D., DCH.,
Dr. V. Poovazhagi, M.D., Dr. Ezhilarasu, M.D., Dr. Sivaraman
M.D., Asst. Professors , PICU for their meticulous guidance and
support throughout the study. Special thanks to Dr. S. Thangavelu,
M.D., DCH.,MRCP., Former reader , PICU who motivated me to
for his valuable suggestions, invaluable help and guidance in doing
this work.
I would like to thank our unit Assistant Professors,Dr. B.
Sathyamoorthy, M.D., Dr. Parivathini, M.D., Dr. Velmurugan,
M.D., Dr. Prabakaran M.D., for their valuable guidance and
support throughout the study.
I am greatly indebted to Dr. K. Nedunchezhian, M.D.,
DCH., for his support and guidance in doing this study.
I sincerely thank all the children and their parents who have
CONTENTS
1. INTRODUCTION 1
2. REVIEW OF LITERATURE 21
3. STUDY JUSTIFICATION 26
4. AIM OF THE STUDY 28
5. MATERIALS AND METHOD 29
6. PROFORMA 35
7. RESULTS 38
8. DISCUSSION 66
9. SUMMARY AND CONCLUSION 72
10. ANNEXURE 73
Mechanical ventilation (MV) is a life-supporting modality that is used
in a significant proportion of patients in intensive care units , the term
mechanical ventilation refers to various artificial means used to support
ventilation and oxygenation1, 2
Mechanical ventilation is commonly delivered in intensive care by
positive pressure ventilation. Positive pressure ventilation modes are defined
by inspiratory events. Expiration is treated as an independent entity. The
primary expiratory parameter, positive end expiratory pressure (PEEP) can
be applied to any of the ventilator modes.
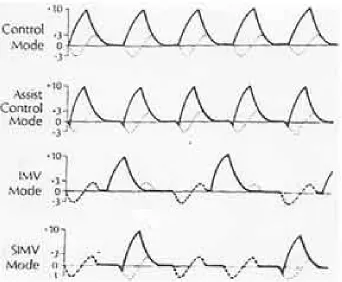
VENTILATOR MODES 3, 4
The various modes of ventilation are classified based on the types of
breaths that are selected. The modes most commonly used in pediatric
practice are discussed here.
Volume targeted modes :
1. Controlled Mechanical Ventilation (CMV): In this mode, the ventilator
2. Assisted Mechanical Ventilation (AMV): All breaths are triggered when
the patient’s inspiratory effort exceeds the preset sensitivity threshold of
negative pressure. In all other respects, it is similar to controlled mechanical
ventilation.
3. Assist Control Ventilation (ACV): ACV is a combination of AMV and
CMV. In this mode, the patient initiates the breathing as in AMV. However,
if the patients fails to initiate the breathing within a prescribed time the
ventilator triggers the breathing and provides a controlled breath as in CMV,
thus ensuring a guaranteed minute ventilation.
4. Intermittent Mandatory Ventilation (IMV): It is essentially a combination
of spontaneous breathing and CMV. A modified circuit provides a
continuous gas flow that allows the patient to breathe spontaneously with
minimal work of breathing, At a predetermined frequency, the ventilator
provides a positive pressure breath to the patient.
5. Synchronized Intermittent Mandatory Ventilation (SIMV): SIMV allows
the patient to trigger a mandatory breath in the assist mode thereby
synchronizing it with the patient’s respiratory effort. However, if the patient
does not trigger a breath within an allotted time; the ventilator delivers a
Fig. 1. Airway pressure tracings of the four commonly used volume targeted modes. Thick solid lines represent ventilator breaths; thick dotted lines represent spontaneous breaths; and thin dotted lines represent spontaneous pattern if there are no ventilator breaths.
Pressure targeted modes :
1. Pressure Support Ventilation (PSV):In this mode, the patient triggers the
breath as in assisted ventilation. Once initiated the ventilator delivers air and
determine their own inspiratory time and tidal volume. It is mainly used as a
weaning mode and may be tolerated better than SIMV by some patients.
2. Pressure Control and Pressure Assist Control Ventilation (PCV and
PACV):
This is a time-initiated, pressure-limited and time-cycled mode intended for
patients requiring total mechanical ventilatory support. Most ventilators also
allow patient triggering of these breaths; producing pressure assisted breaths.
Continuous Positive Airway Pressure :
CPAP is best described as PEEP during spontaneous respiration. It is started
at 5 cm water and increased by increments of 3 cm water while monitoring
blood gases. If PaO2 remains <50 mm Hg despite CPAP of 10-12 cm water
with FiO2 of 1 assisted ventilation is warranted.
INDICATIONS 5, 6, 7
Common indications for mechanical ventilation include the following:
1. Bradypnea or apnea with respiratory arrest
2. Acute lung injury and the acute respiratory distress syndrome
4. Arterial partial pressure of oxygen (PaO2) with a supplemental fraction
of inspired oxygen (FIO2) of less than 55 mm Hg
5. Alveolar-arterial gradient of oxygen tension (A-a DO2) with 100%
oxygenation of greater than 450 mm Hg
6. Clinical deterioration
7. Respiratory muscle fatigue
8. Obtundation or coma
9. Hypotension
10. Acute partial pressure of carbon dioxide (PaCO2) greater than 50 mm
Hg with an arterial pH less than 7.25
11. Neuromuscular disease
COMPLICATIONS5, 8
Common complications of mechanical ventilation are
1. Complications that are associated with intubation:
Nasal trauma, tooth avulsion, oral-pharyngeal laceration, laceration or
intubation of the esophagus, Sinusitis, tracheal necrosis or stenosis,
glottic edema etc.,
2. Ventilator induced complications:
Barotrauma
Volutrauma
Oxygen toxicity
Ventilator-associated pneumonia
Intrinsic PEEP, or auto-PEEP
Cardiovascular effects - decrease preload, stroke volume, and cardiac
output.
WEANING FROM VENTILATOR
Once a patient recovers from the illness leading to the application
of mechanical ventilation, discontinuation of ventilator support and
extubation must be attempted. The discontinuation process consists of two
components: weaning (assessing the need for ventilatory support) and
extubation (assessing the need for an airway). Investigators have
increasingly focused on the latter component, where 5–20% of extubations
may fail and require reintubation. In case of unplanned extubation need for
Both unnecessarily delayed extubation and 'premature' extubation
are associated with adverse outcomes. Delayed extubation is associated with
increased length of stay, increased risk for ventilator-associated pneumonia,
and increased mortality in brain-injured patients. Conversely, reintubation
(extubation failure)10,11 after planned extubation is associated with adverse
outcomes, including increased hospital mortality, prolonged hospital stay,
higher costs, and greater need for tracheotomy and transfer to post acute
care. Although the adverse effects of reintubation could reflect the severity
of underlying illness or could result from complications during reintubation,
this has not been demonstrated with multivariate analysis. Rather, delayed
reinstitution11 of ventilatory support may allow for deterioration and new
organ failure, ultimately contributing to increased mortality and increased
costs.
WEANING12:
It is the process of withdrawing mechanical ventilatory support and
transferring the work of breathing from the ventilator to the patient. It may
be done abruptly or gradually.
Patients who were ventilated for relatively short time (usually no more
for most other patients successful weaning requires more gradual withdrawal
of ventilatory support.
WEANING PROCEDURES12:
Commonly used are T – tube weaning, synchronized intermittent
mandatory ventilation (SIMV), continuous positive airway pressure /
pressure support (CPAP/PSV) ventilation.
WEANING SUCCESS12:
Defined as effective spontaneous breathing without any mechanical
assistance for 48 hours or more
WEANING FAILURE12:
Weaning failure is defined as one of the following:1) reintubation
and/or resumption of ventilatory support following successful extubation
with in 48 hrs or
2) death within48 h following extubation.
Weaning from mechanical ventilators depends on the strength of
respiratory muscles, the load applied to those muscles, and the respiratory
drive to breathe. Respiratory failure may occur because of any of these. The
etiology of unsuccessful weaning is the imbalance between the respiratory
muscle pump and the respiratory muscle load 13,14. This could happen
patient on mechanical ventilator, a rise of a new problem, a
ventilator-associated complication, or a combination of these factors.
The key elements to optimize weaning 15,16 are: (i) to determine cause
of ventilator dependency,(ii) rectify correctible problems like pulmonary gas
exchange, fluid balance, mental status, acid-base status, electrolyte
disturbance, (iii) to consider psychological factors, and (iv) to optimize
posture and provide ambulation. It is imperative to correct these elements for
a successful weaning.
An extubation failure17 may occur secondary to upper airway
obstruction or respiratory secretions that could not be managed by the
patient. These factors do not manifest themselves until the removal of the
translaryngeal tube. Significant trauma to the airway from translaryngeal
intubation is more common in females and increases with increasing
duration of intubation17. Another potential reason for extubation failure is
the loss of positive pressure in the thorax after extubation in pressure support
ventilation (PSV)- weaned patients.
A team approach and an organized problem-orientated plan are
important to expect successful discontinuation of mechanical ventilation. Ely
Those investigators found that removal from mechanical ventilation
was 2 days earlier in the protocol-directed group18. The use of the protocol to
manage just four patients (95% confidence interval 3-5) would result in one
individual being off mechanical ventilation after 48 h who otherwise would
not have been.
Recognising and treating the process that caused the patient to go on
the ventilator is the first goal in liberating him from MV. Weaning
procedures are usually started only after the underlying disease process that
necessitated mechanical ventilation has significantly improved or is
resolved. The patient should also have an adequate gas exchange (most
studies define this condition as an arterial oxygen tension/fractional inspired
oxygen ratio higher than 200), appropriate neurological and muscular status,
and stable cardiovascular function.
Weaning indices are objective criteria that are used to predict the
readiness of patients to maintain spontaneous ventilation. Some parameters
based on respiratory mechanics, gas exchange, and breathing pattern have
been proposed as useful predictors of weaning outcome that could guide
clinicians in determining the optimal time to discontinue mechanical
Guidelines for weaning
These guidelines, published in 200123 , were developed by a collective task
force comprising physicians, nurses, and respiratory therapists.
1. Search for all causes for the patient being ventilator-dependent and correct
or reverse them.
2. Perform a formal assessment about readiness to wean if the patient meets
the criteria listed below. Some patients may still be considered for weaning
even if one of the following criteria is not met:
• The cause of the respiratory failure has been partially or fully reversed.
• The patient’s Pao2/FIO2 > 200, positive end-expiratory pressure is
between 0 and 8 cm H2O, his FIO2 is less than 0.5, and pH is 7.25 or
greater.
• The patient’s hemodynamic status is stable, with no ischemia and no
clinically important hypotension.
• The patient can initiate an inspiratory effort.
3. Perform a formal assessment of readiness to wean. If the patient can
tolerate a 30- to 120-minute spontaneous breathing trial, he’s ready.
distress and respiratory rate less than 30 breaths/minute), adequate gas
exchange, hemodynamic stability, and subjective comfort level.
4. Once the patient is discontinued from mechanical ventilation, assess
airwaypatency and his ability to clear secretions. If the airway isn’t patent,
or if he can’t clear secretions, leave the artificial airway in place.
5. If he failed the spontaneous breathing trial, determine and correct the
cause. Then evaluate him based on guideline 2. If criteria are met, perform a
spontaneous breathing trial every 24 hours.
6. Between breathing trials, use a ventilator mode that provides support that
is stable, nonfatiguing, and comfortable. Let the patient rest to avoid
overloading the ventilatory muscles.
7. Use proper analgesics and sedatives at the lowest possible dose, to avoid
blunting the respiratory drive.
8. Employ properly designed weaning protocols performed by a therapist
team.
9. If the patient will clearly need prolonged mechanical ventilation, he
should have a tracheostomy. Early in the course of treatment is better than
10. A patient should be classified as permanently ventilator-dependent only
after 3 months of failed weaning attempts, unless he clearly has irreversible
disease or injury, such as amyotrophic lateral sclerosis or spinal cord injury.
11. If weaning attempts in the ICU have failed, transfer a medically stable
patient to a specialized facility that has a good safety and success record in
accomplishing ventilator discontinuation.
12. When a patient has been on prolonged mechanical ventilation, go slowly
in weaning and gradually increase the time used for spontaneous breathing
trials. Respiratory muscles need to be retrained and strengthened for patients
who’ve been ventilator-dependent for prolonged periods.
Once a patient has been considered ready to be weaned, the best
method to assess whether the patient is able to breathe on his or her own is
to perform a trial of spontaneous ventilation. Ely et al18 showed that
immediate extubation after successful trials of spontaneous breathing
expedites weaning and reduces the duration of mechanical ventilation as
compared with a more gradual discontinuation of ventilatory support.
Several studies24-30 have demonstrated that 60-80% of mechanically
ventilated patients can be successfully extubated after passing a trial of
Pressure-support, continuous positive airway pressure and T-piece
trials are the most common methods used to test the readiness for liberation
from mechanical ventilation. Few random studies26,31 have studied the best
technique for performing spontaneous breathing trials before extubation. The
first study31 that dealt with this issue compared continuous positive airway
pressure of 5 cmH2O and T-piece in a group of 106 mechanically ventilated
patients who underwent a 1h trial of spontaneous breathing, and no
difference in the percentage of patients failing extubation was found.
Because the endotracheal tube imposes a resistive load on the respiratory
muscles that is inversely related to its cross-sectional diameter, some
clinicians advocate use of 5-8 cmH2O pressure support to offset this imposed
load. With this in mind, the study performed by the Spanish Lung Failure
Collaborative Group26 compared weaning outcome after trials of
spontaneous breathing with either T-tube or pressure support of 7 cmH2O,
but no difference was observed in the percentage of patients who remained
extubated for 48 h (63% in the group assigned to T-tube and 70% in the
group assigned to pressure support; P = 0.14).
The duration of a spontaneous breathing trial has been set at 2 h in
most Studies26-29. One prospective, multicenter, randomized trial30 of 526
equivalent in identifying patients who could tolerate extubation, and that
patients had reintubation rates of approximately 13% at 48 h regardless of
the duration of their T-tube trial.
Precise criteria for terminating a weaning trial do not exist, and
currently trials are terminated on the basis of the clinical judgement of the
physician. There are two types of criteria used to determine whether a
patient passes or fails a spontaneous breathing trial: objective criteria32,33
(abnormal arterial blood gas measurements) and subjective criteria
(diaphoresis, evidence of increasing effort, tachycardia, agitation, anxiety).
Patients have clearly failed a spontaneous breathing trial if they develop
hypercapnia or hypoxaemia. The evaluation of clinical tolerance to
spontaneous breathing by using exclusively subjective criteria has important
drawbacks; on the one hand, strict criteria might increase the occurrence of
unnecessarily prolonged mechanical ventilation but, on the other hand,
Commonly recommended criteria for stopping spontaneous breathing
Inability to maintain gas exchange - SPO2 < 95% with FiO2 of 0.4 Inability to maintain effective ventilation
- PCO2 of > 50 mm/Hg or increase of > 10mm/Hg from previous
value - pH < 7.3
Increased work of breathing
- Respiratory rate in acceptable range < 6 months 20 – 60 / min
6m to 2 yrs 15 – 45 / min 2 to 5 yrs 15 – 40 / min > 5 yrs 10 – 35 / min
- increased use of accessory muscles of respiration - paradoxical breathing
Signs of distress - diaphoresis - anxiety
- change in mental status(agitation/somnolence) - BP – hyper/ hypo tension
- Heart rate – Brady/ tachy cardia
There is little risk in performing a closely observed trial of
spontaneous breathing in patients in whom any acute respiratory failure has
resolved and who are awake and cardiovascularly stable, in order to assess
their ability to sustain spontaneous breathing34,35. When the patient remains
clinically stable with no signs of poor tolerance until the end of the trial, the
signs of poor tolerance, weaning is considered to have failed and mechanical
ventilation is reinstituted34-38 .
Weaning attempts that are unsuccessful usually indicate incomplete
resolution of the illness that precipitated the need for mechanical ventilation,
or the development of new problems. Failure to wean has been attributed to
an imbalance between the load faced by the respiratory muscles and their
neuromuscular competence. If a compensated balance of strength and load
cannot be restored, attempts at spontaneous breathing will be futile.
Therefore, once a patient fails a spontaneous breathing trial, the clinician
must comprehensively evaluate the patient, looking for ways to improve his
or her physiologic status.
Factors that can lead to weaning failure due to the imbalance between ventilatory needs and respiratory capacity 39-42
Factors that increase the load
1. Bronchospasm
2. Pleural effusion
3. Hyperinflation (intrinsic positive end-expiratory pressure)
5. Pneumothorax
6. Alveolar edema
7. Upper airway obstruction
8. Flail chest
9. Infection
10. Obstructive sleep apnea
11. Obesity
12. Atelectasis
13. Endotracheal tube kinking
14. Ascites
15. Interstitial inflammation and/or oedema
16. Secretions encrustation
17. Abdominal distension
18. Ventilatory circuit resistance
Factors that result in decreased neuromuscular competence
1. Drug overdose
2. Electrolyte derangement
3. Critical illness polyneuropathy
4. Brain-stem lesion
6. Neuromuscular blockers
7. Sleep deprivation
8. Myopathy
9. Aminoglycosides
10. Hypothyroidism
11. Hyperinflation
12. Guillain-Barré syndrome
13. Starvation/malnutrition
14. Drugs, corticosteroids
15. Mysthenia gravis
16. Metabolic alkalosis
17. Sepsis
18. Phrenic nerve injury
19. Myotonic dystrophy
REVIEW OF LITERATURE
Esteban et al24 did a comparison of four methods of weaning patients
from mechanical ventilation. They carried out a prospective, randomized,
multicenter study involving 546 patients who had received mechanical
ventilation for a mean (+/- SD) of 7.5 +/- 6.1 days and who were considered
by their physicians to be ready for weaning. One hundred thirty patients had
respiratory distress during a two-hour trial of spontaneous breathing. These
patients were randomly assigned to undergo one of four weaning techniques:
intermittent mandatory ventilation, in which the ventilator rate was initially
set at a mean (+/- SD) of 10.0 +/- 2.2 breaths per minute and then decreased,
if possible, at least twice a day, usually by 2 to 4 breaths per minute (29
patients); pressure-support ventilation, in which pressure support was
initially set at 18.0 +/- 6.1 cm of water and then reduced, if possible, by 2 to
4 cm of water at least twice a day (37 patients); intermittent trials of
spontaneous breathing, conducted two or more times a day if possible (33
patients); or a once-daily trail of spontaneous breathing (31 patients).
quartile, 3 days; third quartile, 11 days), 4 days for pressure-support
ventilation (2 and 12 days, respectively), 3 days for intermittent (multiple)
trials of spontaneous breathing (2 and 6 days, respectively), and 3 days for a
once-daily trial of spontaneous breathing (1 and 6 days, respectively). After
adjustment for other covariates, the rate of successful weaning was higher
with a once-daily trial of spontaneous breathing than with intermittent
mandatory ventilation (rate ratio, 2.83; 95 percent confidence interval, 1.36
to 5.89; P < 0.006) or pressure-support ventilation (rate ratio, 2.05; 95
percent confidence interval, 1.04 to 4.04; P < 0.04). There was no significant
difference in the rate of success between once-daily trials and multiple trials
of spontaneous breathing. A once-daily trial of spontaneous breathing led to
extubation about three times more quickly than intermittent mandatory
ventilation and about twice as quickly as pressure-support ventilation.
Multiple daily trials of spontaneous breathing were equally successful 7.
Brochard et al 25. did a Comparison of three methods of gradual
withdrawal from ventilatory support during weaning from mechanical
ventilation Among 456 mechanically ventilated patients who met weaning
with PSV). The three groups were comparable in terms ofetiology of disease
or characteristics at entry in the study. When all causes for weaning failure
were considered, a lower number of failures wasfound with PSV than with
the other two modes, with the difference just reaching the level of
significance (23% for PSV, 43% for T piece, 42% for SIMV; p = 0.05).
After excluding patients whose weaning was terminated for complications
unrelated to the weaning process, the difference became highly significant
(8% for PSV versus 33% and 39%, p < 0.025) 8
Esteban et al 26. also compared the extubation outcome after
spontaneous breathing trials with T- tube or pressure support ventilation.
Patients were randomly assigned to undergo a 2-h trial of spontaneous
breathing in one of two ways: with a T-tube system or with pressure support
ventilation of 7 cm H2O. If a patient had signs of poor tolerance at any time
during the trial, mechanical ventilation was reinstituted. Patients without
these features at the end of the trial were extubated. Of the 246 patients
assigned to the T-tube group, 192 successfully completed the trial and were
required reintubation. The percentage of patients who remained extubated
after 48 h was not different between the two groups (63% T-tube, 70%
pressure support ventilation, p= 0.14). The percentage of patients failing the
trial was significantly higher when the T-tube was used (22 versus 14%, p =
0.03). Clinical evolution during the trial was not different in patients
reintubated and successfully extubated. ICU mortality among reintubated
patients was significantly higher than in successfully extubated patients (27
versus 2.6%, p 0.001). Spontaneous breathing trials with pressure support or
T-tube are suitable methods for successful discontinuation of ventilator
support in patients without problems to resume spontaneous breathing.
Jones et al43. compared the effects of extubation after 1 h of either
CPAP 5 & T – piece . 106 patients were randomized to 1 h CPAP or 1 h T –
piece . no significant difference existed between groups in age , sex , HR ,
BP , FIO2 , PaCO2 , or PaO2. However P(A – a )O2 was significantly
higher in CPAP group at the end of 120 min. 19 T – piece patients showed
improved P(A – a) O2 at 120 min compared with only 10 patients in CPAP
group. 3 CPAP and 2 T – piece patients subsequently required reintubation.
This study demonstrates that use of a T – piece does not impair arterial
STUDY JUSTIFICATION
Once a patient recovers from the illness leading to the application of
mechanical ventilation, discontinuation of ventilatorsupport and extubation
must be attempted. Failure of extubation is associated with high mortality
rate, either by selecting for high-risk patients or by inducing deleterious
effects such as aspiration, atelectasis and pneumonia.
There are various standard protocols to classify which child is to be
weaned and which not. But once the decision to wean from mechanical
ventilator is made there is no universally accepted protocol as to which
method of weaning is best. There is uncertainty about the best methods for
conducting thisprocess.
Current practice in our PICU as far as weaning is concerned is
physician directed weaning. Physician directed weaning is an accepted mode
of weaning where the intensive care specialist who by his experience decides
as which patient is ready for weaning and which method of weaning is to be
followed. Since all the methods of weaning are standard methods, patients
are randomly weaned using any one method as wished by the physician.
need for reintubation respectively in them, both of which are associated with
increased rate of mortality & morbidity.To avoid such complications there
need to be a single standard effective method which could be applied at any
time the patient becomes fit for weaning.
All 3 methods of weaning are accepted universally. But recent
researches (most of them conducted in adults) actually show that one method
is better over the other. Some studies show t- piece trial24 to be better some
saying CPAP/PS is better, as far as weaning success25 is considered. Even if
all methods are equally effective the actual duration of weaning differ from
one method to another. For this purpose a comparative study of the various
methods of weaning from mechanical ventilators was undertaken at PICU,
ICH & HC where > 500 patients are intubated and ventilated per year to find
out a quick and effective method of weaning so that more patients would be
benefited from the minimal number of ventilators available. The study was
AIM OF THE STUDY
To assess the effectiveness of the 3 standard methods of weaning from
mechanical ventilators namely T – tube weaning, synchronized intermittent
mandatory ventilation (SIMV) , continuous positive airway pressure /
pressure support ( CPAP/PSV) ventilation in terms of successful weaning, to
assess the incidence of weaning failure and duration of weaning with each
and also the duration of hospital stay and outcome of these patients so that
the best of the weaning procedure can be followed for successful weaning in
MATERIALS AND METHODS
Study Design
Randomized trial.
Study Place
Pediatric intensive care unit
Institute of child health & hospital for children
Period of study
From June 2009 to November 2010.
Study population
Children between 1 month and 12 years of age.
Inclusion criteria
1. All children who were mechanically ventilated for a period of >
48 hours (irrespective of etiology) through an endotracheal tube
and who fulfill standard weaning criteria.
2. Those who are reintubated after 48 hours of extubation and
continue to receive mechanical ventilation for > 48 hours &
Exclusion criteria
- ventilation for less than 48 hours
- Ventilation with tracheostomy tube
- Spontaneously extubated.
- post operative patients.
Manoeuvre
First step in the process was to get informed consent for inclusion in
the study from the patient’s care givers. After getting informed consent,
children who satisfy the criteria for weaning ( as per ANNEXURE 1 ) are
allocated computer generated random numbers and were categorized into
group A/B/C accordingly.
WEANING SUCCESS 12 : Defined as effective spontaneous breathing
without any mechanical assistance for 48 hours or more
WEANING FAILURE 12: Defined as one of the following:
1) reintubation and/or resumption of ventilatorysupport following successful
extubation with in 48 hrs or
2) death within48 h following extubation.
TRIAL FAILURE : During a breathing trial if the child developed signs of
intolerance.
AFTER FULLFILLING WEANING CRITERIA, CHILDREN ARE RANDOMISED
↓
Success failure Success failure Success failure
Extubation back to reduce 2 breaths failure in Prior settings for each any step Trial after successful trial(2 trial/day) go back 24 hours to prior Till rate is settings.
≤ 50% of initial rate trial after 24 hours.
Extubate Reduce PS by 2 cms/ H2O for back to prior
each Successful trial (2 trial/day) settings. Trial . Till 6 cms/ H2O after 24 hours
Extubation
WEANING 24-26
GROUP A T- PIECE TRIAL 2 hours of breathing
trial
GROUP B CPAP/PSV 2 hours of breathing
trial with PEEP=5
PSV=10cms/ H2O
GROUP C SIMV- V/P 2 hours of breathing trial with RR of 50%
T – piece trial :
After fulfilling weaning criteria the child is connected to a T – piece
and a breathing trial for 2 hrs is conducted. If no signs of intolerance child is
extubated.
CPAP/PSV :
After fulfilling weaning criteria the child is connected to CPAP/PSV
mode with PEEP of 5 & Pressure support of 10. After completion of a 2 hrs
of breathing trial PS is reduced by 2 till it comes to 6, then extubation is
done. Only 2 successful trials per day one after the other. If there is trial
failure next trial is done after 24 hrs.
SIMV :
After fulfilling weaning criteria the child is connected to SIMV mode
with a rate that is 50% of the previous rate. After completion of a 2 hrs of
breathing trial rate is reduced by 2 till it comes to 50% of the rate at which
the trial was started, then extubation is done. Only 2 successful trials per day
AT ANY POINT DURING TRIAL OF BREATHING IF CHILD FULFILS ANY
OF THE CRITERIA (ANNEXURE 2) FOR STOPPING SBT (spontaneous
breathing trial) TRIAL IS TERIMINATED ABRUPTLY.
END POINT FOR SIMV TRIAL: till ventilator rate of ≤ 50% of initial rate.
END POINT FOR CPAP/PSV TRIAL: till pressure support of 6 cms/ H2O.
Sample size
Calculated sample size is 30 in each group with a total of 90. 9 additional
samples for loss during study period. Total sample size is 99 of which 96
was achieved and 88 completed the study.
Statistical analysis
Chi – square test was used to compare categorical responses between
children weaned using T – piece, CPAP – PSV and SIMV methods. One
way ANOVA test and Post hoc test were used to compare the mean
PROFORMA
NAME
AGE/SEX
IP.NO
RANDOM NUMBER
GROUP
DIAGNOSIS
COMORBIDITY
Hb%
DATE/TIME OF INTUBATION
INDICATION FOR INTUBATION
TUBE SIZE
REINTUBATIONS YES Number Indication
1. 2. 3.
RAPID SEQUENCE INTUBATION
YES NUMBER
NO
SHOCK YES DURATION
NO
INOTROPES YES DURATION
NO
MANUAL VENTILATION
YES
STARTED ON: @
ENDED ON: @
NO
MODE OF MECHANICAL VENTILATION
PRIOR TO WEANING
ASSISTED VOLUME CONTROL ASSISTED PRESSURE CONTROL FiO2 Tidal volume Rate/ min
FiO2 PIP PEEP Rate/ min
DURATION OF MECHANICAL VENTILATION
PRIOR TO WEANING
STARTED ON: @
ENDED ON: @
NOSOCOMIAL PNEUMONIA
YES
WEANING PROCEDURE
NO OF SBT
DURATION OF WEANING
WEANING FAILURE ( < 48 hours )
YES REINTUBATION
DEATH
NO INDICATION FOR
REINTUBATION Airway cause:
Non airway cause:
DURATION OF PICU STAY
DURATION OF HOSPITAL STAY
OUTCOME 1.death
2.complete recovery from underlying acute illness with out complications
3. complete recovery from underlying acute illness following complications
Complication-
RESULTS
Out of the 96 children included in the study 88 children successfully
completed the study. 8 children were excluded from the weaning trial due to
spontaneous extubation during the course of the trial. All 31 children from
group A completed the trial successfully. 31 out of 33 children from group B
completed the trial. 26 out of 32 children from group C successfully
[image:46.612.93.507.405.689.2]completed the trial.
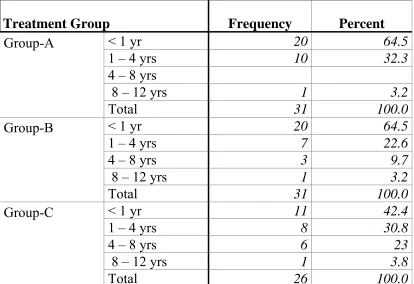
TABLE 1
AGE DISTRIBUTION OF CHILDREN IN EACH GROUP Treatment Group Frequency Percent
Group-A
< 1 yr 20 64.5
1 – 4 yrs 10 32.3
4 – 8 yrs
8 – 12 yrs 1 3.2
Total 31 100.0
Group-B
< 1 yr 20 64.5
1 – 4 yrs 7 22.6
4 – 8 yrs 3 9.7
8 – 12 yrs 1 3.2
Total 31 100.0
Group-C
< 1 yr 11 42.4
1 – 4 yrs 8 30.8
4 – 8 yrs 6 23
8 – 12 yrs 1 3.8
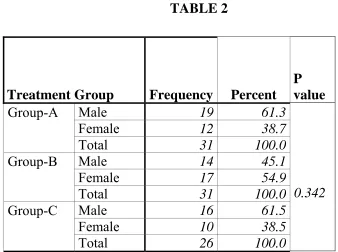
SEX DISTRIBUTION OF CHILDREN IN EACH GROUP
61.3 % of children in group A , 45.1 % in group B and 61.5 % in group C
were boys and the rest were girls in each group. Both sexes were equally
[image:47.612.125.463.201.453.2]distributed. TABLE 2 19 16 19 12 17 13 0 5 10 15 20 25 30 Numb er Gender distribution Group-A Group-B Group-C
Treatment Group Frequency Percent P value
Group-A
Male 19 61.3
0.342
Female 12 38.7
Total 31 100.0
Group-B
Male 14 45.1
Female 17 54.9
Total 31 100.0
Group-C
Male 16 61.5
Female 10 38.5
RSI
16.1 % of children in group A , 6.1 % of children in group B and 15.6
% of children in group C were intubated using Rapid Sequence Intubation.
COMPARISONS OF VARIOUS DIAGNOSIS AMONG GROUPS
16
12 13
1
0 1
9 15
14
3 3
1 2
3 3
0 5 10 15 20 25 30
Nu
m
b
e
r
Respiratory Cardiac Neurological Sepsis Others Diagnosis
Distribution of diagnosis
Group-A
Group-B
Group-C
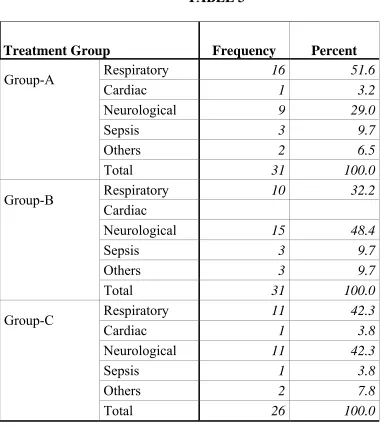
TABLE 3
Treatment Group Frequency Percent
Group-A
Respiratory 16 51.6
Cardiac 1 3.2
Neurological 9 29.0
Sepsis 3 9.7
Others 2 6.5
Total 31 100.0
Group-B
Respiratory 10 32.2
Cardiac
Neurological 15 48.4
Sepsis 3 9.7
Others 3 9.7
Total 31 100.0
Group-C
Respiratory 11 42.3
Cardiac 1 3.8
Neurological 11 42.3
Sepsis 1 3.8
Others 2 7.8
Total 26 100.0
Neurological illnesses were the major cause of hospitalization among
children of 2 groups. 48.4 % in group B , 42.3 % in group C had
neurological diseases. But in group A 51.6 % had respiratory diseases. The
distribution of diseases was equal among all the 3 groups.
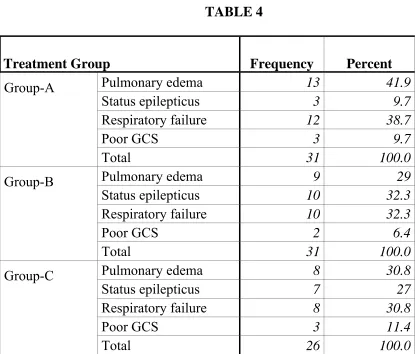
INDICATION FOR INTUBATION TABLE 4
Treatment Group Frequency Percent
Group-A
Pulmonary edema 13 41.9
Status epilepticus 3 9.7
Respiratory failure 12 38.7
Poor GCS 3 9.7
Total 31 100.0
Group-B
Pulmonary edema 9 29
Status epilepticus 10 32.3
Respiratory failure 10 32.3
Poor GCS 2 6.4
Total 31 100.0
Group-C
Pulmonary edema 8 30.8
Status epilepticus 7 27
Respiratory failure 8 30.8
Poor GCS 3 11.4
Total 26 100.0
Pulmonary edema and respiratory failure were the major indications
for intubation among children of all groups. In group A 41.9 % and 38.7 % ,
in group B 29 % and 32.3 % , in group C 30.8 % had pulmonary edema and
respiratory failure respectively. 9.7 % , 32.3 % and 27 % in groups A,B and
C were intubated for status epilepticus. Poor GCS was the other indication
13
10 10
3
10 9
12 11
10
0 5 10 15 20 25 30
Nu
mb
e
r
Pulmonary edema Status epilepticus Respiratory failure
Indication
Indication for intubation
Group-A
Group-B
Group-C
Pulmonary edema P – Value:0.514 Status epilepticus P – Value:0.088 Respiratory failure P – Value:0.791 Poor GCS P – Value:0.793
There was no statistically significant difference in the distribution of the
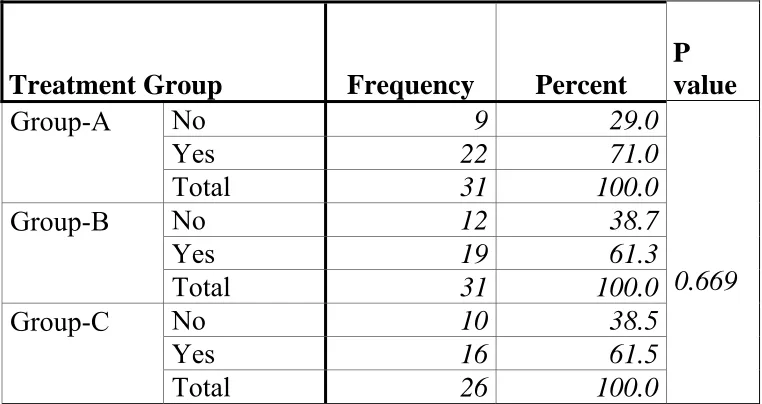
TABLE 5 - SHOCK
Treatment Group Frequency Percent P value
Group-A
No 9 29.0
0.669
Yes 22 71.0
Total 31 100.0
Group-B
No 12 38.7
Yes 19 61.3
Total 31 100.0
Group-C
No 10 38.5
Yes 16 61.5
Total 26 100.0
TABLE 6 - DURATION OF SHOCK Treatment Group Frequency Percent
Group-A
< 24hrs 13 59.1
24 - 48hrs 6 27.3
> 48hrs 3 13.6
Total 22 100.0
Group-B
< 24hrs 9 47.4
24 - 48hrs 7 36.8
> 48hrs 3 15.8
Total 19 100.0
Group-C
< 24hrs 8 50
24 - 48hrs 6 37.5
> 48hrs 2 12.5
Total 16 100.0
71 % in group A , 61.3 % in group B and 61.5 % in group C had
shock during sometimes of their illness. In majority of them shock persisted
for < 24 hrs. only 13.6 % , 15.8 % & 12.5 % in group A , B & C had shock
INOTROPES – TABLE 7 Treatment Group Frequency Percent
Group-A
No 12 38.7
Yes 19 61.3
Total 31 100.0
Group-B
No 16 51.6
Yes 15 48.4
Total 31 100.0
Group-C
No 12 46.1
Yes 14 53.9
Total 32 100.0
DURATION OF INOTROPES – TABLE 8 Treatment Group Frequency Valid Percent
Group-A
< 24hrs 10 52.6
24 - 48hrs 6 31.6
> 48hrs 3 15.8
Total 19 100.0
Group-B
< 24hrs 5 33.3
24 - 48hrs 7 46.7
> 48hrs 3 20
Total 15 100.0
Group-C
< 24hrs 6 42.8
24 - 48hrs 6 42.8
> 48hrs 2 14.4
Total 14 100.0
More than 50 % of children received inotropic support for shock
management. Only in group B (46.7 %) inotropes were used for 24 – 48 hrs
VENTILATION BEFORE WEANING
26 out of 31 children (84 %) in group A , 29 out of 31 children (93.5
%) in group B and 24 of 26 children (92.3 %) in group C received manual
ventilation prior to mechanical ventilation which was equally distributed
among groups.
29 out of 31 (93.5 %) in group A , 28 out of 31 (90.3 %) in group B
and 21out of 26 (80.8 %) in group C received pressure control ventilation
before weaning. 8 2 8 11 16 13 6 12 5 6 3 6 0 5 10 15 20 25 30 Nu m b e r
48 to <72 hrs 3 to <5 days 5 to < 10 days >= 10 days Duration
Duration of ventilation before weaning
Group-A
Group-B
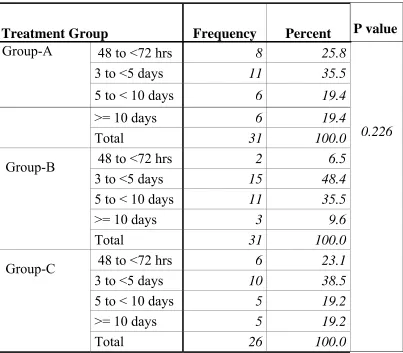
TABLE 9
DURATION OF VENTILATION PRIOR TO WEANING Treatment Group Frequency Percent P value
Group-A
48 to <72 hrs 8 25.8
0.226
3 to <5 days 11 35.5
5 to < 10 days 6 19.4
>= 10 days 6 19.4
Total 31 100.0
Group-B
48 to <72 hrs 2 6.5
3 to <5 days 15 48.4
5 to < 10 days 11 35.5
>= 10 days 3 9.6
Total 31 100.0
Group-C
48 to <72 hrs 6 23.1
3 to <5 days 10 38.5
5 to < 10 days 5 19.2
>= 10 days 5 19.2
Total 26 100.0
The duration of ventilation prior to weaning was equally distributed
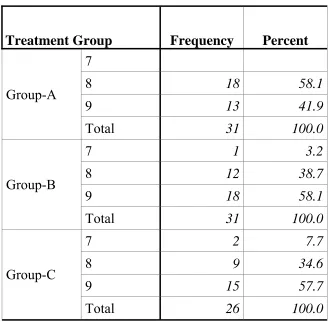
WEANING CRITERIA
TABLE 10 - NUMBER OF CRITERIA FULFILLED
Treatment Group Frequency Percent
Group-A
7
8 18 58.1
9 13 41.9
Total 31 100.0
Group-B
7 1 3.2
8 12 38.7
9 18 58.1
Total 31 100.0
Group-C
7 2 7.7
8 9 34.6
9 15 57.7
Total 26 100.0
All 9 criteria were fulfilled by 41.9 % , 61.5 % & 57.7 % of children in
groups A , B & C respectively.
8 criteria were fulfilled by 58.1 % , 35.5 % & 34.6 % of children in groups A
, B & C respectively.
7 criteria were fulfilled by 3.2 % & 7.7 % of children in groups B & C
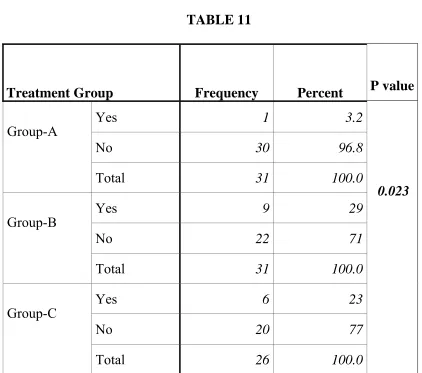
NOSOCOMIAL PNEUMONIA TABLE 11
Treatment Group Frequency Percent P value
Group-A
Yes 1 3.2
0.023
No 30 96.8
Total 31 100.0
Group-B
Yes 9 29
No 22 71
Total 31 100.0
Group-C
Yes 6 23
No 20 77
Total 26 100.0
The incidence of nosocomial pneumonia was significantly lower in
group A ( 1 out of 31 = 3.2 % ) than in group B ( 9 out of 31 = 29 % ) and
WEANING TRIALS NUMBER OF TRIALS
27 1 1 4 1 4 0 23 9 0 5 12 0 2 3 0 1 3 0 5 10 15 20 25 30 Nu m b e r
One Two Three Four Five Six
Number of trials
Number of trials
Group-A
Group-B
Group-C
27 out of 31 children in group A (87.1 %) required only 1 trial for
weaning. Whereas in group B 23 out of 31 (74.1 %) children required 3
trials. In group C 12 out of 26 (46.1 %) children needed 4 trials and 8 out of
26 (30.7 %) needed 3 trials thereby increasing the duration of weaning in
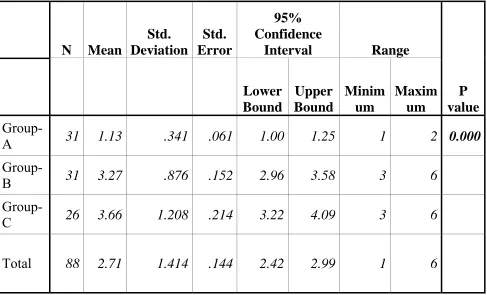
TABLE 12
Oneway ANOVA test for number of trials
N Mean
Std. Deviation
Std. Error
95% Confidence
Interval Range
P value
Lower Bound
Upper Bound
Minim um
Maxim um
Group-A 31 1.13 .341 .061 1.00 1.25 1 2 0.000
Group-B 31 3.27 .876 .152 2.96 3.58 3 6
Group-C 26 3.66 1.208 .214 3.22 4.09 3 6
Total 88 2.71 1.414 .144 2.42 2.99 1 6
Number of trials needed for weaning was least in group A with a mean of
1.13 where as in groups B & C it was 3.27 & 3.66 respectively. This was
TABLE 13
post Hoc test - Multiple Comparisons
(I) Treatment Group
(J) Treatment Group
Mean Difference
(I-J)
Std.
Error P value
95% Confidence Interval Lower
Bound
Upper Bound
Group-A
Group-A
Group-B -2.14(*) .222 .000 -2.68 -1.60
Group-C -2.53(*) .224 .000 -3.07 -1.98
Group-B
Group-A 2.14(*) .222 .000 1.60 2.68
Group-B
Group-C -.38 .220 .255 -.92 .15
Group-C
Group-A 2.53(*) .224 .000 1.98 3.07
Group-B .38 .220 .255 -.15 .92
Group-C
* The mean difference is significant at the .05 level.
Even on multiple comparisons group A was found to have statistically
significant less number of trials ( P value of 0.000 ) than group B & C.
NUMBER OF TRIAL FAILURE TABLE 14
Treatment Group Frequency Percent
Group-A
0 27 87.1
1 4 12.9
2 3
Total 31 100.0
Group-B
0 23 74.2
1 6 19.3
2 1 3.2
3 1 3.2
Total 31 100.0
Group-C
0 14 53.8
1 7 26.9
2 4 15.3
3 1 3.8
Total 26 100.0
In group A only 4 out of 31 (12.9%) had 1 trial of SBT failed. In
group B 6 out of 31 (19.3%) had 1 trial failure. 3.2% had 2 and 3trial failures
respectively. In group C 7 out of 26 (26.9%) , 4 out of 26 (15.3%) and 1 out
TABLE 15
Cross table & chi – square test
Treatment Group Total Group-A Group-B Group-C
No. of trial
failure None 27 23 14 44
Percent 87.1% 74.1% 53.8% 72.7%
One or more 4 8 12 24
Percent 12.9% 25.9% 46.2% 27.3%
Total 31 31 26 88
100.0% 100.0% 100.0% 100.0%
P value 0.041
DURATION OF WEANING TABLE 16 - One way ANOVA for duration of weaning
N Mean (hrs) Std. Deviati on Std. Error 95% Confidence Interval
Range P value Lower limit Upper limit Mini mum Maxi mum Group
-A 31 5.10 8.179 1.469 2.10 8.10 2 26 Group
-B 31 31.87 14.796 2.657 26.44 37.30 26 98 Group
-C 26 39.28 19.250 3.850 31.33 47.23 26 98
Total 88 24.46 20.540 2.202 20.08 28.84 2 98 0.000
Mean Duration of Weaning
The mean duration of weaning in group A is 5.1 hrs, with minimum
of 2 hrs and maximum of 26 hrs. In group B it is 31.87 hrs, with minimum
of 26 hrs and maximum of 98 hrs. In group C mean duration of weaning is
39.28 hrs, with minimum of 26 hrs and maximum of 98 hrs.
The duration of weaning is shortest in group A (5.1 hrs ± 2.9)
[image:64.612.89.570.294.560.2]which is statistically significant with P value of 0.000. TABLE 17 - Post Hoc Tests - Multiple Comparisons
(I) Treatment Group (J) Treatment Group Mean Difference (I-J) Std.
Error P value
95% Confidence Interval Lower Bound Upper Bound Group-A Group-A
Group-B -26.77(*) 3.663 .000 -35.72 -17.83
Group-C -34.18(*) 3.876 .000 -43.65 -24.71
Group-B
Group-A 26.77(*) 3.663 .000 17.83 35.72
Group-B
Group-C -7.41 3.876 .178 -16.88 2.06
Group-C
Group-A 34.18(*) 3.876 .000 24.71 43.65
Group-B 7.41 3.876 .178 -2.06 16.88
Group-C
* The mean difference is significant at the .05 level.
Even on multiple comparisons with groups B and C, group A was found
to have statistically significant shorter duration of weaning with a P value of 0.000. There was no statistically significant difference among
WEANING FAILURE
1
6
8
30
25
18
0 5 10 15 20 25 30
Nu
m
b
e
r
Yes No
Weaning failure Group-A
Group-B
Group-C
In group A 1 out of 31 failed weaning (3.2%)
In group B 6 out of 31 failed weaning (19.4%)
In group C 8 out of 26 failed weaning (30.8%)
TABLE 18 Weaning failure
Treatment Group Frequency
Valid
Percent P value
Group-A
No 30 96.8
Yes 1 3.2 0.021
Total 31 100.0
Group-B
No 25 80.6
Yes 6 19.4
Total 31 100.0
Group-C
No 18 69.2
Yes 8 30.8
Total 26 100.0
Group A had statistically less weaning failure than the other 2 groups with a P value of 0.021.
OUTCOME MEASURES TABLE 19
Treatment Group Frequency Percent
Group-A
Death 1 3.2
Recovery without
complication 25 80.6
Recovery with complication 5 16.1
Total 31 100.0
Group-B
Death 5 16.1
Recovery without
complication 20 64.6
Recovery with complication 6 19.3
Total 31 100.0
Group-C
Death 5 19.3
Recovery without
complication 16 61.5
Recovery with complication 5 19.2
Total 26 100.0
All children included in the study were followed up throughout their
hospital stay and their outcomes were observed.
In group A 80.6 % recovered without complications, 16.1 % recovered with
complications & 3.2 % died.
In group B 66.7 % recovered without complications, 18.2 % recovered with
complications & 15.2 % died.
1
5 5
25 22
20
5 6
7
0 5 10 15 20 25 30
Nu
m
b
e
r
Death Recovery without complication
Recovery with complication
Outcome
Group-A Group-B Group-C
TABLE 20 - Factors associated with Weaning failure: Group-A
Treatment Group
Weaning failure
Total
Chi-square value
P-Value
No Yes
N % N % N %
Number of criteria fulfilled
8 17 94.44 1 5.56 18 100
0.746 0.388
9 13 100 13 100
7
Sex
Male 18 94.74 1 5.26 19 100
0.653 0.419
Female 12 100 12 100
Diagnosis
Respiratory 16 100 16 100
2.526 0.640
Cardiac 1 100 1 100
Neurological 8 88.89 1 11.11 9 100
Sepsis 3 100 3 100
Others 2 100 2 100
Comorbidity
No 21 95.45 1 4.55 22 100
0.423 0.516
Yes 9 100 9 100
Shock
No 8 88.89 1 11.11 9 100
2.526 0.112
Yes 22 100 22 100
Inotropes
No 11 91.67 1 8.33 12 100
1.636 0.201
Yes 19 100 19 100
Nosocomial pneumonia
Yes 1 100 1 100
0.034 0.853
No 29 96.67 1 3.33 30 100
Number of trial
1 26 96.30 1 3.70 27 100
0.153 0.696
2 4 100 4 100
Number of trial failure
0 26 96.30 1 3.70 27 100
0.153 0.696
TABLE 21 - Factors associated with Weaning failure: Group-B
Treatment Group
Weaning failure
Total
Chi-square value
P-Value
No Yes
N % N % N %
Number of criteria fulfilled
8 7 63.64 4 36.36 11 100
3.228 0.199
9 17 89.47 2 10.53 19 100
7 1 100 1 100
Sex
Male 13 92.86 1 7.14 14 100
2.439 0.118
Female 12 70.59 5 29.41 17 100
Diagnosis
Respiratory 7 70.00 3 30.00 10 100
2.170 0.538
Cardiac
Neurological 13 86.67 2 13.33 15 100
Sepsis 3 100 3 100
Others 2 66.67 1 33.33 3 100
Comorbidity
No 19 86.36 3 13.64 22 100
1.588 0.208
Yes 6 66.67 3 33.33 9 100
Shock
No 9 75.00 3 25.00 12 100
0.400 0.527
Yes 16 84.21 3 15.79 19 100
Inotropes
No 13 81.25 3 18.75 16 100
0.008 0.930
Yes 12 80.00 3 20.00 15 100
Nosocomial pneumonia
Yes 8 88.89 1 11.11 9 100
0.552 0.457
No 17 77.27 5 22.73 22 100
Number of trial
3 21 91.30 2 8.70 23 100
11.613 0.009
4 3 60.00 2 40.00 5 100
5 2 100 2 100
6 1 100 1 100
Number of trial failure
0 21 91.30 2 8.70 23 100
9.691 0.021
1 3 50.00 3 50.00 6 100
2 1 100 1 100
3 1 100 1 100
TABLE 22 - Factors associated with Weaning failure: Group-C
Treatment Group
Weaning failure
Total
Chi-square value
P-Value
No Yes
N % N % N %
Number of criteria fulfilled
8 7 77.78 2 22.22 9 100
4.927 0.085
9 11 73.33 4 26.67 15 100
7 2 100 2 100
Sex Male 13 81.25 3 18.75 16 100 2.821 0.093
Female 5 50.00 5 50.00 10 100
Diagnosis
Respiratory 6 54.55 5 45.45 11 100
3.168 0.530
Cardiac 1 100 1 100
Neurological 9 81.82 2 18.18 11 100
Sepsis 1 100 1 100
Others 1 50.00 1 50.00 2 100
Comorbidity
No 11 73.33 4 26.67 15 100
0.280 0.597
Yes 7 63.64 4 36.36 11 100
Shock
No 8 80.00 2 20.00 10 100
0.885 0.347
Yes 10 62.50 6 37.50 16 100
Inotropes
No 9 75.00 3 25.00 12 100
0.348 0.555
Yes 9 64.29 5 35.71 14 100
Nosocomial pneumonia
Yes 4 66.67 2 33.33 6 100
0.024 0.877
No 14 70.00 6 30.00 20 100
Number of trial
3 5 62.50 3 37.50 8 100
3.115 0.374
4 10 83.33 2 16.67 12 100
5 2 66.67 1 33.33 3 100
6 1 33.33 2 66.67 3 100
Number of trial failure
0 14 100 14 100
14.432 0.002
1 3 42.86 4 57.14 7 100
2 1 25.00 3 75.00 4 100
FACTORS ASSOCIATED WITH WEANING FAILURE
GROUP B: In group B, children who required more trials ( P 0.009 ) for
weaning & those who had more trial failures ( P 0.021 ) had statistically
significant weaning failure.
GROUP C: In group C, children who had more trial failures ( P 0.002 ) had
statistically significant weaning failure.
[image:72.612.86.541.365.694.2]FINAL COMPARISON OF MAJOR OUTCOME VARIABLES TABLE 23
GROUP A GROUP B GROUP C P – VALUE
WEANING FAILURE N YES NO 31 1 30 31 6 25 26 8
18 0.021
NUMBER OF TRIALS (MEAN) 1.13 ± 0.061 3.27 ± 0.152 3.66 ±