Classification of Power Quality
Disturbances
by
Tuan Anh Hoang, B.E. (Hons.), IEEE Member
School of Engineering
Submitted in fulfilment of the requirements for the degree of
Doctor of Philosophy
Gl.e~~
f
.
'
_._...._'(,.
University o Tasmama
~ v---..Q_ru ~This thesis contains no material which has been accepted for the award of any other
degree or diploma in any tertiary institution. To the best of my knowledge and belief,
the thesis contains no material previously published or written by another person,
except when due reference is made in the text.
Tuan Anh Hoang
Statement of Authority of Access
This thesis may be made available for loan and limited copying in accordance with
the Copyright Act 1968.
·nl{..L Ja+l{finop AW puo sJa+s1s 'Jal{.f.OJq AUi 01
.'ODlf..L LfUDlf..L 6uoH uaAnfiN ajfM A/aAO/ AUi 01
The quality of power supply has become an important issue for electricity utilities
and their customers. In recent years there has been a rising incidence of damage
attributed to the power quality supplied to the customers of electric utilities.
Meanwhile, there has been a rapid increase in the already widespread use of
electronic equipment and modem power electronic devices. These trends have both
decreased the quality of power on the electric grid and increased the equipment's
sensitivity to power quality disturbances.
In order to improve the quality of the power supply, identifying the type and source
of troublesome disturbances is an essential task. Existing automatic disturbance
classification methods have replaced the traditional visual inspection of the
disturbance waveforms. However, they are not reliable because those methods rely
on the classification capability of large neural networks operating on inputs derived
by simply pre-processing the disturbance signals with discrete wavelet transforms
[134,135,136,137,138]. Long and redundant feature vectors both take a long time to
train the network and result in a reduced classification rate. In this thesis, we aim to
develop an efficiency method that automatically classifies power quality disturbances
by using wavelet transform techniques to generate short and nonredundant feature
vector.
Because of the wide range of power quality disturbances and their characteristic
waveforms, ranging from very simple stationary and deterministic harmonics to
highly transient and stochastic waveforms, different and appropriate analysis
techmques are needed to achieve the overall classification objective. It is well known that the traditional Fourier analysis is ideal for analysing steady state signal.
Although it is very powerful, Fourier analysis does not have the temporal resolution
needed to cope with sharp changes and discontinuities in signals.
Recent years have witnessed a proliferation in the applications of wavelet transforms
to signal analysis in a wide variety of fields, from geo-physics to telecommunications
to bio-medical engineering. This has occurred because wavelet analysis provides
dual localisations in both the time and the frequency domains. Moreover, wavelet
analysis allows the flexibility of choosing a wavelet that suits a particular
application. Especially by using the simple and flexible lifting scheme, we can
construct a time-variant or space-variant wavelet - known as second-generation
wavelet. The second-generation wavelet analysis makes optimal use of the
correlation between neighbouring signal samples and between neighbouring
frequency components to construct 'local' wavelets, which adapt to the local characteristics of the signal.
Common types of wavelet schemes are the orthonormal or biorthonormal wavelet
transforms that are typically used in compression and coding applications. This is
due to the fact that those schemes can be implemented with fast algorithms and they
are non-redundant representations of a signal. Unfortunately, they suffer the
limitation of not being translation invariant; a totally different set of transformed
coefficients is obtained when the same signal is shifted. This is the major concern in
pattern recognition applications.
There exist a number of wavelet schemes that have the shift invariance property in
their multiresolution representations. In this thesis, the local maxima and the
matching pursuit techniques are presented as the two most appropriate techniques for
power quality solutions. This is because the two techniques can efficiently
disturbance characteristics so that they represent the disturbances by a compact,
time-invariance feature vector.
The final task of classification is the selection of an appropriate classifier for use
with the feature vector. There are two main approaches of pattern recognition: one is
parametric and the other is non-parametric [129]. Parametric approaches can be
either deterministic or statistical. The statistical parametric approach requires a good
assumption about the statistical distribution of the data. On the other hand, the
non-parametric approach, known as the neural network approach, does not require any
statistical assumption about the data. In our statistical approach, we use a two-layer network structure with locally tuned nodes in the hidden layer, known as Radial
Basis Function (RBF) network [106,120,121]. The network has only a local learning
capability and a limited learning inference from the training data, but trains quickly
as the training of the two layers is decoupled.
In an RBF network, the crucial concern is the selection of cluster centres and their
widths. However, current techniques give suboptimum positions of cluster centres
and their widths, thus limiting the classification rate. To improve the p~rformance of
an RBF network, we propose to modify the structure of the RBF network by
"'
introducing the weight matrix to the input layer (in contrast to the direct connection
of the input to the hidden layer of a conventional RBF) so that the training space in
the RBF network is adaptively separated by the resultant decision boundaries and
class regions. During training iterations, cluster centres, their widths and the input
layer weights are optimally determined together and concurrently adjusted to
maximise the discriminant between classes, thus minimising the classification error.
In this way the network has the ability to deal with complicated problems, which have a high degree of interference in the training data, and achieves a higher
classification rate over the current classifiers using RBF.
For the classification of different types of disturbances that may be present on a
power supply, in this thesis we show that our automatic classification techniques
done in two steps. The first improvement is the extraction of disturbance features
using appropriate signal processing tools from which we obtain an efficiency and
translation invariant feature vector. The second improvement is the designing of an
Firstly, I would like to express my deepest gratitude to my supervisor Professor D.
Thong Nguyen for his valuable guidance, encouragement and support. His valuable
advice and his experience have greatly benefited me academically as vyell as
personally. His willingness and motivation have given me an assured mind and
confidence in my research work. I would also like to express my appreciation for the
research scholarship that he has helped me obtain from his ARC grant for the Power
Quality studies project.
I am also grateful to my co-supervisor Associate Professor Michael Negnevitsky for
his guidance and contribution during my research. His valuable advice and support
have immensely advantaged me with study resources at the early stage of my
research.
I gratefully acknowledge all the staff-of the School of Engineering at the University
of Tasmania, especially Mr. Peter Watt and Dr. Allan Beasley for their kindness and
assistance. Many thanks go to the technical staff of the School for their help and
support for my research facilities. I am also grateful to all my fellow Ph.D students
for their companionship, particularly, Thanh Kieu and Martin Ringrose.
I would like to express my deep sense of gratitude to my parents, who have always
provided great opportunities, encouragement and love to their children. I would like
also to express my love and heartfelt appreciation to my wife for her love and
patience. My love is also dedicated to my daughter, who is so wonderful and who
brings us lots of happiness while we are far away from our homeland.
Finally, I like to extend my appreciation and thanks to the financial support from the
School of Engineering at the University of Tasmania together with the local Energy
Industry, in particular, Hydro-Electric Corporation Tasmania, Comalco Aluminium
and Pasminco Metal. Thanks also given to all friends who have made my life in
Tasmania enjoyable and memorable.
Tuan Anh Hoang
Hobart, 20th February 2003.
School of Engineering
Traditional Fourier transform has been used as a powerful tool for signal analysis and
decomposition. Unfortunately, due to the lack of time localisation, Fourier analysis
cannot deal with transient or non-stationary signals.
Unlike Fourier transform, wavelet transform has the advantage of optimal trade-off
between time resolution and frequency resolution. It can thus provide both time and
frequency localisation. Wavelet analysis is therefore well suited to the analysis of
non-stationary signals.
Wavelet transform has been recognised as a suitable tool to use in power ,quality
monitoring and disturbance recognition or classification since its first publication in
1996 [130]. fu 1999, at the time this thesis was initiated, there are some research
works found in literature in this field. These works however simply re-process the
disturbance signal using wavelet transform, while retaining a large, redundant and
translation variant feature vectors. This requires large neural network classifiers,
making these methods inefficient and requiring a long training time.
The scope of this research is to find an efficient wavelet based technique for
analysing and extracting the features of power quality disturbances, which can be
used for a stability classification for power quality disturbances.
Thesis Organisation
This thesis is organised into nine chapters:
Chapter 1 provides an overview and introduction to power quality problems. It gives
a short background on power system quality and discusses the need for automatic
disturbance classification in power quality monitoring and analysis.
Chapter 2 presents the definitions, the causes and the effects of different types of
power quality disturbances in the power supply. A method for generating the
transient disturbances is introduced.
Chapter 3 covers two important types of local time-frequency decomposition, which
are the short-time Fourier transform, and the wavelet transform. Various wavelet
analysis schemes and their properties are also discussed in this chapter.
Chapter 4 presents the translation invariant wavelet transform modulus maxima
representation. It studies the Lipschitz exponents of a signal that provide a
measurement on the local regularities of the signal. For oscillation singularities, the
general modulus maximum of each modulus maxima chain gives an estimation of the
local frequencies of the signal. The Lipschitz exponents and the general modulus
maxima are used to characterise the transient disturbances. This chapter presents
some numerical demonstrations for transient disturbances using wavelet transform
modulus maxima.
Chapter 5 presents a popular translation invariant representation called matching
pursuit. It discusses fast implementation of the matching pursuit and introduces the
orthogonal matching pursuit. Numerical demonstrations for the transient
disturbances using matching pursuit are also presented.
Chapter 6 covers different pattern recognition approaches. It examines in detail the two commonly used approaches, parametric and non-parametric. A suitable pattern
Chapter 7 provides a modification of the radial basis function network by adding the
feature weights or the input layer weight into the network. Two new training
techniques, which are the knowledge base technique and the generalised technique,
are proposed to train this network. Comparisons are made between the conventional
radial basis function network, the backpropagation network and the modified radial
basis function network trained by one of the two training techniques.
Chapter 8 presents an automatic classification method for classifying 10 power
quality disturbance types. Comparisons for the four transient disturbance types are
made between the classification method developed by the authors and other current
classification techniques.
Chapter 9 gives a summary of the thesis contribution, major results obtained and
Supporting Publications
1. D.T. Nguyen and T.A. Hoang, "Detection of Disturbances on Electricity
Supply Using Wavelets," Proceedings of Australian Universities Power
Engineering Conference and IEAust Electric Energy Conference AUPEC/EECON'99, Darwin, Australia, pp. 231-235, 26-29 Sep. 1999.
2. T.A. Hoang and D.T. Nguyen, "Appropriate Processing for the Classification
of Power Quality Disturbances," Proceedings of Australian Universities Power
Engineering Conference AUPEC 2000, Brisbane, Australia, pp. 196-201, 24-27 Sep. 2000.
3. D.T. Nguyen and T.A. Hoang, "Analysis of Power Transient Disturbances
using Wavelet Transform Modulus Maxima Technique," Proceedings of
Australian Universities Power Engineering Conference AUPEC 2000, Brisbane, Australia, pp. 190-195, 24-27 Sep. 2000.
4. T.A. Hoang and D.T. Nguyen, "Wavelet-based Neural Network for the
Classification of Power Quality Disturbances", Proceedings of Artificial
Intelligence in Science and Technology Conference AISAT 2000, Tasmania, Australia, pp. 273-278, 17-20 Dec. 2000.
5. T.A. Hoang and D.T. Nguyen, "Classification of Power Quality Disturbances
using Wavelets", under review by IEEE Transaction on Power Delivery, Oct.
2001.
6. M. Negnevitsky, M.J. Ringrose, J. Huang and T.A. Hoang, "Neuro-Fuzzy
Classifier for Recognition of Power Quality Disturbances, Quality and
Reliability of Supply", Proceedings of 6th International Transmission and
Distribution Conference and Exhibition, Brisbane, Australia, 11-14 Nov. 2001. 7. T.A. Hoang and D.T. Nguyen, "Wavelet-based Classification of Power Quality
International Multi-Conference on Power and Energy Systems, Marina Del Rey, USA, pp. 282-287, 13-15 May 2002.
8. T.A. Hoang and D.T. Nguyen, "Matching Pursuit for the Recognition of Power
Quality Disturbances," Proceedings 33rd Annual IEEE Power Electronic Specialists ConferenC1e PESC'02, Cairns, Australia, pp. 1791-1796, 23-27 Jun. 2002.
9. T.A. Hoang and D.T. Nguyen, "Training Radial Basis Function Networks for
Wavelet-Based Classification of Power Quality Disturbances," Proceedings 4th
IASTED International Conference on Signal and Image Processing SIP 2002, Hawaii, USA, Paper# 359-112, 12-14 Aug. 2002.
10. T.A. Hoang and D.T. Nguyen, "Improving the Training of Radial Basis
Function Network for Classification of Power Quality Disturbances," IEE Electronic Letters, vol. 38, no. 17, pp. 976-977, Aug. 2002.
11. T.A. Hoang and D.T. Nguyen, "Optimal learning for patterns classification in
RBF networks," IEE Electronic Letters, vol. 38, no. 20, pp. 1188 -1190, Sep. 2002.
12. D.T. Nguyen and T.A. Hoang, "Classification of Power Quality Disturbances
Using Radial Basis Function Networks," Proceedings of International Power Quality Conference IPQC 2002, Singapore, 21-25 Oct. 2002.
13. T.A. Hoang and D.T. Nguyen, "A Comprehensive Training for Wavelet-based
ABSTRACT ... v
ACKNOWLEDGMENTS ... ix
PREFACE ... xi
CONTENTS ... xvii
LIST OF FIGURES ... xxvii
LIST OF TABLES ... xxxi
Chapter 1: AN OVERVIEW & INTRODUCTION TO POWER QUALITY PROBLEMS ... 1
1.1 WHAT IS POWER QUALITY? ... 1
1.2 CLASSIFICATION OF POWER QUALITY DISTURBANCES ... 3
1.3 THESIS CONTRIBUTIONS ... 4
Chapter 2: POWER QUALITY DISTURBANCES ... -... 9
2.1 INTRODUCTION ... 9
2.2 GENERAL CLASSES OF PQ PROBLEMS ... 10
2.3 SOURCES AND DEFINITIONS ... 11
2.3 .1 Transients ... 11
2.3.2 RMS Voltage Variations ... 14
2.3.3 Voltage Imbalance ... 18
2.3.4 Waveform Distortion ... 18
2.3.5 Voltage Fluctuation ... 21
2.3.6 Power Frequency Variations ... 22
2.4 POWER QUALITY STUDY ... 22
2.5 MODELLING FOR POWER QUALITY ... 26
2.6 CONCLUSION ... 28
Chapter 3: TIME-FREQUENCY ANALYSIS TECHNIQUES ... 31
3.1 INTRODUCTION ... 31
3.2 TIME AND FREQUENCY RESOLUTIONS ... 32
3.3 SHORT-TIME FOURIER TRANSFORMS (STFT) ... 35
3.4 WAVELETTRANSFORM ... 37
3.4.1 Continuous Wavelet Transform (CWT) ... 38
3.4.2 Discrete Wavelet Transform (DWT) and Frame ... .43
3.4.3 Orthogonal Wavelet Bases ... .47
Multiresolution Analysis ... .48
Mallat's Pyramid Algorithms and Filter Banks ... 52
3.5 SECOND GENERATION WAVELETS ... 60
3.6 CONCLUSION ... 65
Chapter 4: WAVELET TRANSFORM MODULUS MAXIMA TECHNIQUES ... 67
4.1 INTRODUCTION ... 67
4.2 THE ISSUE OF TRANSLATION INVARIANCE. ... 68
4.3 CHARACTERISATION OF LOCAL REGULARITY WITH WAVELET TRANSFORM ... 73
4.3. l Lipschitz Definition ... ~. 73
4.3.2 Characterisation of Local Regularity with WT ... 74
4.4 WT MODULUS MAXIMA ... 76
4.4.1 Detection of Singularities ... 76
4.4.2 Completeness of the WTMM ... 80
4.5 SINGULARITIES MEASUREMENT USING THE WTMM ... 84
4.5.1 Non-Oscillating Singularities ... 85
4.5.2 Oscillating Singularities ... 85
4.6 NUMERICAL DEMONSTRATIONS ... 88
Chapter 5: MATCHING PURSUIT TECHNIQUE ... 95
5.1 INTRODUCTION ... 95
5.2 TIME-FREQUENCY ATOMIC DECOMPOSITION ... 96
5.3. l Fast Implementations of Matching Pursuits ... 100
5.3.2 Dictionaries of Time-Frequency Atoms ... 102
5.3.3 Discrete Matching Pursuit with Gabor Dictionaries ... 104
5.4 ORTHOGONAL MATCHING PURSUIT ... 106
5.5 NUMERICAL DEMONSTRATIONS ... 108
Chapter 6: PATTERN RECOGNITION APPROACHES ... 115
6.1 INTRODUCTION TO PATTERN RECOGNITION ... 115
6.2 BA YES IAN PARAMETER ESTIMATION APPROACH ... 117
6.2.1 General Consideration ... 117
6.2.2 Discriminant Functions ... 118
6.3 ARTIFICIAL NEURAL NETWORK APPROACH ... 120
6.3.1 Multilayer, Feedforward Network Structure ... 121
6.3.2 Training the Feedforward Network ... 123
6.3.3 Self-Organising Mapping (SOM) Algorithm ... 128
6.4 RADIAL BASIS FUNCTION APPROACH ... 129
6.4.1 The RBF Network Structure ... 130
6.4.2 Unsupervised Training for RBF Networks ... 133
6.4.3 Supervised Training for RBF Networks ... 135
6.5 CONCLUSION ... 138
Chapter 7: OPTIMAL LEARNING FOR PATTERN CLASSIFICATION IN RBF NETWORKS ... 141
7.2 THE PROPOSED RBF NETWORK. ... 142
7.2.1 The Network Structure ... 142
7.2.2 Initialisation of the RBF Network ... 144
7.3 KNOWLEDGE-BASED TECHNIQUE FOR TRAINING FEATURE WEIGHTS ... 145
7.3.l Construction of the Knowledge-Base ... 145
7.3.2 Training the Feature Weights ... 149
7.4 GENERALISED TECHNIQUE FOR TRAINING THE INPUT LA YER WEIGHTS ... 150
7.5 NUMERICAL DEMONSTRATION & CONCLUSION ... 154
Chapter 8: APPROPRIATE SIGNAL PROCESSING TOOLS FOR THE CLASSIFICATION OF POWER QUALITY DISTURBANCES 157 8.1 APPROPRIATE SIGNAL PROCESSING TOOLS ... -... 157
-:.1. 8.2 FOURIER TRANSFORM FOR STEADY STATEDISTURBANCES ... 159
8.3 FEATURES EXTRACTION USING WTMM ... 163
8.4 FEATURES EXTRACTION USING MATCHING PURSUIT ... 165
8.5 AUTOMATIC CLASSIFICATION OF PQ DISTURBANCES ... 170
8.6 RESULTS, COMPARISON & CONCLUSION ... 172
8.6.1 Classification Results ... 172
Chapter 9: CONCLUSIONS & SUGGESTIONS FOR FURTHER
RESEARCH ... 177
9 .1 CONCLUSIONS ... 177
9.2 SUGGESTIONS FOR FURTHER RESEARCH ... 180
GLOSSARY
PARAMETER
</J(t)
lfl(_ t)
'P(m)
T/ ~,
m
'2!
di
E(t, m)
f(t) g(n) g(n) h(n) h(n) h(n) Scaling function Wavelet function
Fourier transform of wavelet function
Gaussian noise
Frequency parameter
Resolution at scale, j
Approximation for discrete 1-D wavelets, at/h scale
Detail for discrete 1-D wavelets, atl scale
Time-frequency energy
Continuous signal in spatial domain
Discrete time domain highpass analysis filter
Discrete time domain highpass synthesis filter
Discrete time domain lowpass analysis filter
Discrete time domain lowpass synthesis filter
Mirror image of h(n)
Square root of-1
Id Identity operator
J lh scale in the discrete wavelet transform, j E Z
L2(Rn) Space of measureble, square integrable n-dimensional functions Rn Euclidean space of n-dimentions
s Scale in continuous wavelet transform
s1 Scale in discrete wavelet transform, at/h scale t, r Signal parameter (temporal or spatial) in 1-D
ij
A vector space that is the set of all approximations of a signal in L 2(R) Z Set of integers in 1-DABBREVIATIONS
AC Alternating Current
CWT Continuous Wavelet Transform
DC Direct Current
DWT Discrete Wavelet Transform
FIR Finite Impulse Response (filters)
FT Fourier Transform
HF High-Frequency Capacitor Switching Disturbance
IT Impulse Transient Disturbance
NT Notch Disturbance
LF Low-Frequency Capacitor Switching Disturbance
pu per unit
RMS Root Mean Square
STFT Short Time Fourier Transform
WT Wavelet Transform
MATHEMATICAL SYMBOLS
a
Partial derivative\/ For all
::3 There exists
L
The sum ofIT
The product of Absolute value ofII II Magnitude of
< > Inner product of
/'(t) Complex conjugate of x(t)
00 Infinity
n; pl
µ
Mean valuelimj--7~ The limit as j tends to infinity
0
A ffi B ®
c
u n J_
Convolution
Append the vector space, A, to the vector, B Tensor product
Subset of
Union of
Intersection of
Figure 1.1: A general block diagram for PQ disturbance classification ... 4
Figure 2.1: An impulsive transient caused by lightning ... 13
Figure 2.2: Oscillatory transient caused by a capacitor switching ... 14
Figure 2.3: A voltage sag caused by a SLG fault (from [11]) ... 15
Figure 2.4: A momentary interruption caused by a fault and subsequent recloser
operations (from [11]) ... 16
Figure 2.5: A harmonic voltage waveform ... 19
Figure 2.6: Notching caused by a three-phase converter ... 20
Figure 2.7: Voltage flicker caused by arc furnace operation ... 22
Figure 2.8: Source of power quality disturbances (Florida power study 1993) ... 23
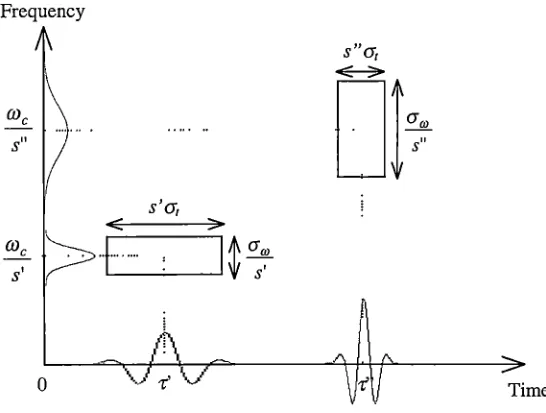
Figure 3 .1: Heisenberg box representing the resolution of an atom <Pr in the
time-frequency plane ... 34
Figure 3.2: Heisenberg box of two STFT atoms g,..,cJJ'Ct) and g,. .. ,0J"(t) ... 36
Figure 3 .3: The tiling of the time-frequency plane for the (a) STFT and the (b) WT. ·
... 39
Figure 3.4: Three basis functions and their corresponding time-frequency resolution
windows of the (a) STFT and (b) WT ... 39
Figure 3 .5: Heisenberg box of two wavelet atoms ... 42
Figure 3.6: Orthogonal WT using the pyramid algorithm ... 54
Figure 3.7: Inverse orthonormal WT using the pyramid algorithm ... 55
Figure 3.8: A two-channel multirate filter bank ... 56
Figure 3. 9: Diagram of a lifting scheme ... 62
Figure 3.10: Lifting scheme starting with the Lazy wavelet ... 63
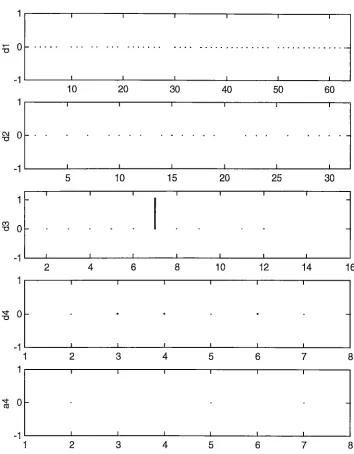
Figure 4.1: A D4 wavelet basis functions in the third subband ... 69
Figure 4.2: The four-level wavelet coefficients of the signal in Figure 4.1 ... 70
Figure 4.3: The four-level wavelet coefficients of the signal in Figure 4.1 shifted by
one sample ... 71
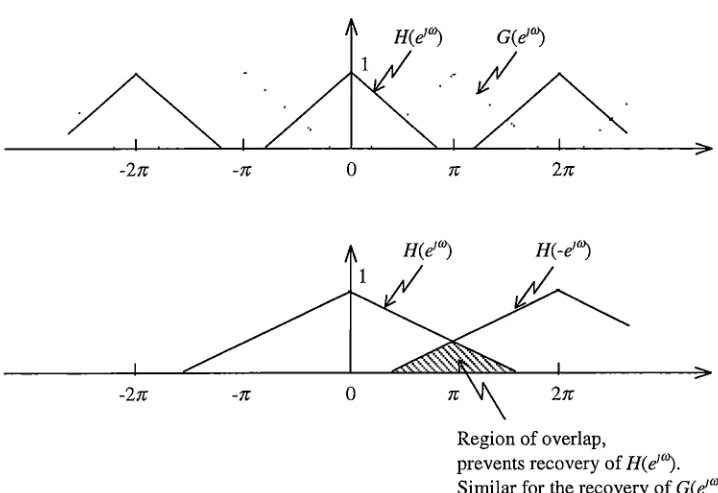
Figure 4.4: The subsampling by 2 cause aliasing and prevents recovery of the
original signals ... 72
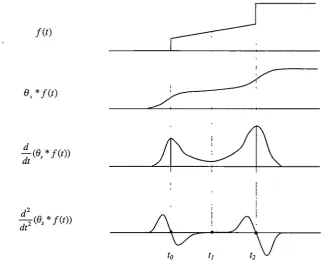
Figure 4.5: WT modulus maxima W1
'i°(s,t) and WT zero-crossings
W
2'i°(s,t) of a two-steps signalf(t) ... 78Figure 4.6: Graph of the smoothing cubic spline function B(t) and the corresponding quadratic spline wavelet lfl(_t) . ... 79
Figure 4.7: The reconstruction of the dyadic WT by alternately projecting operators
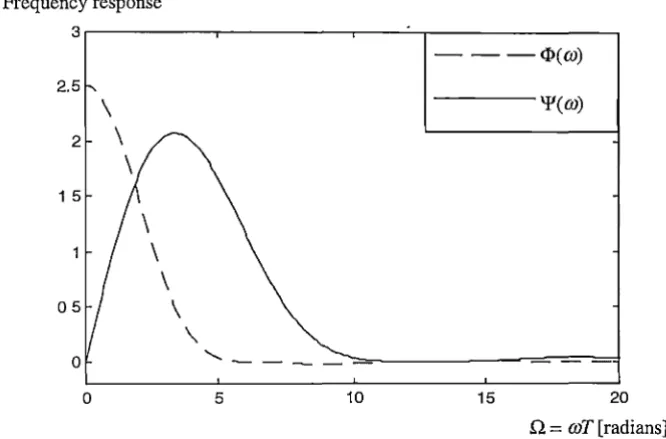
Pr and Pv . ... 84 Figure 4.8: Frequency spectrums of the quadratic spline wavelet and its
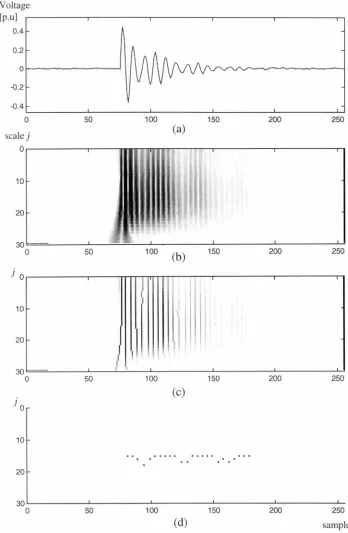
Figure 4.9: (a) 256 samples of a impulse transient disturbance f(n). (b) The wavelet transforms Wf(s,n), s = sr}, s0 = l.l,j = 0:29. (c) Modulus maxima
chains. (d) General modulus maxima representation ofj(n) ... 90
Figure 4.10: (a) 256 samples of a low frequency capacitor switching disturbance f(n).
(b) The wavelet transforms Wf(s,n), s = sd, s0 = l.l,j = 0:29. (c)
Modulus maxima chains. ( d) General modulus maxima representation of
f(n) . ... 91
Figure 4.11: (a) 256 samples of a high frequency capacitor switching disturbance
f(n). (b) The wavelet transforms Wf(s,n), s
=
sr}, so= l.l,j=
0:29. (c) Modulus maxima chains. ( d) General modulus maxima representation off(n) . ... 92
Figure 4.12: (a) 256 samples of a single notch disturbance f(n). (b) The wavelet transform Wf(s,n), s = sr}, so= l.l,j = 0:29. (c) Modulus maxima chains. (d) General modulus maxima representation ofj(n) . ... 93
Figure 5.1: (a) 256 samples of an impulse transient disturbancef(n); (b)
Time-frequency energy distribution of the disturbance signal Ef(n,k) obtained from the matching pursuit with Gabor dictionary; ( c) Energy conversion
llR11
Yll2/l!fll2 versus the number of iterations m of the matching pursuit. 109 Figure 5.2: (a) 256 samples of a low frequency capacitor switching disturbance f(n);
(b) Time-frequency energy distribution of the disturbance signal Ef(n,k)
obtained from the matching pursuit with Gabor dictionary; (c) The
energy conversion llR'1]'!12/l!fll2 versus the number of iterations m of the matching pursuit. ... 110
Figure 5.3: (a) 256 samples of a high frequency capacitor switching disturbance f(n);
(b) Time-frequency energy distribution of the disturbance signal Ef(n,k)
obtained from the matching pursuit with Gabor dictionary; ( c) The
Figure 5.4: (a) 256 samples of a single notch disturbancef(n); (b) Time-frequency
energy distribution of the disturbance signal Ef(n,k) obtained from the matching pursuit with Gabor dictionary; ( c) The energy conversion
11Rmj112/l!fll2 versus the number of iterations m of the matching pursuit .. 112
Figure 6.1: A schematic depiction of a two-layer feedforward network ... 122
Figure 6.2: A one-dimensional topology mapping configurations ... 128
Figure 6.3: General structure of a Radial Basis Function Neural Network ... 130
Figure 6.4: Training space is divided into hyperrectangles organised into a binary
tree ... 136
Figure 7 .1: The proposed RBF network with the input layer weights ... 143
Figure 7.2: Distribution of the average scale
s
in the training set ... 146Figure 7 .3: Distribution of the standard deviation of the scale CYs in the training set
... 147
Figure 7.4: Distribution of the average Lipschitz exponent a in the training set...147
Figure 7.5: Distribution of the standard deviation of the Lipschitz exponent
era
in thetraining set ... 14 7
Figure 7.6: Distribution of the disturbance duration Lin the training set ... 148
Figure 8.1: (a) DFT coefficients of a harmonic disturbance; (b) DFT coefficients of
a voltage fluctuation disturbance; (c) DFT coefficients of a voltage
frequency variation disturbance ... 162
Figure 8.2: Distribution of the average window size
s
in the training set ... 166Figure 8.3: Distribution of the standard deviation of the window size CYs in the
Figure 8.4: Distribution of the average modulating frequency ;; in the training set167
Figure 8.5: Distribution of the standard deviation of the modulating frequency a~ in the training set ... 167
Figure 8.6: Distribution of the disturbance duration Lin the training set ... 168
Figure 8.7: Distribution of the average frequency energy distribution E in the
training set ... 169
Figure 8.8: Distribution of the standard deviation of the frequency energy
distribution aE in the training set ... 170
Figure 8.9: Block diagram of the proposed method for the automatic classification of
Table 2.1: Categories and Characteristics of Power System Electromagnetic
Phenomena ... 12
Table 2.2: Simulation parameters for the generation of disturbance ... 28
Table 7 .1: Ranking of feature components in the order of their interclass
discriminating power ... 148
Table 7 .2: Classification results for a conventional RBF initialised by a regression
tree ... 155
Table 7.3: Classification results for the RBF network with the knowledge-based
training technique ... 155
Table 7.4: Classification results for the RBF network with the generalised training
technique ... 155
Table 7.5: Classification results for the backpropagation network ... 156
Table 8.1: Classification results with the matching pursuit feature vector
(s,
as,
c;,
a
g, L) by a conventional RBF network ... 173Table 8.2: Classification results with the matching pursuit feature vector
(s,a s ,c;,ag, L) by the backpropagation network ... 173
Table 8.3: Classification results with the matching pursuit feature vector
(s,
as ,
c;-,
a
g , L) by the RBF network of generalised training technique .17 4Table 8.4: Classification results with the new matching pursuit feature vector
(s,
as,
E,a
E, L) by the RBF network of generalised training technique 174AN OVERVIEW
&
INTRODUCTION TO POWER
QUALITY PROBLEMS
1.1 WHAT IS POWER QUALITY?
The term 'power quality' applies to a wide variety of electromagnetic phenomena on
power systems. Although it is difficult to define precisely, power quality (PQ)
fundamentally describes the consistency of the voltage and current waveforms on a
power system or within an electrical power customer facility. It is perhaps more
relevant to discuss the commonly used term a 'PQ problem'. A PQ problem can be
categorised as a disturbance caused by a piece of equipment, a combination of pieces
of equipment, or a network configuration that impacts on the voltage and/or current
waveforms in such a way that adversely affects the operation of other equipment on
the system. Optimally, the voltage waveform at all points on a power system should
be a perfect sinusoid at nominal voltage and frequency. This is impossible to achieve
1
m practice due to inconsistent loads and the dynamic nature of power system
operation, so limits are defined for acceptable deviations away from the optimum.
Different electrical equipment or systems have different abilities to cope with the
deviations of the power supply. Nowadays much electronic equipment is very
sensitive to changes on the power supply and can easily mis-operate if the voltage
exceeds these limits.
PQ problems have been evident for many years, but it is only in the last decade that
they have become a major concern to electric power utilities and customers. This is
mainly due to the increasing use of microprocessor-based electronics, power
electronic devices and power factor correction capacitor banks. The increasing use
of electronic and power electronic devices presents a two-fold problem with regard
to PQ. These devices are typically more sensitive to PQ disturbances and also
produce more PQ problems than the electromechanical power system devices used in
the past. Capacitor banks reduce reactive power flow, decreasing losses, but can also
trigger sensitivities to a range of PQ disturbances, especially harmonics. They can
also produce transient disturbances when switching of capacitor banks is
implemented.
PQ problems represent a huge cost to business in lost productivity and equipment
damage. It is not uncommon for a momentary utility breaker operation to result in a
loss of $10,000 to an average sized industry by shutting down its production line,
which will require many hours to restart. Large-scale industries can lose millions of
dollars per hour in lost production if one machine or process in a production line fails
due to a PQ problem. Utilities and customers are spending increasing amounts of
money monitoring, studying and improving PQ in order to minimise the economic
impact of these problems. Customers are becoming more aware of PQ issues and the
problems poor PQ can cause. Of major concern in the study of PQ, is locating the
source of PQ disturbance on a power system. Generally, the source must be located
1.2 CLASSIFICATION OF POWER QUALITY
DISTURBANCES
The current practice is to perform manual studies into possible causes of the problem
[1,130], which is at best, a highly inefficient and costly task. In many cases it is a
relatively simple task for a human to categorise a disturbance based on a visual
inspection of a recorded waveform. However, as is the case with many visual tasks
that humans find simple, automatic computer classification has proved to be much
more difficult. Although the need for automatic determination of disturbance source
location has been apparent for some time, there are only a small number of solutions
towards this goal that can be found in the literature. It is obvious that because each
power system is different, the system response to a PQ disturbance will be different,
making it a very complex task to develop a generalised PQ source locator.· Also ~
power system parameters change constantly with the load and generation schemes.
At the University of Tasmania in Australia, a collaborative effort between its School
of Engineering and the local energy industry has been pursued to develop an accurate
and robust PQ monitoring and disturbance recognition system. Our technique, in this
collaborative project, uses wavelet analysis for the detection and feature extraction of
power quality disturbances, and neural pattern classification for the identification of
their origin.
There are a number of methods for detecting particular types of power system
disturbances, in particular for fault detection [2,3,4] and transformer inrush [5], but
these are limited in their application. Using an individual artificial neural network,
the authors of [6] attempt to automatically classify PQ disturbances in the time
domain. This work has been further refined by pre-processing the signals using the
discrete wavelet transform (DWT) in a time-scale domain [134,135,137]. However
these techniques use the entire set of DWT coefficients, which is very large and is
lack of time shift-invariance. Therefore, it takes a long time to train and' does not
guarantee a convergence of the neural network. Moreover, the methods cannot
time-scale domain is completely unpredictable and results in a substantial overlap in range
between different types of disturbance. Various wavelet kernels have been
investigated in [7, 132].
This thesis proposes a number of new wavelet-based techniques for automatically
identifying the type and source of PQ disturbances, and shows that the wavelet-based
techniques that we propose produce compact and time-invariant feature vectors.
These two characteristics render efficiency and stability to the training and
convergence of classifiers of PQ disturbances.
1.3 THESIS CONTRIBUTIONS
A general block diagram for PQ disturbance classification is shown in Figure 1. The
first step in classification is to understand the sources and characteristics of the signal
that we are dealing with. So in Chapter 2, we take a close look at all technical
aspects of power quality and disturbances. In that chapter, the definition of each type
of disturbance and its characteristics are presented. Depending on the natural
characteristics and the phenomena of disturbances, they are classified into two main
groups: transient and steady states. Since different disturbance types may have
different specific characteristics, we intend to use different signal processing tools to
analyse different types.
Feature Extraction
Pattern
Classification output
Figure 1.1: A general block diagram for PQ disturbance classification.
For the next step of classification, different signal processing techniques are used to
extract signal features for further processing. The signal is analysed in the time and
frequency domains, so that it can be reduced to a number of components, the
The number of atoms and the efficiency of the method are greatly dependent on the
correlation between the signal and the analysis kernel. In this thesis, the author
proposes some new feature extracting techniques that use appropriate signal
processing tools such as Fourier transform (FT), wavelet transform modulus maxima
(WTMM) and the matching pursuit for power quality disturbances classification.
In Chapter 3 an introductory analysis of several time-frequency techniques is
presented. The properties of signals are revealed by transforms that decompose
signals into elementary functions that are well concentrated in time and frequency.
We present two important types of local time-frequency decomposition, which are
the short-time Fourier transform (STFT) and wavelet transform (WT). The localised
nature of time-frequency decomposition is important. However it is limited by the
Heisenberg uncertainty principle.
The issue of translation invariance is significant in pattern classification. A DWT or
wavelet frame is not adequate to deal with this issue. Chapter 4 presents the WTMM
technique that maintains the translation invariance by only sampling the scale
parameter and leaving the time parameter in a continuous manner. Moreover,
singularities and irregular structures often carry essential information in a signal, and
they can be detected by following the WTMM coefficients at fine scales. So at the
end, the signal features that we obtain from the WTMM are much more compact than
the entire set of WT coefficients and they are also time-invariant.
In STFTs, the window of the time-frequency atoms has a constant size. Therefore,
STFTs are not well adapted to signal structures that are much smaller or much larger
in window size. On the other hand, a wavelet transform is built by relating the
frequency to the scale (window size). The resulting family of waveforms are dilated
and translated versions of a single mother wavelet. This has a limitation on the
estimation of frequencies that are well localized in the Fourier transform domain,
especially at high frequencies. In general, adaptive signal decomposition involves
the expansion of a signal over a set of waveforms, which are selected appropriately
from a large and redundant dictionary. Chapter 5 presents a general algorithm called
The most important step in a classification task is the selection of feature vector and
the designing of a correspondent distance metric for pattern matching. Chapter 6
discusses the two main approaches of pattern recognition: one is parametric and the
other is non-parametric [129]. Parametric approaches can be either deterministic or
statistical. The statistical parametric approach requires a good assumption of the
underlying distribution of the data. On the other hand, the non-parametric approach,
known as the neural network approach, does not require any statistical assumption of
the data. In PQ classification problems, most researchers [134,135,137] simply
pre-process the signal but still retain a large and redundant amount of data, then rely on
the capacity of a neural network for the classification. These methods are therefore
inefficient and may not produce a high classification rate. In this thesis, we propose
methods that extensively study the signal characteristics via a number of signal
processing tools. Then a small number of signal features that have clear statistical
distribution between different types of disturbance are selected. With this small
number of selected signal features, a small classifier network is required by either
using the parametric or non-parametric approach.
There are a variety of Artificial Neural Networks (ANNs) with different structures.
Each network has its own advantages and disadvantages. Multilayer perceptrons
(MLPs) including the backpropagation neural networks, are typical of globally generalising networks which have the capability of robust learning inference and generalisation from the training data. These networks, however, are very slow in
learning and suffer from the possibility of being trapped in local maxima of the
chosen optimisation cost function. Existence of optimisation techniques such as
genetic algorithm [8], learning automata [9], and proper initialisation of connection
weights [10] are capable to achieve a global minimum, they require extensive
computation and also in many applications there is inadequate prior knowledge about
the training examples to allow a good estimate for the initialised setting. In our statistical approach, we use a two-layer network structure with locally tuned nodes in
the hidden layer, known as Radial Basis Function (RBF) network [120]. The
network, therefore, has only a local learning capability and a limited learning
of the two layers is decoupled. When using an MLP network the training is
iteratively coupled together. Furthermore, the locally tuned or self-organised ability
of the hidden layer in an RBF network is equivalent to a very efficient initialisation
of the connections, thus giving the network the ability to avoid local minima.
In the classification of power quality disturbances, the prior knowledge of the classes
does in fact allow us to effectively initialise the RBF network. Disturbance types
have their attributes widely spread over well-known time and frequency ranges.
Although these ranges overlap, their cluster centres are well separated. This type of
training data should favour the use of networks with self-organising capability in the
first hidden layer since they are being free from local maxima and are much faster to
train. This is our motivation for the use of an RBF for classification of transient
power quality disturbances.
In Chapter 7, we propose two new techniques to improve the performance of an RBF
network. In many applications, some features of a data pattern are more important or
more discriminating than other features, e.g. the formant frequencies of a voiced
sound, the dominant components in a principal component analysis. The pattern
matching gives more weight to these components in the feature vector. ~herefore, to '
increase the discriminant between classes, a feature weight vector is introduced to the
distance measurement. We then carry out a comprehensive knowledge-base training
algorithm for the RBF classifier so that at its convergence the network gives both the
optimal feature weight vector as well as the cluster centres and their scaling width.
Moreover, in most cases the importance level of a given feature is different in
different classes and the general form of the feature weight should be a matrix. Also
in some cases it is difficult to construct a knowledge base precisely. Therefore, we
take a further step to modify the structure of the RBF network by introducing a
weight matrix to the input layer in contrast to the direct connection of the input to the
hidden layer of a conventional RBF. We then train this weight matrix as a single
layer perceptron together with the clustering training. This still retains the speed
advantage of an RBF network over an MLP, while archiving a higher classification
Chapter 8 presents the proposed techniques for the classification of power quality
disturbances, and the classification results of these techniques. Depending on the
signal characteristics, appropriate signal processing tools are proposed to extract
different discriminating features from the disturbance signal, hence enhancing the
classification results. We also present some comparative results between our
techniques and current techniques.
The last chapter, Chapter 9, provides a conclusion to the work contributed by this
POWER QUALITY
DISTURBANCES
2.1
INTRODUCTION
In recent years, power quality has become an important concern for utility, facility
and consulting engineers [10,65,135,134]. End user equipment is more sensitive to
disturbances that arise both on the supplying power system and within customer
facilities. Also, this equipment is more interconnected in the network and industrial
process, therefore the causes of disturbances on the system are much more severe. A
recent E SOURCE survey claimed more than 50% of larger users are significantly
affected by power quality on their company's overall performance. In high-tech
industry, a single power outage can easily cause the company losses of US$1 million
or more, while the average outage that facilities experience is 3.5 outages per year.
It is important to understand the phenomena of power quality variation that causes
problems with sensitive loads. Categories of these variations must be developed with
a consistent set of definitions so that measuring equipment and analysis tools can be
designed to handle different types of disturbance. Also the first and the most
important step in identifying the source of a disturbance is to correlate the
disturbance waveform with the possible cause, i.e. recognising the category of the
disturbance (e.g. load switching, capacitor switching, lightning, remote fault
condition, ect.). This requires a full understanding of the characteristics of each
disturbance category. Once the category for the cause has been determined, the
identification becomes much more straightforward.
This chapter describes the characteristics of different types of PQ disturbances and
presents a method for generating PQ disturbances.
2.2
GENERAL CLASSES OF PQ PROBLEMS
Power quality disturbances usually result in voltage or current waveform being
deviated from the normal level. However it is essential to maintain the voltage
waveform within a certain limit so that it can retain the quality of power supply.
Moreover, the power supply system can only control the quality of the voltage. It
has no control over the currents that particular loads may draw. Therefore, the limits
defining normal operations in power systems are generally given in terms of voltage
[11,13].
Several international standards have been proposed for PQ problems, such as the
Institute of Electrical and Electronic Engineers Standards Coordinating Committee
22 (IEEE SC22) or the International Electrotechnical Commission (IEC) standard or
the American National Standards Institute (ANSI).
Basically, PQ disturbance can be divided into seven main categories in terms of their
deviation of the voltage waveform. They are:
1. Transients
2. RMS voltage variation
4. Waveform distortion
5. Voltage fluctuation
6. Power frequency variation
As in [11], based on the source, duration and severity of disturbances on the power
system, disturbances in these main categories can be further sub-grouped as shown in
Table 2.1. In this table, the three most important disturbance attributes, which are
spectral content, duration, and voltage magnitude, are presented for each type.
2.3
SOURCES AND DEFINITIONS
2.3.1 Transients
According to the IEC standard, a transient is defined as: pertaining to or designating
a phenomenon or a quantity which varies between two consecutive steady states
during a short time compared with the time-scale of interest.
The term transients has long been used in the analysis of power system variations to
denote an event that is undesirable but momentary in nature. In power systems,
when we encounter the word transient we probably think of a damped oscillatory
transient due to a RLC network. A transient can also result from a lightning strike
for which a surge arrester is used for protection. Transients can be classified into
two categories, impulsive and oscillatory. These terms reflect the waveshape of a
current or voltage transient.
Impulsive transient:
An impulse transient is a sudden non-power frequency change in the steady state
condition of voltage or current that is unidirectional in polarity. To characterise
the rise and decay times. We can also reveal impulse transients by their spectral
content. Lightning is the most common cause of impulse transients. Figure 2.1
shows an example of an impulsive transient caused by lightning.
1.
2.
3.
4.
5.
6.
Typical spectral Typical
Categories Typical duration voltage
content
magnitude
Transients
1.1 Impulsive 5ns - O. lms rise 50ns - lOms
1.2 Oscillatory 400Hz- 5MHz 5µs - 50ms 0- 8pu
RMS voltage variation
2.1 Interruption 0.5cycles - lmin
<
O.lpu2.2 Sag (dip) 0.5cycles - lmin 0.1 - 0.9pu
2.3 Swell 0.5cycles - lmin 1.1 - l.2pu
2.4 Interruption, sustained > lmin 0.0 u
2.5 Under-voltages > lmin 0.8 - 0.9pu
2.6 Over-voltages > lmin 1.1 - l.2pu
Voltage unbalance Steady state 0.5 -2%
Waveform distortion
4.1 de offset Steady state 0 - 0.1 %
4.2 Harmonics 0 - lOOth Steady state 0-20%
harmonics
4.3 Interharmonics 0- 6kHz Steady state 0-2%
4.4 Notching Steady state
4.5 Noise Broadband Steady state 0-1%
Voltage fluctuation <25Hz Intermittent 0.1 - 7%
Power frequency variations < 10s
Table 2.1: Categories and Characteristics of Power System Electromagnetic
Due to the sudden change of impulse transient, it can be responded to by many
circuit components, and produce oscillation transients which have significantly
different characteristics when viewed from different parts of the power system [ 11].
Time [µs]
0 25 50 75 100 125 150 175
-50
~
<l.) -100
~
~ -150-200 -250
Figure 2.1: An impulsive transient caused by lightning
A common problem caused by impulse transients is divides damage. Oft~n the over-voltage in impulse transients can be high enough to damage
inadequat~ly
protectedequipment. Impulses can cause electronic equipment to malfunction or be temporary
offline.
Oscillatory transient:
An oscillatory transient is a sudden, non-power frequency change in the steady state condition of voltage or current that includes both positive or negative polarity value.
An oscillatory transient normally takes the form of a damped sinusoid. It is
described by its spectral content (predominate frequency), duration and magnitude.
This category of disturbance is frequently come across in utility subtransmission and
distribution systems. Capacitor switching mainly causes oscillatory transient
. ,
[12,13]. Also many other types of events can cause this type of disturbance, namely
transformer switching operation, ferro-resonant, as well as the response of circuits on
the power system to an impulsive transient. An example of low frequency capacitor
switching is shown in Figure 2.2.
Voltage [V]
200
100
0
-100
-200
0 20 40 60 80
Time [ms]
Figure 2.2: Oscillatory transient caused by a capacitor switching
Major causes of oscillation transients are variable-speed drive trip-outs and
electronic equipment malfunctions. Large magnitude oscillation transients can also
cause damage to unprotected equipment and as its large potential energy is
contained, arrestors require a high quality to survive.
2.3.2 RMS Voltage Variations
A RMS voltage variation is a variation of the RMS value of the voltage from
nominal voltage for a time greater than one-half a cycle of the power frequency. It
can be a reason of fault conditions, irregular loose connections in power wiring, or
switching of large loads that require high starting current, as well as variation in load
Depending on the system condition and the location of the fault, it can cause a short
duration (less than one minute) of either voltage drop (sag), or voltage rise (swell), or
a complete loss of voltage (interruption). Long duration variations (greater than one
minute) such as over-voltages or under-voltages are generally not due to system
faults, but are caused by system switching operations and load variations [ 10, 11].
Sags:
The term voltage sag has been used for many years in the power quality community.
It describes a short duration voltage decrease whose RMS value varies between 0.1 and 0.9 pu for durations from 0.5 cycles to one minute.
Sags are commonly associated with system faults. However heavy loads switching
can also cause voltage sags. They are described by their RMS' value and duration.
The voltage drop in sags can cause sensitive electronic equipment to drop out or to
malfunction. An example of voltage sag that is associated with a
single-line-to-ground (SLG) fault is shown in Figure 2.3.
Voltage [V]
•I,
200 ,,,
A
n
100
I
0
J
l
-100
-200 J
0 20 40 60 80 100 120 140
Time [ms]
Figure 2.3: A voltage sag caused by a SLG fault (from [11]).
Swells:
A voltage swell is a temporary increase in the RMS value of the voltage of between
1.1 to 1.8 pu (typical between 1.1 to 1.2 pu), at the power frequency, for durations
from 0.5 cycles to one minute.
As in sags, the main causes of swells are system faults, but they not as common as
sags. During a SLG fault, the voltage on the un-faulted phases can temporary rise
and create swell. The over-voltage in swells can damage electronic equipment if
severe enough, or cause sensitive equipment to drop out or malfunction.
Interruption:
Interruptions are a type of short duration variation, where there is a complete loss of
voltage (
<
0.1 pu) on one or more phase conductors for a time period from 0.5 cycles to one minute.Voltage [V]
200
n
100 ,
/
0
v
-100
-200
0 20 40 60 80 Time [ms]
100 120 140
Figure 2.4: A momentary interruption caused by a fault and subsequent recloser
operations (from [11]).
An interruption can be the result of power system faults or equipment failures. It is characterised by only the duration since it is associated with a total lost of voltage.
instant protective equipment recloses to the time that the fault is cleared. Long
interruptions are likely to cause most electronic devices to shut down [11]. Figure
2.4 shows an interruption caused by fault, followed by several protective reclosers
operating until the fault is finally cleared.
Under-voltage:
Under-voltage is used to describe a specific type of long duration variation, which
has a voltage value of between 0.1 and 0.9 pu (typical between 0.8 to 0.9 pu) and
lasts for more than one minute. It is typical a result of loads switching on, or a
capacitors switching off. Overloaded circuits, or incorrect tap settings on
transformers, can also cause under-voltage.
Under-voltage is normally associated with cause other than system fault; and can be
controlled by voltage regulation equipment.
Over-voltage:
Over-voltage is used to describe a specific type of long duration variation, which ·has
a voltage value of greater than 1.1 pu and lasts for more than one minute. It is
mainly caused by load reductions, capacitor switching on, or incorrect tap setting on
transformers.
Under and over-voltage may cause equipment to drop out, malfunction or be
damaged. As with all equipment, the abnormal voltage levels produce excess
heating, shortening their lifespan and reducing their efficiency.
Sustained interruptions:
Sustained interruptions are a type of long duration variation, which has a complete
The distinction between an interruption and sustained interruption is that the latter
are longer than one minute and are often permanent. They normally cause
mechanical devices to shut down, in some cases with costly consequences. This type
of PQ problem requires human intervention to repair before power is restored.
2.3.3 Voltage Imbalance
Voltage imbalance (unbalance) is defined as the difference in the voltages amplitude
of three phases in a three-phase system. It can be measured using symmetrical
components. The ratio of either the negative or zero-sequence component to the
positive sequence component can be used to specify the percent unbalance [11].
Single-phase loads on a three-phase circuit can cause the voltage to unbalance by less
than two percent. Server voltage imbalance can be caused by single-phasing
conditions.
2.3.4 Waveform Distortion
Waveform distortion is a steady state deviation from the perfect sine wave of power
frequency. Basically, the characteristics of distortion can be reviewed from the
spectral content. Waveform distortion contains five primary categories: DC offset,
harmonics, inter-harmonics, notching and noise.
DC offset:
DC offset is defined by the presence of a DC component in voltage or a current in an
AC power system. DC current is normally due to the effect of half-wave
rectification. It causes biasing in transformer cores which results in excessive
Harmonics:
Harmonic distortions are the presence of sinusoidal voltages or currents whose
frequencies are integer multiples of the fundamental power frequency (power system
operates at fundamental frequency, i.e. 50 or 60Hz) in the power signal. It is caused
by non-linear loads on the power system. Figure 2.5 shows a harmonic distortion of
a voltage waveform.
To specify the harmonic distortion levels, the complete harmonic spectrum is
reviewed with magnitudes and phase angles of each harmonic component. The total
harmonic distortion is also commonly used to determine the effective value of the
harmonics distortion level.
Voltage [V]
200
100
0
-100
-200
0 20 40 60 80
Time [ms]
Figure 2.5: A harmonic voltage waveform
The harmonic currents can cause excess heating in supply transformers and capacitor
banks, interference with nearby telecommunication lines, and harmonic voltage
distortions [12]. Harmonic voltage distortions cause electronic equipment to
overheat, malfunction or drop out. The equipment lifespan is shortened due to the
Inter-harmonics:
Inter-harmonics are periodic waveform distortions of voltage or current whose
frequency components are not at integer multiples of the fundamental power signal.
They can appear as a discrete frequency or as a wide band spectrum.
The main sources of inter-harmonics are induction motors, static frequency
converter, cycloconverter and arcing devices as well as DC transmission links across
separate power systems.
Notching:
Notching is a periodic voltage distortion caused by commutation between different
phases in power electronic devices. An example of notching that caused is by a
three-phase converter is shown in Figure 2.6. During the commutation between two
phases, the voltage is pulled as close as zero depending on the system impedances.
Voltage [VJ
200
100
0
-100
-200
0 20 40 60 80
Time [ms]
Figure 2.6: Notching caused by a three-phase converter
Notching can be characterised by harmonic spectrum as it occurred in a periodic
manner. However, notching can produce very high frequency components that may
The notches can sometime produce the voltage waveform sufficiently close to zero
and cause errors in instruments and systems that rely on zero crossing.
Noise:
Noise is defined as a broadband distortion signal with spectral content less than 200
kHz. Basically, any unwanted distortion of the power signal that is not classified as
harmonics or transients distortion is referred as noise.
Many power electronic devices are sources of noises. They are control circuits,
arcing equipment, load with solid-state rectifiers and switching power supplies.
Electronics devices such as microprocessors and programmable controllers are most
affected by noise.
2.3.5 Voltage Fluctuation
Voltage fluctuations are distortion of voltage envelopes in a continuous manner. The
variations of voltage envelope are in the range of 0.9 to 1.1 pu and produce the
phenomenon known as flicker. Flickers are the effects of the voltage variations on
lamps as perceived by the human eye (i.e. fluctuation frequencies < 25 Hz). Figure
2.7 shows an example of voltage flicker.
As the terms voltage fluctuation and voltage flicker are interchangable in most
standards, we will use the two terms with no distinction. One of the most common
causes of voltage fluctuation on power system is arc furnace.
'•
'