This is a repository copy of
New Lateral Force Distribution for Seismic Design of
Structures
.
White Rose Research Online URL for this paper:
http://eprints.whiterose.ac.uk/86383/
Version: Accepted Version
Article:
Hajirasouliha, I. and Moghaddam, H. (2009) New Lateral Force Distribution for Seismic
Design of Structures. Journal of Structural Engineering, 135 (8). 906 - 915. ISSN
0733-9445
https://doi.org/10.1061/(ASCE)0733-9445(2009)135:8(906)
[email protected] https://eprints.whiterose.ac.uk/ Reuse
Unless indicated otherwise, fulltext items are protected by copyright with all rights reserved. The copyright exception in section 29 of the Copyright, Designs and Patents Act 1988 allows the making of a single copy solely for the purpose of non-commercial research or private study within the limits of fair dealing. The publisher or other rights-holder may allow further reproduction and re-use of this version - refer to the White Rose Research Online record for this item. Where records identify the publisher as the copyright holder, users can verify any specific terms of use on the publisher’s website.
Takedown
If you consider content in White Rose Research Online to be in breach of UK law, please notify us by
Hajirasouliha I & Moghaddam HA (2009) New lateral force distribution for seismic design of structures.
Journal of Structural Engineering ASCE, 135(8), 906-915.
NEW LATERAL FORCE DISTRIBUTION FOR SEISMIC
DESIGN OF STRUCTURES
Iman Hajirasouliha
1; Hassan Moghaddam
2Abstract:
In the conventional seismic design methods, height wise distribution of equivalent seismicloads seems to be related implicitly on the elastic vibration modes. Therefore, the employment of such a load pattern does not guarantee the optimum use of materials in the nonlinear range of behavior. Here a method based on the concept of uniform distribution of deformation is implemented in optimization of the dynamic response of structures subjected to seismic excitation. In this approach, the structural properties are modified so that inefficient material is gradually shifted from strong to weak areas of a structure. It is shown that the seismic performance of such a structure is better than those designed conventionally. By conducting this algorithm on shear-building models with various dynamic characteristics, the effects of fundamental period, target ductility demand, number of stories, damping ratio, post-yield behavior and seismic excitations on optimum distribution pattern are investigated. Based on the results, a more adequate load pattern is proposed for seismic design of building structures that is a function of fundamental period of the structure and the target ductility demand.
CE Database keywords: Dynamic analysis; Ductility; Optimization; Seismic design; Nonlinear analysis
1
Post-Doctoral Researcher, Department of Civil & Structural Engineering, The University of Sheffield, Sheffield,
UK, e-mail: [email protected]
2
Professor, Department of Civil Engineering, Sharif University of Technology, Tehran, Iran, P.O. Box:
11365-8639, e-mail: [email protected]
Introduction
Structural configuration plays an important role on the seismic behavior of structures. In recent earthquakes, structures with inappropriate distributions of strength and stiffness have performed poorly, and most of the observed collapses have been related to some extent to configuration problems or wrong conceptual design. Although design procedures have become more rigorous in their application, the basic force-based approach has not changed significantly since its inception in the early 1900s. Consequently, the seismic codes are generally regarding the seismic effects as lateral inertia forces. The height wise distribution of these static forces (and therefore, stiffness and strength) seems to be based implicitly on the elastic vibration modes (Green 1981; Hart 2000). As structures exceed their elastic limits in severe earthquakes, the use of inertia forces corresponding to elastic modes may not lead to the optimum distribution of structural properties. Lee and Goel (2001) analyzed a series of 2 to 20 story frame models subjected to various earthquake excitations. They showed that in general there is a discrepancy between the earthquake induced shear forces and the forces determined by assuming distribution patterns.
The consequences of using the code patterns on seismic performance have been extensively investigated (Anderson et al. 1991; Gilmore and Bertero 1993; Martinelli et al. 2000). Chopra (2001) evaluated the ductility demands of several shear-building models subjected to the El- Centro Earthquake of 1940. The relative story yield strength of these models was chosen in accordance with the distribution patterns of the earthquake forces specified in the Uniform Building Code (UBC). It was concluded that this distribution pattern does not lead to equal ductility demand in all stories, and that in most cases the ductility demand in the first story is the largest of all stories. Takewaki (1996, 1997) proposed a method to find a strength (and stiffness) distribution pattern to receive a uniform ductility distribution within the height of structure under a given set of earthquakes. However, the final ductility demand in his proposed method is usually less than the ductility capacity of each story. Therefore, the proposed strength distribution may not be optimum.
relatively smaller maximum ductility demand can be obtained from other patterns. These findings have been confirmed by further investigations (Moghaddam and Hajirasouliha 2004; Moghaddam et al. 2005; Moghaddam and Mohammadi 2006), and led to the development of a new concept to optimize the distribution pattern for seismic performance. Moghaddam and Hajirasouliha (2006) proposed an effective optimization algorithm based on the concept of uniform distribution of deformation to determine optimum loading patterns according to different dynamic characteristics of structure and earthquake ground motion. In the present paper, by conducting this algorithm on shear-building models with various dynamic characteristics subjected to 20 earthquake ground motions, the effects of fundamental period, target ductility demand, number of stories, damping ratio, post-yield behavior and seismic excitations on optimum distribution pattern are investigated. Based on the results of this study, a more adequate load pattern is proposed for seismic design of building structures that is a function of fundamental period of the structure and the target ductility demand. It is shown that using the proposed load pattern could result in a reduction of ductility demands and a more uniform distribution of deformations.
Modeling and Assumptions
The modeling of engineering structures usually involves a great deal of approximation. Among the wide diversity of structural models that are used to estimate the non-linear seismic response of building frames, the shear-beam is the one most frequently adopted. In spite of some drawbacks, it is widely used to study the seismic response of multi-story buildings because of simplicity and low computer time consumption, thus permitting the performance of a wide range of parametric studies (Diaz et al., 1994). Lai et al. (1992) have investigated the reliability and accuracy of such shear-beam models. All parameters required to define a shear-building model corresponding to the original full-frame model could be determined by performing a pushover analysis. The corresponding shear building model has the capability to consider the higher mode effects for the first few effective modes.
possibilities. In the shear-building models, each floor is assumed as a lumped mass that is connected by perfect elastic-plastic springs which only have shear deformations when subjected to lateral forces as shown in Fig. 1. The total mass of the structure is distributed uniformly over its height and the Rayleigh damping model with a constant damping ratio of 0.05 is assigned to the first mode and to the mode at which the cumulative mass participation exceeds 95%. In all MDOF (Multi Degree of Freedom) models, lateral stiffness is assumed as proportional to shear strength at each story, which is obtained in accordance with the selected lateral load pattern. In this study, the maximum story drift within the structure was used to determine the ductility ratio for damage assessment.
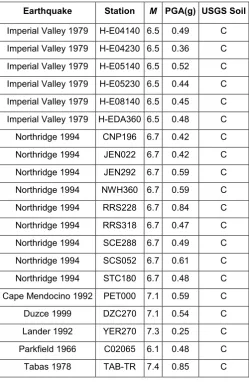
Twenty selected strong ground motion records are used for input excitation as listed in Table 1. All of these excitations correspond to the sites of soil profiles similar to the SD type of UBC-97 and are
recorded in a low to moderate distance from the epicenter (less than 45 km) with rather high local magnitudes (i.e., M>6). Due to the high intensities demonstrated in the records, they are used directly without being normalized.
The above-mentioned models are, then, subjected to the seismic excitations and non-linear dynamic analyses are conducted utilizing the computer program DRAIN-2DX (Prakash et al. 1992). For each earthquake excitation, the dynamic response of models with various fundamental periods and target ductility demands is calculated.
Lateral Loading Patterns
In most seismic building codes (Uniform Building Code 1997; NEHRP Recommended Provisions 1994; ATC-3-06 Report 1978; ANSI-ASCE 7-95 1996), the height wise distribution of lateral forces is to be determined from the following typical relationship:
.
1
V
h w
h w F
n
j k j j
k i i
i = ⋅
∑
=Where wi and hi are the weight and height of the i
th
floor above the base, respectively; n is the number of stories; and k is the power that differs from one seismic code to another. In some provisions such as NEHRP-94 and ANSI/ASCE 7-95, k increases from 1 to 2 as period varies from 0.5 to 2.5 second. However, in some codes such as UBC-97, the force at the top floor (or roof) computed from Equation (1) is increased by adding an additional force Ft=0.07TV for a fundamental period T of greater than 0.7 second. In such a case, the base shear V in Equation (1) is replaced by (V-Ft).
Moghaddam and Mohammadi (2006) introduced an “optimum” loading pattern as a function of the period of the structure and target ductility. This loading pattern is a rectangular pattern accompanied
by a concentrated force λTV at the top floor, where λ is a coefficient that depends on the fundamental
period, T, and the target ductility, µt. Based on the nonlinear dynamic analyses on shear-building models subjected to twenty-one earthquake ground motions; the following expression is suggested for λ (Moghaddam and Mohammadi 2006):
T
e
tt
)
03
.
0
6
.
0
(
).
04
.
0
9
.
0
(
µ
µ
λ
=
−
−
+
(2)In the present study, the adequacy of above mentioned loading patterns is investigated.
Concept of Uniform Distribution of Deformation
concluded that a status of uniform deformation is a direct consequence of the optimum use of material. This is considered as the concept of uniform distribution of deformation, (Moghaddam and Hajirasouliha 2004; Hajirasouliha 2004), and is the basis of the optimization method presented in this paper. The concept of uniform deformation demand as an optimization technique is not new for seismic design and it is generally endeavored to induce a status of uniform deformation throughout the structure to obtain an optimum design as in Takewaki (1996, 1997) and Gantes et al. (2000). However, in spite of those who assume the concept of uniform deformation as a performance objective, the authors are using it as a means for obtaining an optimum design.
Optimum Distribution of Design Seismic Forces
In structural optimization, an objective function should be expressed in terms of the design variables. Assuming that the cost of a member is proportional to its material weight, the least-cost design can be interpreted as the least-weight design of the structure. For the shear building models, any decrease of material is normally accompanied by a decrease in story strength, and therefore the cost objective function f to be minimized can be formulated as:
Minimize:
∑
= = n
i i
S x
f
1
)
( (3)
Where x is the design variable vector; Si is the shear strength of the ith floor and n is the number of stories. For this study, the design variables are taken to be the strength of the stories and an identical distribution pattern is assumed for both strength and stiffness.
Recent design guidelines, such as FEMA 356 and SEAOC Vision 2000, place limits on acceptable values of response parameters, implying that exceeding of these acceptable values represent violation of a performance objective. The ductility ratio has been widely used as the criterion for assessing seismic behavior for the shear building models (Chopra 2001). Therefore, here the design variables are chosen to satisfy design constraints as follows:
Where µi and µt are maximum ductility ratio at ith story and target ductility ratio, respectively. The
concept of uniform distribution of deformation can be employed for evaluation of optimum distribution of structural properties for a shear building model with fundamental period of T and target ductility ratio
of µt. To accomplish this, an iterative optimization procedure has been proposed by Hajirasouliha
(2004) and Moghaddam and Hajirasouliha (2006). In this approach, the structural properties are modified so that inefficient material is gradually shifted from strong to weak areas of a structure. This process is continued until a state of uniform deformation is achieved. At this stage, the strength distribution pattern is considered as practically optimum. The optimization algorithm is addressed extensively in Moghaddam and Hajirasouliha (2006), and it is briefly summarized in the following:
1. Arbitrarily initial pattern is assumed for height wise distribution of strength and stiffness. 2. The stiffness pattern is scaled such that the structure has a fundamental period of T.
3. The structure is subjected to the design excitation, and the maximum story ductility is calculated, and compared with the target value. Consequently, the strength is scaled (without changing the primary pattern) until the maximum deformation demand reaches the target value. This pattern is regarded as the first feasible design.
4. The COV (coefficient of variation) of story ductility distribution within the structure is calculated and the procedure continues until COV decreases down to a prescribed level.
5. Stories in which the ductility demand is less than the target values are identified and weakened by reducing strength and stiffness. To obtain convergence in numerical calculations, the following equation is used in the present study (Hajirasouliha, 2004):
α
µ
µ
=
+
t i m i m
i
S
S
]
[
]
[
1 (5)Where [Si]m is the shear strength of the ith floor at mth iteration and α is the convergence
parameter ranging from 0 to 1. This is addressed in the next section that for shear building models, an
COV becomes small enough, and a status of rather uniform ductility demand prevails. The final pattern is considered as practically optimum. Early studies have shown that there is generally a unique optimum distribution of structural properties, which is independent of the seismic load pattern used for initial design (Moghaddam and Hajirasouliha 2006).
The proposed method has been conducted on a 10-story shear building with fundamental period of 1 sec and target ductility demand of 4 subjected to the Northridge earthquake of 1994 (CNP196).
Fig. 2 illustrates the variation of COV and total strength from UBC-97 designed model toward the final answer. Fig. 2 shows the efficiency of the proposed method that resulted in reduction of total strength by 22% in only three steps. All solutions shown in this figure are acceptable designs with maximum story ductility of 4. Therefore, reduction of total strength in each step indicates that material capacity is more exploited and the structure is moving toward the optimum design. It is also shown in Fig. 2 that decreasing the COV is always accompanied by reduction of total strength and the proposed method has the capability of converging to the optimum pattern without any oscillation.
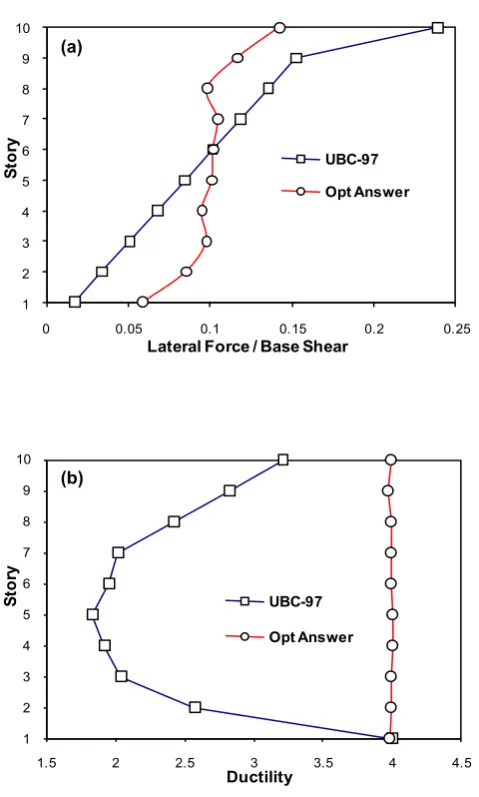
As the strength at each floor is obtained from the corresponding story shear force, for shear building models, the final height wise distribution of strength can be converted to the height wise distribution of lateral forces. Such pattern may be regarded as the optimum pattern of seismic forces for the given earthquake. The lateral force distribution and story ductility pattern of UBC-97 and optimum designed models are compared in Fig. 3. The results indicate that to improve the performance under this specific earthquake, the above mentioned model should be designed based on an equivalent lateral load pattern relatively different from the suggested conventional code patterns, e.g. that of UBC-97 guideline. However, this optimum load pattern is not adequate for other cases and it depends on the characteristics of the structure and seismic excitation. The effects of different parameters on the optimum distribution pattern are addressed next.
Effect of Convergence Parameter
In order to study the effect of convergence parameter, α, the previous example has been solved
for different values of α. Fig. 4 illustrates how the total strength varies as we move from the starting
without any fluctuation. However, when α exceeds 0.3, the method is not stable and the problem does
not converge to the optimum solution. Fig. 4 indicates that an α value of 0.2 results in the best
convergence for the design problem discussed herein. The convergence parameter α plays an important role in the convergence of the problem, and it is necessary to choose an appropriate value
of α for each specific case. Numerous analyses carried out in the present study indicate that, for shear
building models, an acceptable convergence is usually obtained by using α values of 0.1 to 0.2.
Effect of Seismic Excitation
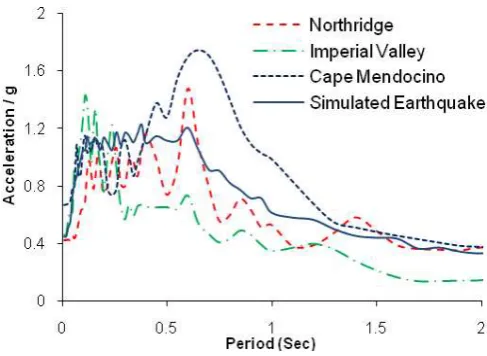
To investigate whether the efficiency of the proposed method is dependent on the selected seismic excitation, the following seismic records are also applied to the foregoing 10-story shear building model: (1) The 1994 Northridge earthquake CNP196 component with a PGA (Peak Ground Acceleration) of 0.42g, (2) The 1979 Imperial Valley earthquake H-E08140 component with a PGA of 0.45g, (3) The 1992 Cape Mendocino earthquake PET090 component with a PGA of 0.66g, and (4) A synthetic earthquake record generated to have a target spectrum close to that of the UBC-97 code with a PGA of 0.44g. All of these excitations correspond to the sites of soil profiles similar to the SD type of UBC. Acceleration response spectra of these records are illustrated in Fig. 5.
The optimum strength-distribution patterns corresponding to these excitations are determined. In
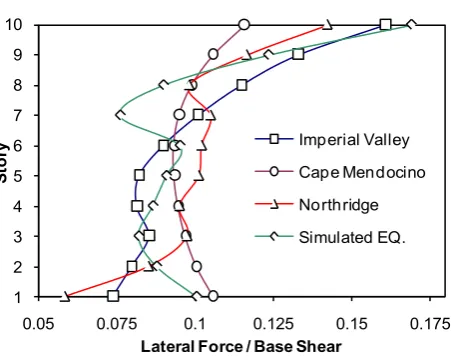
Fig. 6, total strength demand for optimum structures are compared with does designed according to seismic load pattern suggested by the UBC-97. The figure indicates that for the same ductility demand, the optimum design requires less strength as compared with the conventional design. The optimum lateral load patterns correspond to each case are presented in Fig. 7. It is shown in this figure that every seismic excitation has a unique optimum distribution of structural properties. The optimum pattern depends on the earthquake and it varies from one earthquake to another. However,
Fig. 7 shows that there is not a big discrepancy between different optimum load patterns correspond to the seismic excitations with similar soil profiles.
specific fundamental period and target ductility demand, optimum load pattern is completely independent of the seismic excitation scale factor.
Effect of Target Ductility Demand
In order to study the effect of target ductility demand on optimum distribution pattern, 10 story shear- building models with fundamental period of 1 sec and target ductility of 1.5, 2, 4 and 8 have been considered. Optimum lateral load pattern was derived for each model subjected to Northridge 1994 (CNP196) event. Comparing the results, the effect of target ductility demand on optimum distribution of seismic loads is illustrated in Fig. 9. The seismic load patterns suggested by most seismic codes do not depend on the ductility; however the results of this study indicate that optimum distribution is highly dependent on target ductility demand of the structure. Preliminary studies carried out by the authors (Moghaddam and Hajirasouliha 2006) showed that, in general, increasing the ductility demand results in decreasing the loads at the top stories and increasing the loads at the lower stories.
Effect of Fundamental Period
To investigate the effect of fundamental period on the optimum distribution pattern, 10 story shear-building models with target ductility demand of 4 and fundamental periods of 0.2, 0.6, 1 and 2 sec have been assumed. For each case, the optimum lateral load pattern was derived for Northridge 1994 (CNP196) event. The comparison of the optimum lateral load pattern for each case is presented in Fig. 10. As shown in this figure, optimum distribution of seismic loads is a function of fundamental period of the structure. Previous studies (Moghaddam and Hajirasouliha 2006) show that increasing the fundamental period is usually accompanied by increasing the loads at the top stories caused by the higher mode effects.
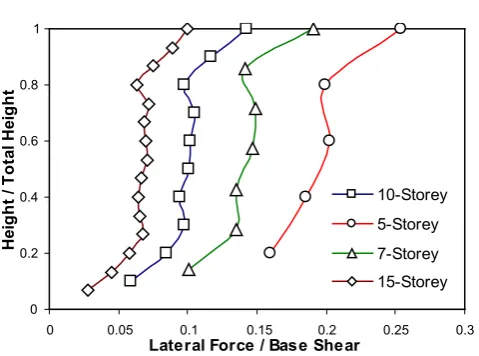
Effect of Number of Stories
patterns have a similar trend in shear building models with different number of stories. Hence, for a specific fundamental period and target ductility demand, optimum load pattern can be considered independent of number of stories.
Effect of Damping Ratio
The effect of damping ratio on optimum load distribution pattern is illustrated in Fig. 12 for a 10 story shear-building model with target ductility demand of 4 and fundamental period of 1 sec; subjected to Northridge 1994 (CNP196) event. As shown in this figure, earthquake forces correspond to the top floors decrease with an increase in damping ratio. The results were expectable, since increasing the damping ratio is usually accompanied by decreasing the higher mode effects which mainly affect loads at the top stories. It can be noted from Fig. 12 that optimum load pattern is rather insensitive to the variation of damping ratios greater than 3%. Hence, for practical purposes, optimum load pattern can be considered independent of the damping ratio.
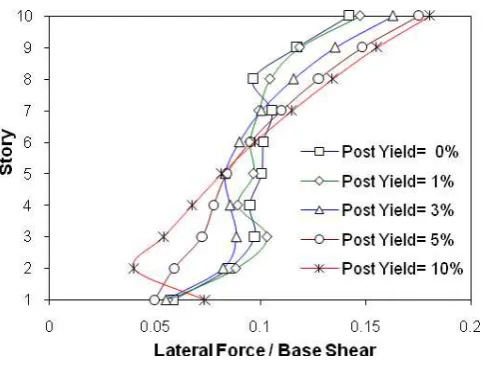
Effect of Post-Yield Behavior
The comparison of the optimum lateral load pattern for different post-yield behavior is presented in Fig. 13. As shown in this figure, the optimum distribution pattern is to some extend dependent to the secondary slope of post-yield response. However, it is shown that there is not a big discrepancy between different optimum load-patterns correspond to the post-yield slopes less than 5%. Therefore, for most practical cases, the effect of post-yield behavior on optimum load pattern could be ignored.
More Adequate Loading Pattern
optimum load pattern is capable to reduce the maximum ductility experienced by the model after similar ground motions. It can be concluded that for design proposes, the design earthquakes must be classified for each structural performance category and then more adequate loading pattern must be found by averaging optimum patterns corresponding to every one of the earthquakes in each group. To verify this assumption, 20 strong ground motion records with the similar characteristics, as listed in
Table 1, were selected. Time history analyses have been performed for all earthquakes and the corresponding optimum pattern has been found for shear-building models with different fundamental periods and target ductility demands. Consequently, 3200 optimum load patterns have been determined at this stage. For each fundamental period and ductility demand a specific matching load distribution has been obtained by averaging the results for all earthquakes. These average distribution patterns were used to design the given shear building models. Then the response of the designed models to each of the 20 earthquakes was calculated. As an example, the ratios of required to
optimum structural weight for 10 story shear buildings with T=1 Sec and µt=4 designed with the
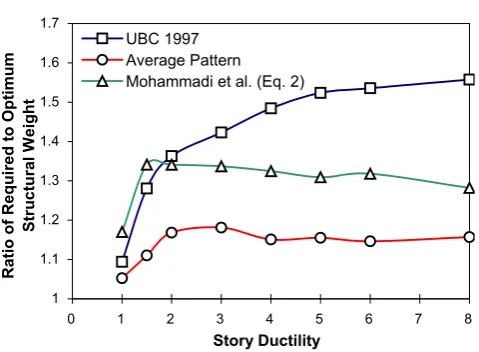
UBC-97 load pattern and average of optimum load patterns are illustrated in Fig. 14. It is shown that in this case the structure designed according to the average of optimum load patterns always requires less structural weight compare to the UBC 97 designed model. It means that the designed model with optimum load pattern is capable to reduce the maximum ductility experienced by the model after similar ground motions. Similar results have been obtained in this work for other period and target ductility demands. In Fig. 15, the ratio of required structural weight to the optimum weight are compared for the models designed with the UBC-97 load pattern, average of optimum load patterns, and Moghaddam and Mohammadi (2006) proposed load pattern. This figure has been obtained by averaging the responses of shear-building models with fundamental period of 0.1 sec to 3 sec, subjected to 20 earthquake ground motions. Fig. 15 indicates that in the elastic range of vibration
(µt=1), the total structural weight required for the models designed according to the UBC-97 load
pattern are in average 9% above the optimum value. Hence, it can be concluded that for practical purposes, using the conventional loading patterns could be satisfying within the linear range of vibrations.
is illustrated in Fig. 15 that for conventionally designed structures with high levels of ductility demand, the required structural weight could be more than 50% above the optimum weight. It is shown that using Moghaddam and Mohammadi (2006) proposed load pattern, in average, results better than
code type loading pattern for buildings in highly inelastic ranges (i.e. t
≥
3
), however; it loses itsefficiency for the buildings behave almost linearly (i.e. t
≤
2
).It is illustrated in Fig. 15, having the same period and ductility demand, structures designed according to the average of optimum load patterns require less structural weight compare to those designed conventionally. The effectiveness of using average of optimum load patterns to reduce required structural weight is demonstrated for both elastic and inelastic systems; however its efficiency is more obvious for the models with high ductility demand. Such a load pattern is designated as ‘more adequate load pattern’. Similar to optimum load patterns, more adequate loading pattern is a function of both the period of the structure and the target ductility demand.
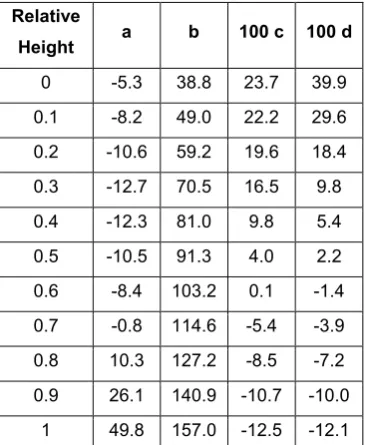
While more adequate load patterns could be very different in their shape, it is possible to establish some general rules. Moghaddam and Hajirasouliha (2006) showed that more adequate load patterns can be illustrated in four categories including triangular pattern, trapezoid pattern, parabolic pattern and hyperbolic pattern. Despite obvious variation between the adequate load patterns proposed for different conditions, this study indicate that for each story there is generally a specific relationship between the optimum load pattern, fundamental period of the structure, and target ductility demand. Based on the results of this study, the following equation has been suggested:
) (
)
(aT b ciT di
Fi = i + i
µ
t + (6)Where Fi is the optimum load component at the ith story; T is the fundamental period of the
structure; µt is target ductility demand; ai, bi, ci, and di are constant coefficients at ith story. These coefficients could be obtained at each level of the structure by interpolating the values given in Table 2. Using Equation (6), the optimum load pattern is determined by calculating optimum load components at the level of all stories.
agreement between Equation (6) and analytical results is excellent and this equation has good capability to demonstrate optimum load patterns for very different conditions. The constant coefficients of Equation (6) can be determined for any set of earthquakes representing a design spectrum.
More adequate load pattern introduced in this paper is based on the shear building models subjected to 20 selected earthquakes, as listed in Table 1. However, discussed observations are fundamental and similar conclusions have been obtained by further analyses on different models and ground motions (Hajirasouliha, 2004). Prior studies have shown that optimum load pattern determined by using a shear building model, can be efficiently applied for seismic resistant design of concentrically braced frames (Moghaddam et al. 2005). However, the proposed load pattern cannot be directly applied to some structural systems such as shear walls, as they behave substantially different from shear-building type of structures. More adequate loading pattern proposed in this paper should prove useful in the conceptual design phase, and in improving basic understanding of seismic behavior of building structures.
Conclusions
1. A method based on the concept of uniform distribution of deformation is implemented in optimization of dynamic response of structures subjected to seismic excitation. It is shown that structures designed according to the optimum load pattern generally have better seismic performance compare to those designed by conventional methods.
2. It is shown that that optimum load pattern is highly dependent to fundamental period of the structure, target ductility demand and seismic excitation characteristics. However, for practical purposes, optimum pattern can be considered independent of ground motion intensity, number of stories, post-yield slope and damping ratio.
optimum load patterns have relatively less structural weight in comparison with those designed conventionally.
4. A more adequate load pattern is introduced for seismic design of building structures that is a function of fundamental period of the structure and the target ductility demand. It is shown that the proposed loading pattern is superior to the conventional loading patterns suggested by most seismic codes.
References
Anderson, J. C., Miranda, E., Bertero, V. V., and Kajima Research Team (1991). “Evaluation of the seismic performance of a thirty-story RC building.” UCB/EERC-91/16, Berkeley: Earthquake Engineering Research Centre, University of California.
ASCE, (1996). “Minimum Design Loads for Building and other Structures”, ANSI/ASCE 7-95, American Society of Civil Engineering, ASCE, New York, NY, USA.
ATC, (1978). “Tentative provisions for the development of seismic regulations for buildings”, ATC-3-06, Applied Technology Council, ATC, Palo Alto, CA, USA.
Chopra, A. K., (2001). “Dynamics of structures: theory and applications to earthquake engineering.” 2nd Edition, Prentice Hall Inc., London.
Diaz, O., Mendoza, E., and Esteva, L. (1994). “Seismic ductility demands predicted by alternate models of building frames.” Earthquake Spectra, 10(3), 465-487.
FEMA 356, (2000). “Prestandard and commentary for the seismic rehabilitation of buildings”, Washington, D.C: Federal Emergency Management Agency.
Behavior of Steel Structures in Seismic Areas, Mazzolani F and Tremblay R (eds), Balkema, Rotterdam, 585–592.
Gilmore, T. A., Bertero, V. V. (1993). “Seismic performance of a 30-story building located on soft soil and designed according to UBC 1991.” UCB/EERC-93/04, Berkeley: Earthquake Engineering Research Center, University of California.
Green, N. B. (1981). “Earthquake resistant building design and construction.” 2nd Edition, Van Nostrand Reinhold Company, New York.
Hajirasouliha, I., (2004). “Optimum strength distribution for seismic design of structures.” D.Phil. thesis, Sharif University of Technology, Tehran, Iran.
Hart, G. C. (2000). “Earthquake forces for the lateral force code.” The Structural Design of Tall Buildings, 9(10), 49-64.
Lai, M., Li, Y., and Zhang, Ch. (1992). “Analysis method of multi-rigid-body model for earthquake responses of shear-type structure.” WCEE 10th Conference, Madrid, Spain, 4013-4018.
Lee, S. S., Goel, S. C. (2001). “Performance based seismic design of structures using target drift and yield mechanism.” U.S Japan Seminar on Advanced Stability and Seismicity Concept for Performance Based Design of Steel and Composite Structures, Kyoto, Japan.
Martinelli, L., Perotti, F., Bozzi, A. (2000). “Seismic design and response of a 14-story concentrically braced steel building.” In: Behavior of Steel Structures in Seismic Areas. Mazzolani F and Tremblay R (eds), Balkema, Rotterdam, 327-335.
Moghaddam, H. (1995). “Earthquake Engineering.” RTRC Publications, 1st Edition, Tehran, Iran (in Persian).
Moghaddam, H., Hajirasouliha, I. (2006). “Toward more rational criteria for determination of design earthquake forces.” International Journal of Solids and Structures, 43 (9), 2631-2645.
Moghaddam, H., Hajirasouliha, I., and Doostan, A. (2005). “Optimum seismic design of concentrically braced steel frames: concepts and design procedures” Journal of Constructional Steel Research, 61 (2), 151-166.
Moghaddam, H., Mohammadi, R. K. (2006). “More efficient seismic loading for multidegrees of freedom structures.” Journal of Structural Engineering, ASCE, 132 (10), 1673-1677.
NEHRP, (1994). “Recommended Provisions for the Development of Seismic Regulation for New Buildings.” Building Seismic Safety Council, Washington, DC.
Prakash, V., Powell, G. H., and Filippou. F. C. (1992). “DRAIN-2DX: base program user guide.”
UCB/SEMM- 92/29. Earthquake Engineering Research Centre, University of California, Berkeley.
Riddell, R., Hidalgo, P., and Cruz, E. (1989). “Response modification factors for earthquake resistant design of short period buildings”, Earthquake Spectra, 5(3), 571-590.
SEAOC Vision 2000, (1995). ”Performance based seismic engineering for buildings.” Structural Engineers Association of California, Sacramento, CA.
Takewaki, I. (1996). “Design-oriented approximate bound of inelastic responses of a structure under seismic loading.” Computers and Structures, 61 (3), 431-440.
Takewaki, I. (1997). “Design-oriented ductility bound of a plane frame under seismic loading.” Journal of Vibration and Control, 3 (4), 411-434.
Uniform Building Code, UBC. (1997). International Conference of Building Officials, vol. 2.
Notations
The following symbols are used in this paper:
α = Convergence parameter in optimization algorithm
λ= A coefficient to obtain lateral load distribution pattern
µ= Ductility factor
µi = Maximum ductility ratio at ith story
µt = Target ductility ratio
ai= Constant coefficient at i
th
story to obtain more adequate loading pattern
bi= Constant coefficient at i
th
story to obtain more adequate loading pattern
ci= Constant coefficient at i
th
story to obtain more adequate loading pattern
di= Constant coefficient at i
th
story to obtain more adequate loading pattern
Fi= Lateral Force at i
th
story
Ft= Top Lateral force
hi = Height of ith story
k = Positive number as a power
M= Local magnitudes of a seismic excitation
n = Number of stories
si= Shear Strength of i
th
story
[si]m= Shear Strength of ith story at mth iteration
T = Fundamental period of the structure
V = Base Shear
wi = Weight of ith story
List of figure captions
Fig. 1. Typical shear building models
Fig. 2. Variation of COV of story ductility demands and total strength from UBC-97 designed model toward the
final answer, 10-story shear building with T=1 Sec and µt=4, Northridge 1994 (CNP196)
Fig. 3. Comparison of UBC-97 and optimum designed models (a): lateral force distribution, (b): Story ductility
pattern, 10-story shear building with T=1 Sec and µt=4, Northridge 1994 (CNP196)
Fig. 4. Variation of total strength for different values of convergence parameters, 10-story shear building with T=1
Sec and µt=4, Northridge 1994 (CNP196)
Fig. 5. Acceleration response spectra of Northridge earthquake (CNP196), Imperial Valley earthquake
(H-E08140), Cape Mendocino earthquake (PET090), and synthetic earthquake record
Fig. 6. Comparison of total strength demand for UBC-97 & Optimum distribution, 10 story shear building, T=1 Sec
and µt=4
Fig. 7. Optimum lateral force distribution for different earthquakes, 10 story shear building with T=1 Sec and µt=4
Fig. 8. Optimum lateral force distribution for different ground motion intensities, 10-story shear building with T=1
Sec and µt=4, Northridge 1994 (CNP196)
Fig. 9. Optimum lateral force distribution for different target ductility demands, 10 story shear building with T=1
Sec, Northridge 1994 (CNP196)
Fig. 10. Optimum lateral force distribution for different fundamental periods, 10 story shear building with µt=4,
Northridge 1994 (CNP196)
Fig. 11. Optimum lateral force distribution for different number of stories, 10 story shear building with T=1 Sec
Fig. 12. Optimum lateral force distribution for different damping ratios, 10-story shear building with T=1 Sec and
µt=4, Northridge 1994 (CNP196)
Fig. 13. Optimum lateral force distribution for different post-yield slope, 10 story shear building with T=1 Sec and
µt=4, Northridge 1994 (CNP196)
Fig. 14. The ratios of required to optimum structural weight for 10 story shear buildings with T=1 Sec and µt=4
designed with the UBC-97 load pattern and average of optimum load patterns
Fig. 15. The ratio of required to optimum structural weight for the models designed with the UBC-97 load pattern,
average of optimum load patterns, and Moghaddam and Mohammadi (2006) proposed load pattern, Average
of 20 earthquakes
Table 1. Strong ground motion characteristics
Earthquake Station M PGA(g) USGS Soil
Imperial Valley 1979 H-E04140 6.5 0.49 C
Imperial Valley 1979 H-E04230 6.5 0.36 C
Imperial Valley 1979 H-E05140 6.5 0.52 C
Imperial Valley 1979 H-E05230 6.5 0.44 C
Imperial Valley 1979 H-E08140 6.5 0.45 C
Imperial Valley 1979 H-EDA360 6.5 0.48 C
Northridge 1994 CNP196 6.7 0.42 C
Northridge 1994 JEN022 6.7 0.42 C
Northridge 1994 JEN292 6.7 0.59 C
Northridge 1994 NWH360 6.7 0.59 C
Northridge 1994 RRS228 6.7 0.84 C
Northridge 1994 RRS318 6.7 0.47 C
Northridge 1994 SCE288 6.7 0.49 C
Northridge 1994 SCS052 6.7 0.61 C
Northridge 1994 STC180 6.7 0.48 C
Cape Mendocino 1992 PET000 7.1 0.59 C
Duzce 1999 DZC270 7.1 0.54 C
Lander 1992 YER270 7.3 0.25 C
Parkfield 1966 C02065 6.1 0.48 C
Table 2. Constant coefficients of Equation (6) as a function of relative height
Relative
Height a b 100 c 100 d
0 -5.3 38.8 23.7 39.9
0.1 -8.2 49.0 22.2 29.6
0.2 -10.6 59.2 19.6 18.4
0.3 -12.7 70.5 16.5 9.8
0.4 -12.3 81.0 9.8 5.4
0.5 -10.5 91.3 4.0 2.2
0.6 -8.4 103.2 0.1 -1.4
0.7 -0.8 114.6 -5.4 -3.9
0.8 10.3 127.2 -8.5 -7.2
0.9 26.1 140.9 -10.7 -10.0
Fig. 1. Typical shear building models
0 200 400 600 800 1000 1200
1 2 3 4 5 6 7 8 9 10
Step
1
0
0
0
C
o
v
&
T
o
ta
l
S
tr
e
n
g
th
(
k
N
)
1000 COV
Total Strength
Fig. 2. Variation of COV of story ductility demands and total strength from UBC-97 designed model toward the
[image:25.595.179.419.505.675.2]1 2 3 4 5 6 7 8 9 10
0 0.05 0.1 0.15 0.2 0.25
St
o
ry
Lateral Force / Base Shear
UBC-97
Opt Answer
1 2 3 4 5 6 7 8 9 10
1.5 2 2.5 3 3.5 4 4.5
St
o
ry
Ductility
UBC-97
[image:26.595.177.417.158.557.2]Opt Answer
Fig. 3. Comparison of UBC-97 and optimum designed models (a): lateral force distribution, (b): Story ductility
pattern, 10-story shear building with T=1 Sec and µt=4, Northridge 1994 (CNP196)
(a)
800 900 1000
1100 1200 1300 1400 1500 1600 1700 1800
1 3 5 7 9 11 13 15 17 19 21 23 25 27 29 Step
T
o
ta
l
S
tr
e
n
g
th
(
k
N
)
[image:27.595.180.419.121.289.2]α= 0.05 α= 0.1 α= 0.2 α= 0.3 α= 0.5
Fig. 4. Variation of total strength for different values of convergence parameters, 10-story shear building with T=1
Sec and µt=4, Northridge 1994 (CNP196)
Fig. 5. Acceleration response spectra of Northridge earthquake (CNP196), Imperial Valley earthquake
[image:27.595.174.418.474.652.2]0 500 1000 1500 2000 2500 Northridge Imperial Valley Cape Mendocino Simulated EQ. T o ta l S tr e n g th D e m a n d (k N
[image:28.595.180.422.110.280.2]) Optimum Distribution UBC Distribution
Fig. 6. Comparison of total strength demand for UBC-97 & Optimum distribution, 10 story shear building, T=1 Sec
and µt=4
1 2 3 4 5 6 7 8 9 10
0.05 0.075 0.1 0.125 0.15 0.175
St
o
ry
Lateral Force / Base Shear
Imperial Valley
Cape Mendocino
Northridge
Simulated EQ.
[image:28.595.182.408.456.636.2]1 2 3 4 5 6 7 8 9 10
0 0.05 0.1 0.15
St
o
ry
Lateral Force / Base Shear Scale Factor= 0.5
Scale Factor= 1
[image:29.595.178.415.104.281.2]Scale Factor= 1.5 Scale Factor= 2 Scale Factor= 3
Fig. 8. Optimum lateral force distribution for different ground motion intensities, 10-story shear building with T=1
Sec and µt=4, Northridge 1994 (CNP196)
1 2 3 4 5 6 7 8 9 10
0 0.05 0.1 0.15 0.2
Sto
r
y
Lateral Force / Base Shear µ= 1.5
µ= 2
µ= 4
µ= 8
Fig. 9. Optimum lateral force distribution for different target ductility demands, 10 story shear building with T=1
[image:29.595.182.416.507.674.2]1 2 3 4 5 6 7 8 9 10
0.025 0.05 0.075 0.1 0.125 0.15 0.175
St
o
ry
Lateral Force / Base Shear T= 0.2
T= 0.6
T= 1
T= 2
Fig. 10. Optimum lateral force distribution for different fundamental periods, 10 story shear building with µt=4,
Northridge 1994 (CNP196)
0 0.2 0.4 0.6 0.8 1
0 0.05 0.1 0.15 0.2 0.25 0.3
Lateral Force / Base Shear
[image:30.595.180.414.91.265.2]H e ig h t / T o ta l H e ig h t 10-Storey 5-Storey 7-Storey 15-Storey
Fig. 11. Optimum lateral force distribution for different number of stories, 10 story shear building with T=1 Sec
[image:30.595.179.419.442.620.2]1 2 3 4 5 6 7 8 9 10
0 0.05 0.1 0.15 0.2 0.25
Lateral Force / Base Shear
St
o
re
y
ξ= 0 %
ξ= 3 %
ξ= 5 %
[image:31.595.180.422.107.277.2]ξ= 10 %
Fig. 12. Optimum lateral force distribution for different damping ratios, 10-story shear building with T=1 Sec and
µt=4, Northridge 1994 (CNP196)
Fig. 13. Optimum lateral force distribution for different post-yield slope, 10 story shear building with T=1 Sec and
µt=4, Northridge 1994 (CNP196)
S
to
[image:31.595.176.418.491.674.2]Fig. 14. The ratios of required to optimum structural weight for 10 story shear buildings with T=1 Sec and µt=4
designed with the UBC-97 load pattern and average of optimum load patterns
1 1.1 1.2 1.3 1.4 1.5 1.6 1.7
0 1 2 3 4 5 6 7 8
Story Ductility R a ti o o f R e q u ir e d to O p ti m u m S tr u c tu ra l W e ig h t UBC 1997 Average Pattern Mohammadi et al. (Eq. 2)
Fig. 15. The ratio of required to optimum structural weight for the models designed with the UBC-97 load pattern,
average of optimum load patterns, and Moghaddam and Mohammadi (2006) proposed load pattern, Average
[image:32.595.181.421.476.652.2]0 0.1 0.2 0.3 0.4 0.5 0.6 0.7 0.8 0.9 1
0.025 0.05 0.075 0.1 0.125 0.15 0.175 0.2 0.225
H e ig h t / T o ta l H e ig h t
Lateral Force / Base Shear
T=0.3, m=1 (Eq. 6)
T=0.3, m=1
T=0.4, m=3 (Eq. 6)
T=0.4, m=3
T=2.5, m=2 (Eq. 6)
T=2.5, m=2
T=2.5, m=8 (Eq. 6)
T=2.5, m=8
T=1.5, m=5 (Eq.6)
[image:33.595.78.515.111.287.2]T=1.5, m=5
Fig. 16. Correlation between Equation 6 and analytical results