Rochester Institute of Technology
RIT Scholar Works
Theses Thesis/Dissertation Collections
12-1-2016
Computational analysis in vivo p53 binding sites in
the context of chromatin and repeat regions
Feifei Bao
Follow this and additional works at:http://scholarworks.rit.edu/theses
This Thesis is brought to you for free and open access by the Thesis/Dissertation Collections at RIT Scholar Works. It has been accepted for inclusion in Theses by an authorized administrator of RIT Scholar Works. For more information, please [email protected].
Recommended Citation
Computational analysis in vivo p53 binding sites in the
context of chromatin and repeat regions
By
Feifei Bao
A thesis submitted in partial fulfillment of the requirements for the degree of
Master of Science in Bioinformatics at the Rochester Institute of Technology
R
·
I
·
T
Bioinformatics Program
Thomas H. Gosnell School of Life Sciences College of Science
Rochester Institute of Technology Rochester, NY
Committee Signatures
The undersigned state that Feifei Bao, a candidate for the Master of Science degree in Bioinformatics, has submitted her thesis and has satisfactorily defended it.
This completes the requirements for the Master of Science degree in Bioinformatics at Rochester Institute of Technology.
Feng Cui, Ph.D. Date Adviser
Gary R. Skuse, Ph.D. Date Committee Member
Table of Contents
LIST OF FIGURES ... IV
ACKNOWLEDGEMENTS ... V
ABSTRACT ... 6
INTRODUCTION ... 7
BIOLOGICAL BACKGROUND ... 7
DNABINDING PROTEIN -P53 ... 8
THE STRUCTURE OF P53 ... 9
THESIS GOALS ... 10
METHODS AND MATERIALS ... 11
COLLECTION OF P53BINDING SITES ... 11
CONCORDANCE BETWEEN P53BINDING SITES IDENTIFIED IN VITRO AND IN VIVO ... 12
DETECTION OF P53CORE BINDING SITES ... 12
DISTANCE DISTRIBUTION OF P53BINDING SITES ... 13
P53BINDING SITES RESIDING IN REPEATS ... 13
FUNCTIONAL ANNOTATION OF P53CHIPCLUSTERS ... 14
RESULTS ... 14
COLLECTION OF P53BINDING SITES AND LENGH-DISTRIBUTION ... 14
CONCORDANCE BETWEEN P53BINDING SITES IDENTIFIED IN VITRO AND IN VIVO ... 18
DETECTION OF P53CORE BINDING SITES ... 19
DISTANCE DISTRIBUTION OF P53BINDING SITES ... 20
P53BINDING SITES RESIDING IN REPEATS ... 21
FUNCTIONAL ANNOTATION OF P53CHIPCLUSTERS ... 25
DISCUSSION ... 30
CHROMATIN CONTEXT AND DISTRIBUTION ... 30
P53DISTRIBUTIONS IN REPETITIVE REGIONS IN NORMAL AND CANCER CHROMATIN ... 30
FUTURE WORK ... 31
CONCLUSIONS ... 31
REFERENCES ... 33
List of Figures
Figure 1. Nucleosomal DNA wraps around histones ... 7
Figure 2. Four p53 core domains bound to bent DNA. ... 9
Figure 3. Modeling of p53 tetramer bound to nucleosome DNA. ... 10
Figure 4. Length - frequency distributions of ChIP segments. ... 16
Figure 5. BBC3 (PUMA) gene in UCSC Genome Browser ... 18
Figure 6. Overlapping fragments between cancer clusters and normal clusters .. 20
Figure 7. Genomic distributions of pile-3+ binding sites (BSs) to TSSs ... 21
Figure 8. Pie charts of p53 clusters residing in repeat regions ... 23
Figure 9. Enriched pathways for p53 genes from DAVID ... 26
Acknowledgements
I would first like to thank my thesis advisor Prof. Feng Cui of the College of
Science at Rochester Institute of Technology for the support of my MS study and
research, for his patience, encouragement, enthusiasm and immense knowledge. It has
been an honor to work with him.
Besides my advisor, I would also like to thank the rest of my thesis committee
members: Prof. Gary R. Skuse and Prof. Gregory Babbitt for their interest in my work
and insightful comments.
In addition, I would like to thank my fellows: Nick, Tom, Julia, Denisse and
Anogna for their help in my study and research. We were working together and have
had a great time.
The most special thanks goes to my parents. They give me unconditional support
and love during my time here. Finally, there are my friends. We were not only able to
Abstract
The p53 tumor suppressor protein is involved in multiple central cellular
processes and human cancer occurrences. A research effort is proposed to collect the
majority of p53 ChIP fragments up to now and reveal the binding pattern of p53
binding sites. It demonstrates that the normal and cancer cell lines have significantly
different chromatin organizations around P53 binding sites. Based on the high
occurrences, the core binding sites can be collected to analyze gene expression
configurations. Depending on the accessibility of p53 sites and epigenetic marks in
the chromatin context, p53 binds to its target sites in repetitive regions. Finally, the
functional annotation analysis illustrates that the most enriched pathway of p53 ChIP
fragments is p53 signaling pathway and highly enriched clusters relating to apoptosis,
Introduction
Biological Background
The human genome contains approximately 3 billion base pairs of DNA
packaged into 23 chromosomes. Each cell has two copies of genetic information.
There are about 50 trillion cells, tens of thousands of individual proteins and genes, in
typical human body. The Central Dogma of Molecular Biology reveals the genetic
inheritance and specification: replication of DNA, transcription into mRNA and
translation into protein.
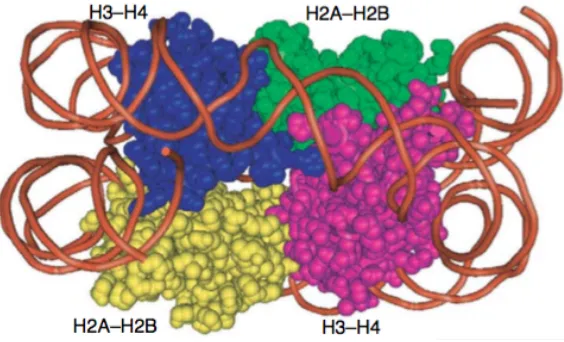
The large amount of genetic information is arranged into a structure called
chromatin. Chromatin is composed of a combination of DNA, histones and certain
types of RNA. The basic, repeated structure unit of chromatin is the nucleosome.
Histones are alkaline, positively charged proteins, which include 4 core histones,
namely H2A, H2B, H3, and H4. H2A and H2B residing in core domain keep from
organize to nucleosomes. H3 and H4 locating in the side of the structure bind to the
DNA to regulate chromatin formation [1]. H1 and H5 are the linker histones. They
bind with nucleosome core and linker DNA [2]. A strand of 145bp DNA wraps in 1.6
[image:8.595.166.448.545.716.2]turns around the core histones (Figure 1) [3].
Figure 1. Nucleosomal DNA wraps around histones
sites will be weakened, given the DNA sequence occluded by nucleosomes. Two
main factors have been identified to be able to regulate the function state of chromatin.
One is the methylated DNA and the other is modified histone protein [4]. While the
DNA methylation can be found in most CpGs area of the genome [5], the histone
modification occurs more widely within the amino-terminal histone tails relating with
various biological functions.
A protein should contact with histones or nucleosomal DNA to interact with a
nucleosome. The target sites cannot access protein successfully if its nucleosome is
wrapped tightly. Several researchers show that some specific proteins can bind to
DNA sequences directly (hereafter “nucleosome DNA-binding proteins”) in vitro and
in vivo, such as telomeric protein Rap1p [6], yeast chromatin-remodeling complexes
SWI/SNF, RSC [7] and so on. The modification of Nucleosome-Interacting Proteins
can influence the DNA binding to TFs.
DNA Binding Protein - P53
In this study, we focus on the best-known tumor suppressor protein p53, which
works as a sequence-specific transcription factor. P53 with a high-resolution crystal
structures plays an important role in various central cellular processes, such as the
maintenance of genetic stability, cell cycle control, transcription, DNA repair,
apoptosis and other responses [8]. In most cases of human cancers, p53 mutates is
functionally inactivated by signal-dependent modifications, since the central
conserved region of p53 is necessary and important for specific DNA binding [9].
When the cell is normal and unstressed, the short-lived p53 protein level can keep a
low turnover and latent state. However when p53 is activated due to some genotoxic
stresses like DNA damage, nucleotide depletion and hypoxia, p53 will accumulate
and work as a transcription factor. The activation can inhibit many gene expressions
and induce some responses like cell cycle arrest or apoptosis [10].
Kaeser and Lggo [11] proposed some models to explain why p53 causes cell
cycle arrest in some places and apoptosis in others. The reason is that p53 binds with
and binds to the promoters of apoptosis (Apo-sites) – inducing genes with a lower
affinity. The evidence is that some low-affinity mutants keep the ability to induce cell
cycle arrest.
The Structure of P53
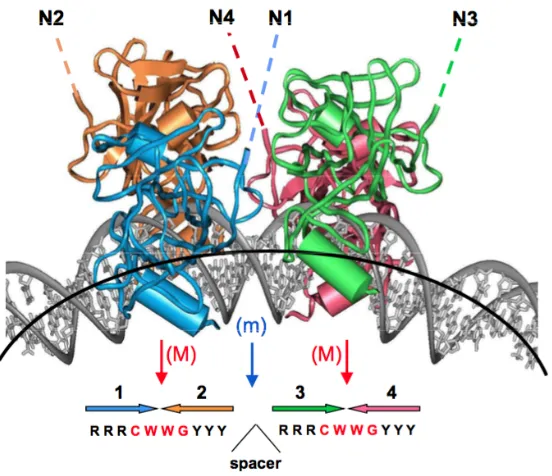
The DNA-binding protein P53 looks like a self-assembled tetramer [11]. It
contains two copies of a decamer motif "RRRCWWGYYY"(R=A, G; W=A, T; Y=C,
[image:10.595.194.470.304.542.2]T) separated by a variable spacer of 0 to 13 base pairs (Figure 2).
Figure 2. Four p53 core domains bound to bent DNA.
P53 has four molecules of DNA binding domain (p53DBD) [12]. More than 80%
missense mutations happen in p53DBD, which leads to DNA binding disrupture or
stability reduction [11]. These four p53 motifs are positioned on the external side of
the DNA loop and recognize their cognate sites in nucleosome DNA if the p53 sites
are exposed (Figure 2). P53DBD bends the DNA to improve the stability and
Figure 3. Modeling of p53 tetramer bound to nucleosome DNA.
Sahu and Wang [13] reported the idea that when the p53 binding sites are bent in
the same direction with DNA complexes in solution and in co-crystals, the sites have
high accessibility. However, if the direction of p53 binding sites in the core particle
are turned ~ 180 degrees, they become inaccessible. That means they are in the
opposite directions and statuses. Figure 3 shows that when the p53 binding sites are
exposed on the nucleosome surface, they are recognized by corresponding p53.
Therefore, the direction and position of the p53 binding sites determine whether or
not they can be contacted easily. When the p53 site is “exposed” to the surface, it is
accessible to p53. By contrary, it is inaccessible if the site is “buried”.
Thesis Goals
In this study, we collected the most comprehensive p53 ChIP fragments to
compare the normal and cancer cell lines. Clusters with overlapping p53 ChIP
fragments will be analyzed in terms of their distances to the transcription start site
(TSS) of nearest genes. We hypothesize that there is a significant difference in the
distances between the normal and cancer p53 clusters. Using statistic analyses, we can
test this hypothesis.
sequences of primate-specific interspersed repeats. Around 1509 of ≈319, 000 human
ERV LTR regions have a near-perfect p53 DNA binding site [14]. Zemojtel et al. [15]
reported that about 15 percentages of in vivo p53 sites could be derived in the short
interspersed nuclear element (SINE). Harris et al. [16] also detected that a large
number of p53 DNA binding sites in long interspersed nuclear elements-1 (L1s)
within the human genome. All these p53 binding sites reside in the 19
primate-specific Alu elements (SINE). Therefore, we plan to detect all the p53
binding sites up to now residing in repetitive regions and investigate their
distributions. The Gudkov’s group has shown that p53 cooperates with DNA
methylation to maintain epigenetic silencing of repeats, which include major classes
of short, interspersed nuclear elements (SINE) B1 and B2 [17]. Thus we will analyze
all the collection of p53 ChIP fragments to see how they are distributed among
repetitive regions. Furthermore, based on the observations of these clusters, we can
reveal their highly enriched pathways and clusters to do p53 functional analysis.
Methods and Materials
Collection of P53 Binding Sites
Generally, there are two main different ways to identify p53 binding sites (BSs).
The first traditional approach [18] focuses on a specific p53 response element (RE),
which can be regulated by p53 protein. It demonstrates the p53 RE by test gene
regulation and chromatin immunoprecipitation with a p53-specific antibody. The
second approach is high-throughput sequencing of chromatin immunoprecipitated
DNA (ChIP-seq), which can map the in vivo genome-wide binding sites of
DNA-binding proteins [19]. The extractions of the p53-bound DNA fragments by
chromatin immunoprecipitation (ChIP) are denoted ChIP fragments below.
For better analysis, we translated all the p53 ChIP fragments into the same
assembly hg18 by UCSC genome browser liftOver utility
separated into two datasets: cancer p53 ChIP fragments and normal p53 ChIP
fragments.
Concordance Between P53 Binding Sites Identified in Vitro and in Vivo
Besides the collected ChIP segments identified in vivo, a list of known 154
famous p53 REs [18] were studies to validate the assumption that the p53 ChIP
fragments can show the strong evidence of REs. Riley et al. [18] proposed that to
identify p53 – regulated genes, several criteria should be executed. P53 REs near or in
the gene could regulate the test gene and be regulated by activated wild p53 protein.
Most REs contains two half sequencing sites separated by a variable length spacer.
Once the ChIP fragments and REs are prepared, the sequence data and
annotations can be visualized using UCSC Genome Browser
(https://genome.ucsc.edu). Import the normal datasets and cancer datasets as
annotations tracks with assembly hg18 in Genome Brower. Then locate the p53 REs
in UCSC Genome Browser based on their genome positions to focus on the specific
areas. Therefore, we can have an overview of the p53 REs distributions in p53 ChIP
fragments.
Detection of P53 Core Binding Sites
Many binding sites were shared by most of the experiments/treatments, like 5-FU,
Nutlin 3a. After mapping all the p53 binding sites to the human genome (hg18), there
are many overlapping areas in every human chromosome. So along the chromosome,
every fragment has the occurrence based on its position. If we make a curve of the
occurrences along the chromosome, multiple peaks can be identified indicating the
high frequencies of certain binding sites. We can set cut-off values for the core
binding sites. Thus collect those sites with high occurrence numbers larger than cut
off value as the core binding sites. From UCSC table browser
(https://genome.ucsc.edu/cgi-bin/hgTables), we are able to get human RefSeq gene
information. The locations of these core binding sites with human RefSeq files were
binding sites can be identified. These genes will be used for further functional
annotation studies.
Distance Distribution of P53 Binding Sites
The chromatin context provides another perspective to see the regulation of
p53-DNA binding. Many studies were revealed that p53 genomic binding patterns in
normal cell lines is distinct from that in cancer cell lines, which means that the
chromatin organizations around p53 binding sites are different between normal cells
and cancer cells. It can help us understand the role of cell context, experimental
conditions in p53 binding, mutation factors and influence of chromatin states on
modulation of p53-DNA binding. Based on the collection of p53 binding sites
mapped in normal cell lines and cancer lines, a statistic analyses on the distances to
the transcription start sites (TSSs) of nearby genes was conducted. Different
distribution situations were compared between these two sets of p53 binding sites. To
test the hypothesis that there is significant difference between normal and cancer cell
lines in chromatin distribution, we calculate the means and p-value of these two
groups.
P53 Binding Sites Residing in Repeats
Many of the p53 binding sites (normal or cancer) are found locating in
transposable repetitive regions in the human genome. Wei et al. [20] reported that
over 30% of p53 sites are highly enriched in human ERV LTR regions. They
collected only hundreds of p53 cancer binding sites. We collected much more p53
ChIP fragments including their dataset to get a more comprehensive result. Also it’s
important to compare the different repetitive distribution between normal and cancer
cell lines. From the UCSC genome annotation database, we can get the human hg18
genome annotation files for each chromosome with the repeat regions. Then map the
normal p53 BSs and cancer p53 BSs to the repeat regions based on their chromosome
positions. We are able to get the number of repeat classes and repeat families in
kind of repeats. Therefore we have a complete set of p53 binding sites residing in
repetitive regions.
Functional Annotation of P53 ChIP Clusters
Large amount of p53 fragments are widely distributed in human genome and p53
tumor suppressor pathways have a high correlation with growth-inhibitory activity of
123 anticancer agents in more than 60 cell lines [21]. The single-nucleotide
polymorphisms (SNPs) in the p53-pathway have apparent influence on the alteration
of its function [22]. Several studies reported about the signaling pathways enriched in
HCT116 [23] and IMR90 [24] by using the genes harboring p53 binding sites. They
found the common pathway is p53 signaling pathway. But the most highly enriched
pathways in HCT116 and IMR90 are different. Smeek et al. [25] also performed
functional annotation for p53 phosphorylated at S46 and found that p53 signaling
pathway is the most enriched cluster. The next two important functional categories are
nuclear envelope and cell cycle regulation. So it is meaningful to analyze p53
pathways and function annotation.
DAVID (the Database for Annotation, Visualization and Integrated Discovery) is
a bioinformatics resource used for functional interpretation of large lists of genes or
proteins [26, 27]. So we can import the genes list of p53 ChIP clusters to DAVID to
get their pathways. The DAVID Functional Annotation Clustering Tool also measures
the relationships of annotation terms and show cluster groups [28]. We can compare
the pathways and clusters differences between cancer and normal cell.
Results
Collection of P53 Binding Sites and Lengh-distribution
After searching and studying most published articles relating to p53 binding sites
in vivo and in vitro, we have collected 154 p53 REs (Appendix Table A-1) and about
120,000 identified ChIP fragments from 25 datasets (Table 1). These ChIP segments
under different treatments.
Cell
type
Cell
line Treatment
Exp.
technique
Binding
sites Reference
Botcheva
(2011) normal IMR90 5-FU ChIP-seq 743 24
Zeron-Medina
(2013) normal
lympho blastoid Nutlin 3a ChIP-seq 1,084 29
DXR 12,792
IR 152
Akdemir
(2014) normal hESC
DXR (Adr)
ChIP-seq
4,324
30
RA (re) 7,197
McDade
(2014) normal
keratin octye DXR(Adr) ChIP-seq 4,169 31 cisplatin 8,629
Su (2015) normal lympho
blastoid DXR ChIP-seq 2,930 32
Wei (2006) cancer HCT11 6
5-FU ChIP-PET 542 20
Smeenk (2008) cancer U2OS Actinomycin D ChIP-chip 1,545 33
Smeenk (2011) cancer U2OS
Etoposide
ChIP-seq
2,920
25 Actinomycin D 2,132
Nikulenkov
(2012) cancer MCF7
Nutlin 3a
ChIP-seq
16,707
34
RITA 10,622
5-FU 10,365
(2013) DXR 3,087
Botcheva
(2014) cancer
HCT11
6 5-FU ChIP-seq 550 23 Rashi-Elkeles
(2014) cancer CAL51 IR ChIP-seq 1,825 36
Sanchez (2014) cancer HCT11
6 5-FU ChIP-seq 3,668 37
Chang (2014) cancer U2OS
Nutlin 3a
ChIP-exo
952
38
5-FU 1864
DXR 1303
[image:17.595.67.531.70.385.2]UV 1556
Table 1. Summary of p53 binding sites in vivo identified by ChIP experiments
After collecting all the p53 binding sites in Table 1, we separated them into
normal cell lines and cancer cell lines separately. There are 77,796 p53 binding sites
in cancer cell lines and 42,020 in normal cell lines.
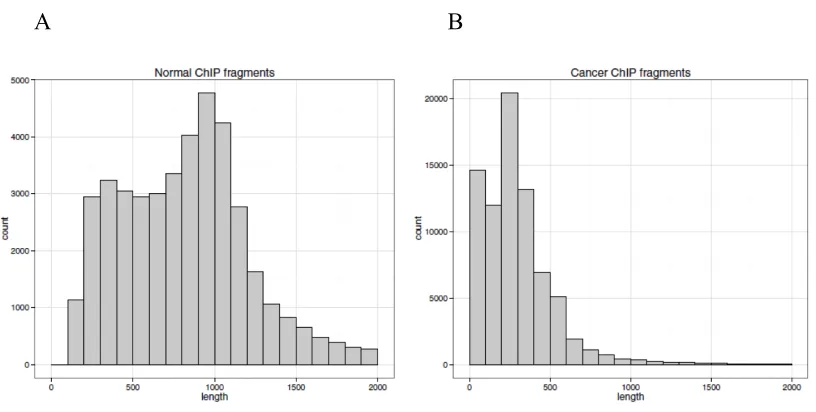
Figure 4. Length - frequency distributions of ChIP segments.
[image:17.595.94.502.510.716.2]C
D
(A) Total 42020 normal segments length – frequency distribution. (B) Total 77796
cancer segments length – frequency distribution. (C) 9 normal datasets length –
frequency distribution. (D) 16 cancer datasets length – frequency distribution.
Based on the start and end position of ChIP segments, the length distribution is
firstly analyzed. The normal (Figure 4A) cell lines provide a wider length distribution
than cancer (Figure 4B) cell lines. The lengths of p53 binding sites in cancer
concentrate mainly on 0~500bp. While for normal cell lines, the lengths cover from
0~2000bp. It shows that cancer segments are much shorter than normal segments on
cancer cell lines. From every dataset length distribution, normal ChIP fragments are
longer than cancer on average. We need to investigate the reasons for this difference
in the future.
Concordance Between P53 Binding Sites Identified in Vitro and in Vivo
Based on work of Riley et al. [18], we collected 154 famous p53 REs (Appendix
Table A-1). In the research of Riley et al. [14], they have 156 binding sites. We
remove the human hepatitis B virus (HBV) site and one overlapping CDKN1A (p21)
sites.
To study the correlation between p53 binding sites identified in vitro and in vivo,
we imported all ChIP segments to UCSC Genome Browser to do visualization. Then
mapped the targeted 154 REs based on their chromosomes and positions (Appendix
Table A-1). All the custom track figures of p53 REs can be checked in Supplementary
Figure S1.
We can find that 71 out of 154 (46%) REs overlap with ChIP fragments. So it is
[image:19.595.112.528.498.669.2]obvious that the ChIP segments can cover the most of targeted genes.
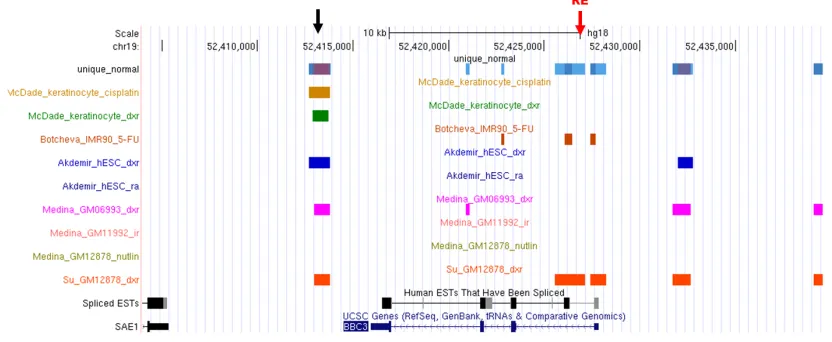
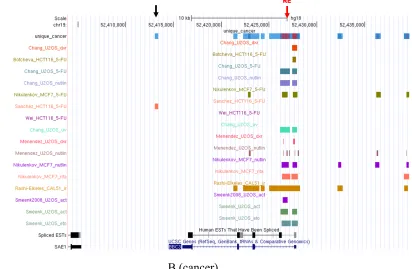
Figure 5. BBC3 (PUMA) gene in UCSC Genome Browser
B (cancer)
Figure 5 shows one main famous target gene BBC3 (PUMA) overlaps with ChIP
fragments locating in normal and cancer cell line separately through the UCSC
Genome Browser. It concluded that the p53 binding sites identified in vitro has a very
high concordance with those identified in vivo. Based on the figures, besides the
targeted genes position, there are many other areas that are covered by many ChIP
segments from different datasets. For example, the black arrows in Figure 5 point the
common areas. It may help to better identify p53 binding sites relating these areas in
the future.
Detection of P53 Core Binding Sites
Many p53 ChIP fragments have overlapping positions in the human genome
(hg18), so we collected those sites with high occurrence numbers as the core set.
After mapping all normal and cancer fragments to human genome (hg18) based on
their chromosome positions, we found that 44% (18,565 out of 42,020) normal
fragments are singletons and 40% (31,212 out of 77,796) cancer fragments are
overlap with each other to be clusters. Based on there number of overlapping times,
we denoted them as pile-2, pile-3, pile-4 and so on. For p53 normal fragments, the
percentage of pile2 is 11% and pile 3 is 0.5%. P53 cancer cells have the similar
percentage trend with normal cells. So we set the cut-off value of 3 to be core binding
sites. That means that the fragments with occurrences equal or larger than 3 are core
binding sites. We denoted them as “pile-3+”. According to statistics, the normal
pile-3+ containing 3551 fragments (Supplementary Table S1). While cancer pile-3+
[image:21.595.190.336.308.448.2]has 6039 fragments (Supplementary Table S2).
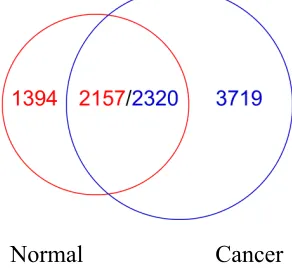
Figure 6. Overlapping fragments between cancer clusters and normal clusters
Normal Cancer
After comparing normal pile-3+ and cancer pile-3+, we found the Figure 7
overlapping results. Normal pile-3+ has 2157 fragments overlapping with cancer
pile-3+ while cancer pile-3+ only has 2320. The reason is that the average normal
fragments are longer than cancer fragments as we mentioned in previous
length-frequency distribution analysis. So one fragment in normal cells may overlap
more than one cancer fragment. For better description, we denote the p53 ChIP
fragments that only belong to normal or cancer cells as “normal_only” group or
“cancer_only” group. Also we name the overlapping fragments as “normal/cancer”
group.
Distance Distribution of P53 Binding Sites
From UCSC Table Browser we downloaded human RefSeq Genes table with
(Supplementary Table S1, S2) to this table based on their positions to find nearest
RefSeq genes. If the ChIP fragment is upstream to the transcription start site (TSS) of
a give gene, the distance is ‘-‘. Otherwise the distance has a ‘+’ sign. The RefSeq
gene names and distances are added to the pile-3+ table with column names “Gene
[image:22.595.154.444.208.393.2]Name” and “Peak to TSS” (Supplementary Table S1, S2).
Figure 7. Genomic distributions of pile-3+ binding sites (BSs) to TSSs
A. Normal B. Cancer
After a statistics analysis of the lengths from p53 binding sites to the
transcriptional start sites (TSSs) in normal and cancer cell lines, it showed significant
differences between the two cases in Figure 6. In cancer BSs the proportion of “>25kb”
is much higher than normal. While the part “<1kb” is smaller in cancer than normal.
On the whole, cancer p53 BSs are located far from TSSs and normal BSs are near the
TSSs. This shows that they have the apparently different genomic distributions and
chromatin context. We used the absolute distance values for hypothesis test and got
the average distance 66389.03 for normal cell lines and 74972.97 for cancer cell lines.
The p-value got from T-test is 0.00165, which is much smaller than 0.05. It
demonstrates that there is significant difference in the distances between normal and
cancer p53 clusters.
P53 Binding Sites Residing in Repeats
After mapping pile-3+ normal and cancer ChIP fragments (Supplementary Table
name, repeated class and repeated family information for normal_only, cancer_only
and normal/cancer groups and conducted a statistical analyses (Table 2). The repeated
types include SINE (MIR, Alu), Simple Repeat, LTR, Low Complexity, LINE (CR1,
L1, L2, RTE), DNA. The remaining repeated types with lower occurrences were
added up to be “Other” category.
If the ChIP fragments are not in any repeat areas, they are classified as
“Not_in_repeat” category. If the ChIP fragments cover more than one repeat area, all
the repeat categories are counted.
A:
Normal Normal/Cancer Cancer
All repeat types Count Percentage Count Percentage Count Percentage
SINE 1382 39.09% 1260 28.42% 1568 26.79%
Simple_repeat 342 9.67% 334 7.53% 323 5.52%
Other 45 1.27% 21 0.47% 69 1.18%
Not_in_repeat 166 4.70% 479 10.81% 1268 21.66%
LTR 455 12.87% 1046 23.60% 843 14.40%
Low_complexity 332 9.39% 213 4.80% 259 4.43%
LINE 618 17.48% 827 18.66% 1139 19.46%
DNA 195 5.52% 253 5.71% 384 6.56%
Total 3535 100.00% 4433 100.00% 5853 100.00%
B:
Normal Normal/Cancer Cancer
SINE Count Percentage Count Percentage Count Percentage MIR 526 38.06% 461 36.59% 570 36.35%
Alu 856 61.94% 799 63.41% 998 63.65%
Total 25 4.05% 1260 100.00% 50 4.39%
C:
Normal Normal/Cancer Cancer
LINE Count Percentage Count Percentage Count Percentage
CR1 25 4.05% 41 4.96% 50 4.39%
L1 305 49.35% 488 59.01% 616 54.08%
L2 280 45.31% 285 34.46% 462 40.56%
RTE 8 1.29% 13 1.57% 11 0.97%
D:
Normal Normal/Cancer Cancer
Alu Count Percentage Count Percentage Count Percentage AluJb 111 12.97% 133 16.65% 153 15.33%
AluJo 125 14.60% 147 18.40% 150 15.03%
AluSc 25 2.92% 27 3.38% 32 3.21%
AluSg 64 7.48% 40 5.01% 69 6.91%
AluSg/x 14 1.64% 23 2.88% 32 3.21%
AluSp 45 5.26% 30 3.75% 35 3.51%
AluSq 68 7.94% 51 6.38% 70 7.01%
AluSx 247 28.86% 227 28.41% 256 25.65%
AluY 79 9.23% 42 5.26% 88 8.82%
FLAM_A 12 1.40% 8 1.00% 19 1.90%
FLAM_C 20 2.34% 24 3.00% 31 3.11%
FRAM 15 1.75% 18 2.25% 30 3.01%
Other 31 3.62% 29 3.63% 33 3.31%
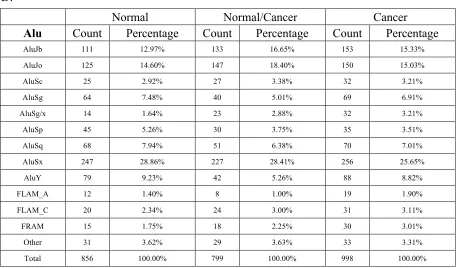
[image:24.595.89.546.87.355.2]Total 856 100.00% 799 100.00% 998 100.00%
Table 2: The statistics results of p53 ChIP fragments in repetitive regions. Statistics
are shown for (A) All repeat types; (B) Short interspersed nuclear elements (SINE);
(C) Long interspersed nuclear elements (LINE); (D) Alu elements.
Here we focused on their distributions in all repeat types, short interspersed
nuclear elements (SINE), long interspersed nuclear elements (LINE) and Alu
elements. Based on percentages of various repeat categories, the pie charts are shown
for better display (Figure 8).
Figure 8. Pie charts of p53 clusters residing in repeat regions
[image:24.595.100.509.590.747.2]
D E F
G H I
J K L
(A) All repeat types for normal_only group. (B) All repeat types for normal/cancer
group. (C) All repeat types for cancer_only group. (D) Short interspersed nuclear
elements (SINE) for normal_only group. (E) Long interspersed nuclear elements
(LINE) for normal_only group. (F) Alu elements for normal_only group. (G) Short
interspersed nuclear elements (SINE) for normal/cancer group. (H) Long interspersed
nuclear elements (LINE) for normal/cancer group. (I) Alu elements for normal/cancer
group. (J) Short interspersed nuclear elements (SINE) for cancer_only group. (K)
Long interspersed nuclear elements (LINE) for cancer_only group. (L) Alu elements
for cancer_only group.
normal cells have a big difference in the distribution of repetitive regions compared
with cancer cells. For p53 binding sites in normal_only group, highest proportion
“SINE” category reaches 39%. While in normal/cancer and cancer_only group,
“SINE” only has 26% and 28%. The biggest difference is the sites that are not in any
repetitive regions. In normal_only group, “Not_in_repeat” is only 4.7%. But in
cancer_only group there are 10% of ChIP fragments that are not in any repetitive
regions. The percentage of “LTR” in normal/cancer group is much higher than
normal_only and cancer_only groups. It reaches 23%, which demonstrates the
conclusion that one-third of p53 binding sites containing LTRs [14].
In the repeated family “SINE” (Figure 8D, Figure 8G, Figure 8J), “LINE”
(Figure 8E, Figure 8H, Figure 8K) and “Alu” elements (Figure 8F, Figure 8I, Figure
8L), there are no evidential differences among cancer_only, normal/cancer and
normal_only groups. In the “SINE” repeat family, “Alu” can reach to about 60% in
all of them.
Functional Annotation of P53 ChIP Clusters
In Figure 6, most of the p53 ChIP clusters are located far away from TSSs (>10
kb). Thus the genes of p53 binding sites with the distances 5kb upstream/downstream
of transcription start sites (TSSs) were selected as our targeted genes. We have got the
genes list of p53 ChIP fragments in previous “Distance Distribution” step. So we
imported gene lists of normal_only, normal/cancer and cancer_only groups to DAVID
(https://david.ncifcrf.gov/). From DAVID Pathway Viewer, obviously we can find Kyoto Encyclopedia of Genes and Genomes (KEGG) database containing genes from
list. The following Figure 9 shows the significant KEGG pathways of normal_only,
normal/cancer and cancer_only groups. We chose the pathways with statistical
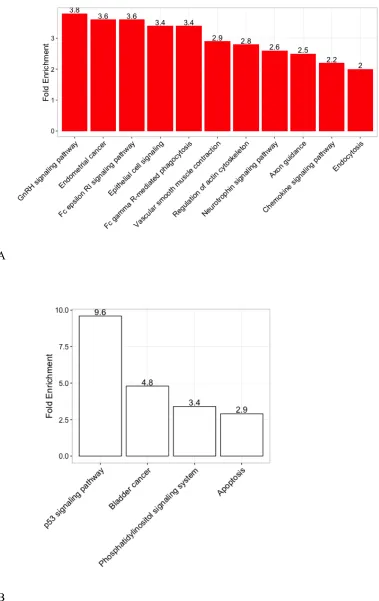
Figure 9. Enriched pathways for p53 genes from DAVID
A
C
Most highly enriched KEGG pathway in DAVID functional annotation analysis of the
genes associated with p53 ChIP fragments (p-value <0.01). Fold enrichment is
calculated by DAVID. (A) Normal_only group. (B) Normal/cancer group. (C)
Cancer_only group.
Figure 9A, 9B, 9C show the enriched KEGG pathways for normal_only,
normal/cancer and cancer_only groups. P53 signaling pathway in both normal/cancer
and cancer_only group has the highest fold enrichment values 9.6 and 4.4. In
normal/cancer group, three other groups are also showed, “bladder cancer”,
“apoptosis” and “phosphatidylinositol signaling system”. The changes in the
molecules in the p53 genes and pathways can regulate the cell cycle and affect
bladder cancer [39]. Haupt et al. [40] reported that p53 activates signals through two
major apoptotic pathways: the extrinsic, death receptor pathway and the intrinsic,
mitochondrial pathway. The tumor suppressor PTEN antagonizing
phosphatidylinositol-3,4,5-trisphosphate (PIP3) regulates p53 pathway [41]. These
[image:28.595.115.432.103.354.2]transcriptional programs.
Figure 10. Enriched clusters for p53 genes from DAVID
A
C
[image:30.595.105.483.106.399.2]
Figure 10: Most highly enriched clusters in DAVID functional annotation analysis of
the genes associated with p53 ChIP fragment. See Supplementary Table S8-S9 for all
enriched clusters. (A) Normal_only group. (B) Normal/cancer group. (C)
Cancer_only group.
Figure 10A, 10B, 10C show the highly enriched clusters of genes for
normal_only, normal/cancer and cancer-only groups. They are arranged based on the
enrichment scores. From normal/cancer groups (Figure 10B), we can find that the
most significant GO terms include ‘‘Regulation of apoptosis’’, “DNA damage
response” and “Cellular response to stress”. These demonstrate that the p53 clusters
from p53 ChIP fragments are bound up with genes relating with cell cycle control and
Discussion
Chromatin Context and Distribution
P53 plays an important role in regulating cell cycles and maintaining genomic
stability. The transcription regulation can be influenced by many factors. Leroy et al.
[42] reported that more than half of human cancers carry TP53 gene mutations and
these relate with p53 REs. Posttranslational Modification can impact the p53 function
in response to genotoxic or nongenotoxic stresses [43]. Some family members like
p63 and p73 can also influence p53 activities [44]. All these factors active in the p53
chromatin context because p53 plays a role in transcription regulation and interactions
with DNA. In this study, different p53 chromosome distributions and organizations
between normal and cancer cell lines were analyzed using ~120,000 ChIP fragments.
As our datasets are comprehensive and cover most published p53 DNA binding
sites in vivo, the normal and cancer cell lines are under the same treatments (Table 1).
For example, both of them have treatments like 5-FU, Nutlin 3a, DXR. Actually these
datasets come from different experiments, labs and researches. From our results in
“Concordance between P53 Binding Sites and ChIP Fragments” and “Core Binding
Sites”, there were consistently large overlapping areas. So the chromatin context
analyses in our research has statistic significance.
P53 Distributions in Repetitive Regions in Normal and Cancer Chromatin
The majority of p53 binding sites locate in many repetitive regions: SINE, LINE,
Alu and so on. Cui et al. [45] proposed that the primate-specific Alu repeats involve
in changing the p53 regulatory network in the chromatin context. In this study, we
focus on the different repetitive distributions between normal and cancer cell lines
relating with chromatin context. For example, cancer_only group has a much larger
“Not_in_repeat” percentage than normal_only group. This may result from their
different chromatin organization. Many factors probably influence this different
Future Work
This study is focused on p53 binding sites configuration. The differences of
chromatin context and distribution between cancer cell lines and normal cell lines
have been analyzed from several aspects, such as length distributions of p53 binding
sites, overlapping areas, distribution of various repeat categories and enriched
pathways and clusters. Additional research and work can be investigated based on this
p53 dataset.
From the visualization results of these ~120,000 ChIP fragments, we can find that
it covers about 46% of the 154 REs list. There still have 54% percentages of REs are
not included. Also from Table 1, the normal and cancer cell lines were found to share
many several treatments. But some treatments just belong to one cell type. For
example, normal ChIP fragments have cisplain treatment while cancer does not have.
These mean our dataset still needs supplement in the future, which can provide more
instructive results.
Millau et al. [46] reported that the chromatin is the reason for the formation of
stress-specific p53 binding patterns. The sequence-specific p53 binding affinity
cannot change the p53 binding patterns. While some treatments, like UVB, Nutlin-3,
can get different cellular results. In our research, we collected large number of p53
ChIP fragments to form a distinct p53 binding patterns consisting of normal and
cancer cell lines. Further analysis can be carried out on our p53 binding patterns with
stress treatments. We can see how p53 has specific gene regulation in response to
stress in normal and cancer cell lines.
Conclusions
This thesis research involved many public ChIP data to do p53 chromatin context
study. All the largest amount of data were analyzed by computer language R and
performed on the public bioinformatics platform, like UCSC, DAVID. The
comparison of chromatin organization and distribution between normal cell lines and
cancer cell lines can help us have more pertinent and specific research in the future.
cancer cell lines have different chromatin distribution. We also reveal the enriched
pathways and clusters to demonstrate p53 transcriptional function, which represents
References
1. Hyland, E.M., Cosgrove, M.S., Molina, H., Wang, D., Pandey, A., Cottee, R.J. and
Boeke, J.D. (2005). Insights into the Role of Histone H3 and Histone H4 Core
Modifiable Residues in Saccharomyces cerevisiae. Mol Cell Biol. 25,
10060-10070.
2. Cole, H.A., Cui, F., Ocampo, J., Burke, T.L., Nikitina, T., Kotomura, N., Zhurkin,
V.B. and Clark, D.J. (2016) Novel nucleosomal particles containing core histones
and linker DNA but no histone H1. Nucleic Acids Res. 44, 573-581.
3. Henikoff, S., Furuyama, T. and Ahmad, K. (2004). Histone variants, nucleosome
assembly and epigenetic inheritance. Trends in Genetics. 20, 320-326.
4. Bartke, T., et al. (2010). Nucleosome-interacting proteins regulated by DNA and
histone methylation. Cell 143(3): 470-484.
5. Bernstein, B.E., Meissner, A., Lander, E.S. The mammalian epigenome. Cell. 2007;
128, 669–681.
6. Rossetti, L., Cacchione, S., De Menna, A., Chapman, L., Rhodes, D. and Savino, M.
(2001) Specific interactions of the telomeric protein Rap1p with nucleosomal
binding sites. J. Mol. Biol. 306, 903-913.
7. Sengupta, S.M., VanKanegan, M., Persinger, J., Logie, C., Cairns, B.R., Peterson,
C.L. and Bartholomew, B. (2001) The interactions of yeast SWI/SNF and RSC
with the nucleosome before and after chromatin remodeling. J. Biol. Chem. 276,
12636-12644.
8. Harris, C. C. (1996). Structure and function of the p53 tumor suppressor gene:
clues for rational cancer therapeutic strategies. Journal of the National Cancer
Institute 88(20): 1442-1455.
9. Hollstein, M., K. Rice, M. S. Greenblatt, T. Soussi, R. Fuchs, T. Sorlie, E. Hovig, B.
Smith-Sorensen, R. Montesano, and C. C. Harris. 1994. Database of p53 gene
somatic mutations in human tumors and cell lines. Nucleic Acids Res. 22:3551–
10. Appella, E. and Anderson, C.W. (2001) Post-translational modifications and
activation of p53 by genotoxic stresses. Eur. J. Biochem. 268, 2764-2772.
11. Kaeser, M. D. and Iggo, R. D. (2002). Chromatin immunoprecipitation analysis
fails to support the latency model for regulation of p53 DNA binding activity in
vivo. Proc Natl Acad Sci U S A 99(1): 95-100.
12. Nagaich, A.K., Zhurkin, V.B., Durell, S.R., Jernigan, R.L., Appella, E. and
Harrington, R.E. (1999) p53-induced DNA bending and twisting: p53 tetramer
binds on the outer side of a DNA loop and increases DNA twisting. Proc Natl
Acad Sci USA 96, 1875-1880.
13. Sahu, G., Wang, D., Chen, C.B., Zhurkin, V.B., Harrington, R.E., Appella, E.,
Hager, G.L. and Nagaich, A.K. (2010) p53 binding to nucleosomal DNA depends
on the rotational positioning of DNA response element. J. Biol. Chem. 285,
1321-1332.
14. Wang, T., Zeng, J., Lowe, C.B., Sellers, R.G., Salama, S.R., Yang, M., Burgess,
S.M., Brachmann, R.K., Haussler, D. (2007) Species-specific endogenous
retroviruses shape the transcriptional network of the human tumor suppressor
protein p53. Proc. Natl. Acad. Sci. U.S.A. 104, 18613-18618.
15. Zemojtel, T., Kielbasa, S.M., Arndt, P.F., Chung, H-R. and Vingron, M. (2009)
Methylation and deamination of CpGs generate p53-binding sites on a genomic
scale. Trends Genet. 25, 63-66.
16. Harris, C.R., Dewan, A., Zupnick, A., Normart, R., Gabriel, A., Prives, C., Levine,
A.J. and Hoh, J. (2009) p53 response elements in human retrotransposons.
Oncogene 28, 3857-3865.
17. Leonova, K.I., Brodsky, L.B., Lipchick, B., Pal, M., Novototskaya, L., Chenchik,
A.A., Sen, G.C., Komarova, E.A. and Gudkov, A.V. (2012) p53 cooperates with
DNA methylation and a suicidal interferon response to maintain epigenetic
silencing of repeats and noncoding RNAs. Proc. Natl. Acad. Sci. U.S.A. 110,
E89-E98.
18. Riley, T., Sontag, E., Chen, P. and Levine, A. (2008) Transcriptional control of
19. Cawley, S., Bekiranov, S., Ng, H.H., Kapranov, P., Sekinger, E.A., Kampa, D.,
Piccolboni, A.,Sementchenko, V., Cheng, J., Williams, A.J., Wheeler, R., Wong,
B., Drenkow, J., Yamanaka, M., Patel, S., Brubaker, S., Tammana, H., Helt, G.,
Struhl, K., Gingeras, T.R (2004) Unbiased mapping of transcription factor binding
sites along human chromosome 21 and 22 points to widespread regulation of
noncoding RNAs. Cell 116, 499-509.
20. Wei, C. L., Wu, Q., Vega, V. B., Chiu, K. P., Ng, P., Zhang, T., Ruan, Y. (2006).
A global map of p53 transcription-factor binding sites in the human genome. Cell,
124(1), 207-219.
21. O'Connor, J. J., Jackmamn, J.J., Timothy, I.B., Myers, G., Fan, S., Mutoh, M,. et
al. (1997). Characterization of the p53 Tumor Suppressor Pathway in Cell Lines of
the National Cancer Institute Anticancer Drug Screen and Correlations with the
Growth-Inhibitory Potency of 123 Anticancer Agents. Cancer Research, 57,
4285-4300.
22. Sucheston, L., Witonsky, D.B., Hastings, D., Yildiz, O., Clark, V.J., Rienzo, A.D.,
and Onel, K. (2011). Natural selection and functional genetic variation in the p53
pathway. Human Molecular Genetics, 20, 1502-1508.
23. Botcheva, K., & McCorkle, S. R. (2014). Cell context dependent p53
genome-wide binding patterns and enrichment at repeats. PLoS One, 9(11),
e113492.
24. Botcheva,K., McCorkle,S.R., McCombie,W.R., Dunn,J.J. and Anderson,C.W.
(2011) Distinct p53 genomic binding patterns in normal and cancer-derived human
cells. Cell Cycle 10, 4237-4249.
25. Smeenk, L., van Heeringen, S. J., Koeppel, M., Gilbert, B., Janssen-Megens, E.,
Stunnenberg, H. G., & Lohrum, M. (2011). Role of p53 serine 46 in p53 target
gene regulation. PLoS One, 6(3), e17574.
26. Huang, D.W., Sherman, B.T. and Lempicki, R.A. (2009) Systematic and
integrative analysis of large gene lists using DAVID Bioinformatics Resources.
Nature Protoc., 4, 44-57.
enrichment tools: paths toward the comprehensive functional analysis of large
gene lists. Nucleic Acids Res., 37, 1-13.
28. Huang, D.W., Sherman, B.T., Tan, Q., Kir, J., Liu, D. et al (2007) DAVID
Bioinformatics Resources: expanded annotation database and novel algorithms to
better extract biology from large gene lists. Nucleic Acid Research. 35, 169-175.
29. Zeron-Medina, J., Wang, X., Repapi, E., Campbell, M. R., Su, D., Castro-Giner,
F., Bond, G. L. (2013). A polymorphic p53 response element in KIT ligand
influences cancer risk and has undergone natural selection. Cell, 155(2), 410-422.
30. Akdemir, K. C., Jain, A. K., Allton, K., Aronow, B., Xu, X., Cooney, A. J.,
Barton, M. C. (2014). Genome-wide profiling reveals stimulus-specific functions
of p53 during differentiation and DNA damage of human embryonic stem cells.
Nucleic Acids Res, 42(1), 205-223.
31. McDade, S. S., Patel, D., Moran, M., Campbell, J., Fenwick, K., Kozarewa, I.,
McCance, D. J. (2014). Genome-wide characterization reveals complex interplay
between TP53 and TP63 in response to genotoxic stress. Nucleic Acids Res,
42(10), 6270-6285.
32. Su, D., Wang, X., Campbell, M. R., Song, L., Safi, A., Crawford, G. E., & Bell, D.
A. (2015). Interactions of chromatin context, binding site sequence content, and
sequence evolution in stress-induced p53 occupancy and transactivation. PLoS
Genet. 11(1): e1004885.
33.Smeenk, L., van Heeringen, S. J., Koeppel, M., van Driel, M. A., Bartels, S. J.,
Akkers, R. C., Lohrum, M. (2008). Characterization of genome-wide p53-binding
sites upon stress response. Nucleic Acids Res, 36(11), 3639-3654.
34. Nikulenkov, F., Spinnler, C., Li, H., Tonelli, C., Shi, Y., Turunen, M., Selivanova,
G. (2012). Insights into p53 transcriptional function via genome-wide chromatin
occupancy and gene expression analysis. Cell Death Differ, 19(12), 1992-2002.
35. Menendez, D., Nguyen, T. A., Freudenberg, J. M., Mathew, V. J., Anderson, C.
W., Jothi, R., & Resnick, M. A. (2013). Diverse stresses dramatically alter
genome-wide p53 binding and transactivation landscape in human cancer cells.
36. Rashi-Elkeles, S., Warnatz, H. J., Elkon, R., Kupershtein, A., Chobod, Y., Paz, A.,
Shiloh, Y. (2014). Parallel profiling of the transcriptome, cistrome, and epigenome
in the cellular response to ionizing radiation. Sci Signal, 7(325), rs3.
37. Sanchez, Y., Segura, V., Marin-Bejar, O., Athie, A., Marchese, F. P., Gonzalez, J.,
Huarte, M. (2014). Genome-wide analysis of the human p53 transcriptional
network unveils a lncRNA tumour suppressor signature. Nat Commun, 5, 1-13.
38. Chang, G. S., Chen, X. A., Park, B., Rhee, H. S., Li, P., Han, K. H., Pugh, B. F.
(2014). A comprehensive and high-resolution genome-wide response of p53 to
stress. Cell Rep, 8(2), 514-527.
39. Mitra, A.P., Birkhahn, M., Cote, R.J. (2007) p53 and retinoblastoma pathways in
bladder cancer. World Journal of Urology. 25, 563-571.
40. Haupt, S., Berger, M., Goldberg, Z., Haupt, Y. (2003). Apoptosis – the p53
network. Journal of Cell Science. 115, 4077-4085.
41. Bunney, T.D. and Katan, M. (2010) Phosphoinositide signaling in cancer: beyond
PI3K and PTEN. Nat. Rev. Cancer, 10, 342-352.
42. Leroy, B., Anderson, M. and Soussi, T. (2014). TP53 mutations in human cancer:
database reassessment and prospects for the next decade. Hum. Mutat. 35, 672–
688.
43. Meek, D. W. and Anderson, C. W. (2009). Posttranslational modification of p53:
cooperative integrators of function. Cold Spring Harb. Perspect. Biol. 1:a000950.
44. Botcheva, K. (2014). p53 binding to human genome: crowd control navigation in
chromatin context. Frontiers in Genetics. 22, 447-453.
45 Cui, F., Sirotin, M.V. and Zhurkin, V.B. (2011) Impact of Alu repeats on the
evolution of human p53 binding sites. Biol. Direct, 6, 2.
46. Millau, J.F., Bandele, O.J., Perron, J., Bastien, N., Bouchard, E.F., Gaudreau, L.,
Bell, D.A. and Drouin, R. (2010) Formation of stress-specific p53 binding patterns
is influenced by chromatin but not by modulation of p53 binding affinity to
Appendix A
Name Chr Strand Start End 1st half-site Spacer 2nd half-site
Overlap
with
ChIP?
ABCB1 7 ― 87068176 87068208 GGGCAGGAAC agcgccggggcgt GGGCTGAGCA No
ACTA2 10 ― 90702802 90702821 AACCATGCCT GCATCTGCCC No
AIFM2_RE1 10 ― 71563263 71563292 AGGCATGAGC caccgtgcct GGCCATGCCC No
AIFM2_RE2 10 ― 71563350 71563377 GGTCTCGCTA tgttgccc AGGCTGGTCT No
ANLN 7 + 36395090 36395115 GAACTGGCTT ttctga GGGCCAGGCC No
APAF1 12 + 97562605 97562637 AGACATGTCT ggagaccctagga CGACAAGCCC Yes
APC 5 + 112101252 112101283 GGGCATACCC ccgaggggtacg GGGCTAGGGC No
ARID3A 19 + 884568 884587 GGACACGCTG GGACATGCCT Yes
ATF3 1 + 210848347 210848383 AGTCATGCCG ctggcttgggcaccatt GGTCATGCCT Yes
BAI1 8 + 143559821 143559840 GTGGCTGCCT GGACATGTTC Yes
BAX 19 + 54150282 54150301 GGGCAGGCCC GGGCTTGTCG Yes
BBC3 19 ― 52426417 52426436 CTGCAAGTCC TGACTTGTCC Yes
BCL2L14 12 + 12117280 12117299 AGCCAAGGCT GGTCTTGAAC No
BCL6 3 ― 188945441 188945472 GACAGTGCTT ggggggtgattc GGGCTAGTCT No BDKRB2 14 + 95740864 95740883 GGAagTGCCC AGGaggcTga Yes
BID 22 ― 16619483 16619502 GGGCATGATG GTGCATGCCT No BIRC5 17 + 73721905 73721927 GGGCGTGCGC tcc CGACATGCCC No
BNIP3L 8 + 26331013 26331037 AAGCTAGTCT cagtg GcGCATGCCT No
BTG2 1 + 201541261 201541280 AGTCCGGGCA GAGCCCGAGC Yes
C12orf5 12 + 4301042 4301063 AGACATGTCC ac AGACTTGTCT Yes
C13orf15 13 + 40930827 40930849 AGGCgAGTTT aag cAGCTTGTCC No
CASP1 11 ― 104411147 104411166 AGACATGCAT ATGCATGCAc No
CASP10 2 + 201755017 201755041 AAACTTGCTg gttta AAtCTTGgCT No
CASP6 4 ― 110838081 110838104 AGGCAAGGAG tttg AGACAAGTCT No
CAV1 7 + 115952057 115952087 GCCCAAGCAC cccagcgcggg AGAaACGTTC Yes
CCNG1 5 + 162797510 162797529 GcACAAGCCC AGGCTAGTCC Yes
CCNK 14 + 99020378 99020399 AAACTAGCTT gc AGACATGCTg Yes
CD82 11 + 44542897 44542921 AGGCAAGCTG gggca GctCAAGCCT Yes
CDC25C 5 ― 137695540 137695570 GGGCAAGTCT taccatttcca GAGCAAGCaC No
CDKN1A_RE1 6 + 36752204 36752223 GAACATGTCC cAACATGTTg Yes
CDKN1A_RE2 6 + 36753091 36753110 AGACTGGGCA TGTCTGGGCA Yes
CHMP4C 8 + 82806745 82806782 AAACAAGCCC agtagcagcagctgctcc GAGCTTGCCC No
COL18A1_RE1 21 + 45697015 45697034 TGACATGTGT GAGCATGTAT No
COL18A1_RE2 21 + 45697491 45697510 TGACATGTGT GAGCATGTAT No
CRYZ 1 ― 74963572 74963594 ctGCAAGTCC att AAACcTGTTT No
CTSD_RE2 11 ― 1742152 1742171 AAcCTTGgTT tgcAAgAgGC No
CX3CL1 16 + 55963635 55963655 GGGCATGTTC c CAGCTTGTGG No
DDB2 11 + 47193106 47193126 GAACAAGCCC t GGGCATGTTT Yes
DDIT4 10 + 73703380 73703399 AAACAAGTCT TTCCTTGATC Yes
DDR1 6 + 30962949 30962968 GAGCTGGTCC AGGCTTATCT No
DKK1 10 + 53741910 53741935 AGCCAAGCTT ttaatg AACCAAGTTC No
DNMT1 19 ― 10166756 10166782 GCGCATGCGT gttccct GGGCATGGCC No DUSP1 5 ― 172129554 172129574 GGTCCTGCCC a GGCAAATGGG No
DUSP5 10 + 112246487 112246507 CAACAAGCCC t TGTCTAGTGC No
EDN2 1 ― 41720668 41720687 CTGCAAGCCC GGGCATGCCC Yes
EEF1A1_RE1 6 ― 74285585 74285606 GGGCAGaCCC ga GAGCATGCCC No
EEF1A1_RE2 6 ― 74285784 74285805 AAACATGaTT ac AGGgACaTCT No
EEF1A1_RE3 6 ― 74286408 74286431 GGACACGTag attc GGGCAAGTCC No
EGFR 7 + 55054199 55054221 GAGCTAGaCg tcc GGGCAGcCCC No
EPHA2 1 ― 16356670 16356692 CACCATGTTg gcc AGGCATGTCT No
FANCC 9 ― 97121069 97121098 GGACATGTTT aaatacttga GAGCTAtTTT No
FAS 10 + 90741046 90741065 GGACAAGCCC tGACAAGCCa Yes
FDXR 17 ― 70380716 70380735 GGGCAgGagC GGGCTTGCCC Yes GADD45A 1 + 67925046 67925065 GAACATGTCT AAGCATGCTg Yes
GDF15_RE1 19 + 18357118 18357137 cAtCTTGCCC AGACTTGTCT Yes
GDF15_RE2 19 + 18357996 18358015 AGcCATGCCC GGGCAAGaaC Yes
GML 8 + 143894249 143894268 AtGCTTGCCC AGGCATGTCC Yes
GPX1 3 ― 49370958 49370977 GGGCcAGaCC AGACATGCCT Yes
HTT/HD_RE1 4 + 3044349 3044371 cGcCATGTTg gcc AGGCTGGTCT No
HTT/HD_RE2 4 + 3061438 3061464 AtGCTTGTTC tacagaa GAGCATGTTa No
HTT/HD_RE3 4 + 3072173 3072198 GGGCcTGCTT ccagtt AAGCTTGCTT No
HGF 7 ― 81237693 81237712 AcACATGTaT TTTCcTGTTT No HIC1 17 + 1905568 1905587 GGcgcTGCCC TggCAcagCT Yes
HSP90AB1 6 + 44322842 44322871 GGGAcTGTCT gggtatcgga AAGCAAGCCT Yes
HSPA8 11 ― 122437379 122437406 GcACTAGTTC tggacctc GcGCgTGCTT Yes
IBRDC2 6 + 18495404 18495423 AGACAGGTCC TGACAAGCAG Yes
IER3 6 ― 30820530 30820549 CCACATGCCT CGACATGTGC Yes
IGFBP3_RE1 7 ― 45923287 45923306 GGGCAAGACC TGCCAAGCCT No
IGFBP3_RE2 7 ― 45924206 45924226 AAACAAGCCA c CAACATGCTT No
IRF5 7 + 128369513 128369534 AGGCATGCCa ca AGGCATGgTC No
KRT8 12 ― 51585038 51585059 ccGCcTGCCT cc ActCcTGCCT No
LGALS3 14 + 54673996 54674020 GGGCTTGCAA gctgg AGCCTTGTTT No
LIF 22 ― 28971856 28971875 GGACATGTCG GGACAGCTCC Yes
LRDD 11 ― 794414 794441 AGGCcTGCCT gcgtgctg GGACATGTCT Yes
MAD1L1 7 ― 2239405 2239424 ATTCAAGCTG ATACTGAGTA Yes
mdm2_RE1 12 + 67489008 67489027 AGTTAAGTCC TGACTTGTCT Yes
MET 7 + 116099462 116099495 GGACggacag cacgcgaggcagac AGACAcGTgC No
MLH1 3 + 37010251 37010271 AGGCATGTAC a GCGCATGCCC Yes
MMP2 16 + 54068958 54068977 AGACAAGCCT GAACTTGTCT Yes
MSH2_RE1 2 + 47483388 47483420 AGGCTAGTTT tttttttgttttc AAGTTTCCTT No
MSH2_RE2 2 + 47483593 47483613 GAcCTAGgCg c AGGCATGCgC No
NDRG1 8 ― 134379022 134379053 CCACATGCAC acgcacgagcgc GCACATGAAC Yes
NLRC4 2 ― 32344455 32344474 AGACATGTTC CTGGTAGTTT No NOS3 7 + 150321654 150321676 GAGCcTcCCa gcc GGGCTTGTTC No
ODC1_RE1 2 ― 10505290 10505319 GGGCTcGCCT tggtacagac GAGCggGCCC No
ODC1_RE2 2 ― 10506214 10506238 GGACcAGTTC caggc GGGCgAGaCC No
P2RXL1 22 + 19714729 19714750 GAACAAGggC at GAGCTTGTCT No
P53AIP1 11 ― 128316011 128316030 TCTCTTGCCC GGGCTTGTCG Yes
PCBP4_RE1 3 ― 51971563 51971583 GgtCTTGgCC c AGACTTAGCa No
PCBP4_RE2 3 ― 51972515 51972544 GAACTTAAGA ccgaggctct GGACAAGTTG No
PCNA 20 + 5048821 5048840 GAACAAGTCC GGGCATaTgT Yes
PERP 6 ― 138466900 138466919 AGGCAAGCTC CAGCTTGTTC No
PLAGL1 6 ― 144311857 144311876 CAACTAGACT AGACTAGCTT No
PLK2_RE1 5 ― 57793125 57793147 GGtCATGaTT cct tAACTTGCCT Yes PLK2_RE2 5 ― 57793858 57793877 AAACATGCCT GGACTTGCCC Yes
PLK2_RE3 5 ― 57794080 57794102 AGACATGgTg tgt AAACTAGCTT Yes
PLK3 1 + 45038183 45038208 TAACATGCCC gggcaa AAGCGAGCGC Yes
PML 15 + 72074709 72074736 GcGCTgGCCT ggagccag GGGCATGTCC Yes
PMS2 7 ― 6012202 6012223 ATACTTGATT tg TTTCTTGTAA No
PPM1J 1 ― 113048062 113048081 GAACATGCCT GAGCAAGCCC Yes
PRDM1 6 + 106653151 106653170 GTGCAAGTCT GGACATGTTT Yes
PRKAB1 12 + 118590208 118590227 GTTCTTGCCG CGGCTTGCCT Yes
PTEN 10 + 89613057 89613090 GAGCAAGCCC caggcagctacact GGGCATGCTC Yes
PYCARD 16 ― 31121811 31121832 GTGCAAGCCC ag AGACAAGCAG No
RABGGTA 14 ― 23810330 23810357 CCTCTTGTGG aacgtgca AAGCCTGTCC Yes RB1 13 + 47775970 47775993 GGGCGTGCCC cgac GTGCgcGCgC Yes
RFWD2 1 ― 174445170 174445191 AGACTTGCCT gt GAACAGTCAC No
RPS27L 15 ― 61236487 61236506 GGGCATGTAG TGACTTGCCC Yes
RRM2B 8 ― 103318244 103318263 tGACATGCCC AGGCATGTCT Yes
S100A2 1 ― 151806761 151806780 GGGCATGTgT GGGCAcGTTC Yes
SCARA3 8 + 27564569 27564588 GGGCAAGCCC AGACAAGTTg Yes
SCD 10 + 102096562 102096582 GGGCcgGTCC t GGGCTAGgCT Yes
SCN3B_RE1 11 ― 123016908 123016927 TGGCAAGGCT GAGCTAGTTC No SCN3B_RE2 11 ― 123039640 123039659 TGACTTGCTC TGCCTTGCCT No
SERPINB5 18 + 59294974 59294994 GAACATGTTg g AGGCcTtTTg Yes
SERPINE1 7 + 100556945 100556964 AcACATGCCT cAGCAAGTCC Yes
SESN1 6 ― 109436914 109436933 GGACAAGTCT CCACAAGTCa Yes
SH2D1A_RE1 X + 123305989 123306014 TGGCTGGCTC agctgt CAGCTTGCTT No
SH2D1A_RE2 X + 123305980 123305999 GGGCTGGCTC GGCTGGCTCA No
SH2D1A_RE3 X + 123305966 123305989 AACACTGCAC tagt GGGCTGGCTC No
SLC38A2 12 + 45037706 45037735 AAcCATGCTg ttacacgcac CAGCTTGTCC No
STEAP3 2 + 119719078 119719099 AGACAAGCAT ag GGACATGCTC No
TAP1 6 ― 32929058 32929083 GGGCTTGgCC ctgccg GGACTTGCCT No
TGFA 2 ― 70634503 70634522 GGGCAGGCCC TGCCTAGTCT No TNFRSF10A 8 ― 23138086 23138105 GGGCATGTCC GGGCAgGagg Yes
TNFRSF10B 8 ― 22982080 22982099 GGGCATGTCC GGGCAAGaCg Yes
TNFRSF10C 8 + 23016747 23016766 GGGCATGTCC GGGCAGGACG Yes
TNFRSF10D 8 ― 23077115 23077134 GGGCATGTCT GGGCAGGACG Yes
TP53 17 ― 7531635 7531654 TTACTTGCCC TTACTTGTCA Yes
TP53INP1 8 ― 96020186 96020205 GAACTTGggg GAACATGTTT No
TP63 3 + 190989527 190989549 TAACTTGTTA ttg AAACATGCTC No
TP73_RE1 1 + 3556358 3556385 GtACTTGCCg tccgggga GAACTTGCag Yes
TP73_RE2 1 + 3556376 3556406 GAACTTGCag agtaagctgga GAGCTTGaaT Yes
TP73_RE3 1 + 3597020 3597050 GGGCAAGCTg aggcctgcccc GGACTTGGAT Yes
TRIAP1 12 + 119368523 119368542 CTTCATGTCC GTGCATGCCT Yes
TRIM22 11 + 5668357 5668376 TGACATGTCT AGGCATGTAG Yes
TRPM2_RE1 21 + 44595747 44595771 GGCCTTGCCT tgctc AGGCCTGCTT No
TRPM2_RE2 21 + 44596120 44596152 GAGCAGGTCT gacctgcttccca GGGCCTGCTT No
TRPM2_RE3 21 + 44595752 44595771 TGCCTTGCTC AGGCCTGCTT No
TSC2_RE1 16 + 2041179 2041198 GGGCATGGTG GCACATGCCT No
TSC2_RE2 16 + 2042521 2042553 AGGCTAGTCT gaaactcctgggc TGACGTGACC No
TSC2_RE3 16 + 2052179 2052199 TAACAAGCTC g GGGCTAGCCC No
TYRP1_1 9 + 12683326 12683349 CGCCTAGTTT gggt GAGCAGATTT No
TYRP1_2 9 + 12683340 12683372 GAGCAGATTT gggattaattatc AGGCAGCAAT No
TYRP1_3 9 + 12683373 12683392 CCACATGCAC TTAACAGTTC No
TYRP1_4 9 + 12683314 12683335 AGACCAGCCC cc CGCCTAGTTT No
TYRP1_5 9 + 12683363 12683382 AGGCAGCAAT CCACATGCAC No
UBD 6 ― 29635901 29635920 AGGCATGCTC AGTGGCGTGG No
VCAN 5 + 82804022 82804042 AGACTTGCCA c AGACAAGTCC Yes
VDR_RE1 12 ― 46580342 46580361 TAACTAGTTT GAACAAGTTG No
[image:42.595.91.576.73.646.2]VDR_RE2 12 ― 46580352 46580374 AGGTTAGATG tac TAACTAGTTT No
Table A-1: The 154 experimentally validated p53 response elements (REs) collected