i
UNIVERSITI TEKNIKAL MALAYSIA MELAKA
A STUDY OF THE EFFECT OF INLET PIPE ANGLE IN
CATALYTIC CONVERTER
This report submitted in accordance with requirement of the Universiti Teknikal Malaysia Melaka (UTeM) for the Bachelor Degree of Mechanical Engineering
Technology
(Automotive Technology) (Hons.)
by
MOHD ARIFIN BIN SAMAD B071310509
930617-01-5087
ii
DECLARATION
I hereby, declared this report entitled The study of the effect of inlet pipe angle in Catalytic Converter is the results of my own research except as cited in
references.
Signature :………
Name : Mohd Arifin Bin Samad
iii
APPROVAL
This report is submitted to the Faculty of Engineering Technology of UTeM as a partial fulfilment of the requirements for the degree of Bachelor of Engineering Technology (Automotive). The member of the supervisory is as follow:
iv
ABSTRACT
v
ABSTRAK
vi
DEDICATIONS
vii
ACKNOWLEDGEMENTS
iii
TABLE OF CONTENT
DECLARATION ... ii
APPROVAL ... iii
ABSTRACT ... iv
ABSTRAK ... v
DEDICATIONS ... vi
ACKNOWLEDGEMENTS ... vii
TABLE OF CONTENT ... iii
LIST OF TABLES ... vii
LIST OF FIGURES ... viii
LIST OF ABBREVIATIONS, SYMBOLS AND NOMENCLATURE ... x
CHAPTER 1 ... 1
INTRODUCTION ... 1
1.0 Introduction ... 1
1.1 Background of the Study ... 1
1.2 Problem Statement ... 3
1.3 Objectives of the Study ... 4
1.4 Scope of the Study ... 4
iv
CHAPTER 2 ... 6
LITERATURE REVIEW... 6
2.0 Introduction ... 6
2.1 Study on Catalytic Converter ... 7
2.2 Hydrocarbon(HCs), Carbon Monoxide(CO) and Nitrogen Oxides(NOx) Formation Mechanism from Combustion Engine ... 8
2.3 Effect to Human Health from Exhaust Emissions ... 9
2.3.1 Hydrocarbons(HC) Compound ... 9
2.3.2 Carbon Monoxide(CO) Gas ... 10
2.3.3 Nitrogen Oxides(NO) Compound ... 10
2.4 Type of Catalytic Converter ... 11
2.4.1 Two-Way Catalytic Converter ... 11
2.4.2 Three-Way Catalytic Converter ... 12
2.5 Introduction to Fluid Flow ... 14
2.5.1 Viscosity ... 14
2.5.2 Reynolds Number, Re ... 15
2.5.3 Laminar and Turbulent Flow ... 16
2.5.4 Steady and Unsteady Flow ... 18
2.5.5 Type of Turbulent Model ... 18
CHAPTER 3 ... 20
v
3.0 Introduction ... 20
3.1 Literature Review ... 20
3.2 Design and Geometry Modelling ... 21
3.2.1 Design of Catalytic Converter ... 21
3.2.2 Geometry of the Catalytic Converter ... 22
3.3 CATIA Modelling for Catalytic Converter ... 23
3.4 Meshing Procedures ... 25
3.5 CFD Analysis and Simulation ... 25
CHAPTER 4 ... 27
4.0 Introduction ... 27
4.1 Case Study ... 27
4.2 Pressure Distribution ... 30
4.2.1 Pressure of Mass Flow of Catalytic Converter at 30º degrees ... 30
4.2.2 Pressure of Mass Flow of Catalytic Converter at 45º degrees. ... 32
4.2.3 Pressure of Mass Flow of Catalytic Converter at 60º degrees. ... 35
4.2.4 Result Summary of Pressure Distribution. ... 37
4.3 Velocity Distribution ... 39
4.3.1 Velocity of Mass Flow of Catalytic Converter at 30º degrees ... 39
4.3.2 Velocity of Mass Flow of Catalytic Converter at 45º degrees ... 41
4.3.3 Velocity of Mass Flow of Catalytic Converter at 60º degrees ... 44
vi
4.4 Temperature Distribution ... 48
4.4.1 Temperature of Mass Flow of Catalytic Converter at 30º degrees ... 48
4.4.2 Temperature of Mass Flow of Catalytic Converter at 45º degrees ... 50
4.4.3 Temperature of Mass Flow of Catalytic Converter at 60º degrees ... 52
4.4.4 Result Summary of Temperature Distribution ... 55
4.5 Result from Point Parameter. ... 56
4.5.1 Point of Parameter Result at 30º degrees. ... 57
4.5.2 Point of Parameter at 45º degrees ... 59
4.5.3 Point of Parameter at 60º degrees ... 62
4.6 Limitation ... 65
CHAPTER 5 ... 67
CONCLUSION ... 67
5.0 Introduction ... 67
5.1 Summary of the Study ... 67
5.2 Recommendation for Future Research ... 68
vii
LIST OF TABLES
Table 2. 1: The Ranges of the Reynold Number. ... 16
Table 3. 1: The Catalytic Converter Dimensions (45º degrees). ... 23
Table 4.1: pressure at three different angle geometry of catalytic converter for air. 37 Table 4.2: Pressure at three different angle geometry of catalytic converter for carbon monoxide. ... 37
Table 4.3: Velocity at three different angle geometry of catalytic converter when type of fluid is air. ... 46
Table 4.4: Velocity at three different angle geometry of catalytic converter when type of fluid is air. ... 47
Table 4.5: Temperature at three different angle geometry of catalytic converter when air is type of fluid. ... 55
Table 4.6: Temperature at three different angle geometry of catalytic converter when carbon monoxide is type of fluid. ... 55
Table 4.7: The pressure different between air and carbon monoxide. ... 57
Table 4.8: The velocity different between air and carbon monoxide. ... 58
Table 4.9: The temperature different between air and carbon monoxide... 58
Table 4. 10: The pressure different between air and carbon monoxide. ... 59
Table 4.11: The velocity different between air and carbon monoxide. ... 60
Table 4.12: The temperature different between air and carbon monoxide. ... 61
Table 4.13: The pressure different between air and carbon monoxide. ... 62
Table 4.14: The velocity different between air and carbon monoxide. ... 63
viii
LIST OF FIGURES
Figure 2. 1: Catalytic Converter. ... 8
Figure 2. 2: Laminar Flow. (Typically occurs when the velocity is low or the fluid is very viscous). ... 17
Figure 2. 3: Turbulent Flow. (Considerable mixing occurs, velocities are high.) .... 17
Figure 3.1: The Design of Catalytic Converter. ... 21
Figure 3.2: The Geometry of the Catalytic Converter. ... 22
Figure 3.3: The use interface of CATIA V5. ... 23
Figure 3.4: 30º degree of Inlet Cone of Catalytic Converter. ... 24
Figure 3.5: 45º degree of Inlet Cone of Catalytic Converter. ... 24
Figure 3.6: 60º degree of Inlet Cone of Catalytic Converter. ... 25
Figure 4.1: Model of Catalytic Converter at 30º degrees. ... 28
Figure 4.2: Model of Catalytic Converter at 45º degrees. ... 29
Figure 4.3: Model of Catalytic Converter at 60º degrees. ... 29
Figure 4.4: Pressure Result of Flow Trajectories for Air. ... 30
Figure 4.5: Pressure Result of Flow Trajectories for CO. ... 31
Figure 4.6: Pressure Result in Contour for Air. ... 32
Figure 4.7: Pressure Result in Contour for CO. ... 32
Figure 4.8: Pressure Result in Flow Trajectories for Air. ... 33
Figure 4.9: Pressure Result in Flow Trajectories for CO. ... 33
Figure 4.10: Pressure Result in Contour of Air. ... 34
Figure 4.11: Pressure Result in Contour of CO. ... 34
Figure 4.12: Pressure Result for Flow Trajectories of Air. ... 35
Figure 4.13: Pressure Result in Flow Trajectories of CO. ... 36
Figure 4.14: Pressure Result in Contour of Air. ... 36
Figure 4.15: Pressure Result in Contour of CO. ... 37
Figure 4.16: Graph of Pressure Distribution Among Three Different Geometry of Catalytic Converter. ... 38
Figure 4.17: Velocity Result of Flow Trajectories of Air. ... 39
ix
Figure 4.19: Velocity Result in Contour for Air. ... 41
Figure 4.20: Velocity Result in Contour for Carbon Monoxide. ... 41
Figure 4.21: Velocity Result of Flow Trajectories of Air. ... 42
Figure 4.22: Velocity Result of Flow Trajectories of Carbon Monoxide. ... 42
Figure 4.23: Velocity Result in Contour for Air. ... 43
Figure 4.24: Velocity Result in Contour for Carbon Monoxide(CO). ... 43
Figure 4.25: Velocity Result for Flow Trajectories of Air. ... 44
Figure 4.26: Velocity Result for Flow Trajectories of Carbon Monoxide. ... 45
Figure 4.27: Velocity Result in Contour for Air. ... 45
Figure 4.28: Velocity Result in Contour of Carbon Monoxide. ... 46
Figure 4.29: Graph of Velocity Value Among Three Geometry of Catalytic Converter. ... 47
Figure 4.30: Temperature Distribution for Flow Trajectories of Air. ... 48
Figure 4.31: Temperature Distribution Flow Trajectories of Carbon Monoxide. ... 49
Figure 4.32: Temperature Result in Contour for Air. ... 49
Figure 4.33: Temperature Result in Contour for Carbon Monoxide. ... 50
Figure 4.34: Temperature Result for Flow Trajectories of Air. ... 51
Figure 4.35: Temperature Result for Flow Trajectories of Carbon Monoxide. ... 51
Figure 4.36: Temperature Result of Contour for Air. ... 52
Figure 4.37: Temperature Result of Contour of Carbon Monoxide. ... 52
Figure 4.38: Temperature Result for Flow Trajectories of Air. ... 53
Figure 4.39: Temperature Result for Flow Trajectories of Carbon Monoxide. ... 53
Figure 4.40: Temperature Result for Contour of Air. ... 54
Figure 4.41: Temperature Result for Contour of Carbon Monoxide. ... 54
Figure 4.42: Graph of Temperature Distribution Among the Three Geometry of Catalytic Converter. ... 56
Figure 4.43: Graph of Pressure vs Length... 57
Figure 4.44: Graph of Velocity vs Length. ... 58
Figure 4.45: Graph of Temperature vs Length. ... 59
Figure 4.46: Graph of Pressure vs Length... 60
Figure 4.47: Graph of Velocity vs Length. ... 61
Figure 4.48: Graph of Temperature vs Length. ... 62
Figure 4.49: Graph of Pressure vs Length... 63
Figure 4.50: Graph of Velocity vs Length. ... 64
x
LIST OF ABBREVIATIONS, SYMBOLS AND
NOMENCLATURE
TDC - Top Dead Centre BDC - Bottom Dead Centre NOx - Nitroxide
Cox - Carbon monoxide
HC - Hydrocarbon
H2O - Water
CO2 - Carbon dioxide
CFD - Computational Fluid Dynamic CAD - Coronary artery diseases
O3 - Ozone
TWC - Three-way Catalytic converter A/F - Air-fuel ratio
DNS - Direct numerical simulation
CATIA - Computer Aided Three-dimensional Interactive Application CAE - Computer-Aided Engineering
K-ε - K-epsilon
K-ω - K-omega
V - velocity
D - Diameter of pipe
xi
𝜌 - Density of fluid
µ - Dynamic viscosity of fluid ƒ - Friction factor
Re - Reynolds number
K - Kelvin
Mm - Millimeter
1
CHAPTER 1
INTRODUCTION
1.0 Introduction
This chapter introduced the background of the study about the fluid flow inside the catalytic converter. Next, the problem statements of this study is discussed. After that, the objectives and the scopes of the study is explained. Finally, outlines of the report is presented.
1.1 Background of the Study
2 Meanwhile, waste product is an unwanted substances or material produced during the combustion process. The waste product from the combustion can called as fluid in form of gases. The gases contain chemical material such as nitroxide(NOx), carbon monoxide(COx) and unburned hydrocarbon(HC). This gas can cause air pollution and effect to environments. The quantity of the waste product produces depends on the ratio of air-fuel mixture. There are three type of ratio of air-fuel mixture such as 14.7:1 stoichiometric (good mixture of air and fuel), 15:1 when more oxygen than fuel and 13:1 when the fuel is more than the air during mixture. When the ratio of air-fuel mixture is higher and lower than 14.7 it will cause unperfect combustion in engine. Unperfect combustion usually produce more quantity of waste products and will increase the air pollution level and bad to the environments. From this situation, the automotive engineers have tried to solve the problem by checking exhaust gas product and think how it can control for not harmful to environments.
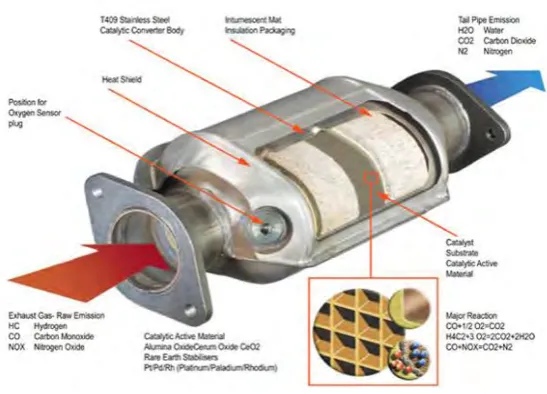
By adding the catalytic converter in the middle of exhaust pipe it can reduce the waste product from emission to environments. Catalytic converter can be defining as an automobile exhaust-system component containing a catalyst that causes conversion of harmful gases into mostly harmless products as water (H2O) and carbon dioxide (CO2). They provide a filter inside the body or substrate known as honeycomb. The honeycomb that react with the waste product as catalyst can convert to less harmful gases.
3 show the characteristic dynamic flow was different from those under steady flow condition in catalytic converter, (Lee et al. 2002).
This study aims to design and model different angles inlet pipe in catalytic converter. Then the fluid flow behaviour in the catalytic converter will be investigated. Previous study has shown that, the harmful emissions gases from engines such as nitrogen oxides, hydrocarbons, and carbon monoxide are because of incomplete combustion, (Naveenkumar et al. 2015). Recent catalytic converters are substrate coated with platinum, rhodium, or palladium, which are nobel metals and expensive. Due to non-uniform flow inside the catalytic converter, the outer most region of substrate are less reactant to the emission by utilizing these regions we may able to increase the efficiency and life span of the converter, (Bahrami, 1948). The study about inlet flow of catalytic converter is to ensure the suitable design for product in automotive field. The design of catalytic converter is critical which require a deep understanding of fluid flow inside the catalytic converter in order to determine the optimum or maximum use set of the catalytic converter.
1.2 Problem Statement
4 experimental investigation of internal flow devices. (R & Ramsai, 2012). Thus, this study aims to determine the optimum geometry design of catalytic converter by using numerical approach which are cost effective and time-saving.
1.3 Objectives of the Study
The objectives of this study are:
1. To design and model three different angles of inlet pipe in catalytic converter by using CATIA software.
2. To simulate numerically the fluid flow interaction in three different angles of inlet pipe in catalytic converter by using SolidWorks.
3. To determine the optimum geometry between three different angles of inlet pipe in catalytic converter that give most significant effect on flow distribution.
1.4 Scope of the Study
5
1.5 Outline of the Report
This report is divided into five chapter including this introductory chapter. Chapter 1 briefly discusses some geometric introduction and highlight the objectives of this study, also the problem statement and scope of the study.
Chapter 2 makes review about the literature review of this study, meanwhile some mathematical formulation which describes on model descriptions is discussed in Chapter 3.
Followed by Chapter 4, complete pre-processing results of the problem is obtained in details and will be discussed briefly.
6
CHAPTER 2
LITERATURE REVIEW
2.0 Introduction
This paper deals with the study of flow inside the catalytic converter. The flow inside the converter is non-uniform due to the geometry of the catalytic converter. From the previous study, analysis of real time catalytic converter is more expensive and if there is any error we have to change the whole model (Naveenkumar et al. 2015). Thus, by using SolidWorks Software, it is easy to identified the errors and rectifying it in an easy way. The catalytic converters are consisting of substrate at the centre through which the conversion of pollutant gases will take place. At the point when the smoldered gasses go into the exhaust system of certain speed it will specifically hit the substrate at the inside and synthetic responses will occur. The separation between the substrate and the way out of the bay cone is less so the gas hit the middle segment of the substrate. By this only the middle part of the substrate is responded to the delta gasses, so the stream partition at the gulf is not adequate to extend the stream in all the surfaces of the substrate so that there will be uniform stream inside the converter.
7 of the inlet cone forming the backpressure. This increase in backpressure causes increase in fuel consumption, (Karuppusamy et al. 2013). It is very difficult to achieved a good flow distribution at the inlet cross section of the catalyst substrate. Therefore, it is important to study the effect of the geometry of the catalytic converter on flow uniformity in the substrate.
2.1 Study on Catalytic Converter
First of all, the catalytic converter is employed in a wide variety of industrial engines, including engines used for power generation, co-generation, gas compression and other stationary and industrial applications (Chen et al. 2004). Based on previous paper, in recent year advances have been made in computer modelling of catalytic converters to assist in design optimization, with most of this work focused toward the automotive industry, (Wanker et al. 2002). According to (Karuppusamy et al. 2013), the catalytic converter can be defined as vehicle emission control device which is to convert the toxic gases from the combustion engine to harmless substances by way of catalysed chemical reactions. Next, the catalytic converters are used with internal combustion engines fuel by either petrol or diesel including as well as kerosene heaters and stoves. Inside the converter body contains some materials called honeycomb that function as catalyst for neutralize the toxic pollutants to become harmless substances. The honeycomb monolith is also available in different cell densities and shapes offering potential flexibility. (Karuppusamy et al. 2013).
8 They are additionally utilized on some wood stoves to control outflows. This is as a rule in light of government control, either through direct natural direction or through wellbeing and security directions. Figure 2.1 below shows an example of catalytic converter.
Figure 2. 1: Catalytic Converter.
2.2 Hydrocarbon(HCs), Carbon Monoxide(CO) and Nitrogen Oxides(NOx) Formation Mechanism from Combustion Engine