FV: 121218
Developing a local flood risk management strategy
Annex 2: Flood risk
management
Pennine Water Group, University of Sheffield in collaboration
with the partners of the FloodResilienCity and MARE projects
Co funded by the European Union through the European Regional Development Fund
FV: 121218
Written by: John Blanksby, Pennine Water Group, Department of Civil and Structural Engineering, University of Sheffield, UK With input from members of the Pennine Water Group and partners of the FRC and MARE projects.
Final review by Karin Stone, Deltares, Netherlands
If you have any comments or suggestions to enhance this document please email John Blanksby at [email protected]
The opinions expressed within this document are those of the author and do not reflect the corporate opinions and policy of the University of Sheffield or the other partners in the FRC, and MARE projects
FV: 121218
Table of Contents
1 Introduction. ... 1
2 The challenge of flood risk management... 1
3 The aims of the flood risk management process and how to achieve them. ... 1
3.1 Agree the approach by which flood risk will be managed including procedures and measures ... 2
3.2 Identify current and potential future risks, and who is responsible for the management of those risks ... 2
3.3 Develop the most effective way of managing the risk, irrespective of whose responsibility it is ... 7
3.4 Implement the necessary measures to manage the risk ... 7
FV: 121218 1
1
Introduction.
The EU Flood Directive1 requires member states to develop flood risk management plans by 22nd December 2015. Along the way, member states are required to carry out preliminary flood risk assessments by 22nd December 2011, and detailed flood risk and hazard maps by 22nd December 2013. Following these initial submissions, the assessments, maps and plans will be reviewed and updated in six yearly cycles.
Many countries have already carried out preliminary assessments and produced flood risk and hazard maps for coastal and river flooding. However, there is a general need to align flood risk management across all types of flooding and a specific need for support for the development of flood risk management plans in urban areas where risks to people and properties are greatest. Here there are many different forms of flooding and there is a need for insights into the interactions between all
1
DIRECTIVE 2007/60/EC OF THE EUROPEAN PARLIAMENT AND OF THE COUNCIL, of 23 October 2007 on the assessment and management of flood risks
of these. This is an introduction to flood risk management, why it’s so important and an approach for the development of local flood risk management strategies
2
The challenge of flood risk
management.
Flood risk management is complex and decisions made now are likely to become embedded in the urban fabric for many years to come. Such decisions may involve
considerable expenditure and it may be some considerable time before it becomes
practicable to address the impacts of the implementation of inappropriate measures. Therefore, as well as addressing current flood risk it makes sense to consider future drivers of change, the main ones of which are recognised as being climate change,
population and development growth and the changing nature of our cities:
The main concerns about the impact of climate change on flood risk relate to increases in sea level and greater depths and intensities in rainfall, although this is by no means relevant to all cities.
Increasing urbanisation as a response to changing socio economic drivers is also perceived as a potentially significant problem in our cities.
As well as the problems caused by future uncertainties, there are also problems caused by current attitudes to flooding. These include
People forgetting, or choosing to forget what happened during previous floods
Administrations failing to realise the likelihood and consequence of extreme floods
The cost of implementing appropriate flood risk management measures Whatever the current and future flood risk, there will always be national, regional and local differences. Therefore, each City and County should develop its own local strategy for Flood Risk Management.
3
The aims of the flood risk
FV: 121218 2 1. agree the approach by which flood risk
will be managed including procedures and measures of flood risk,
2. identify current and potential future risks, and who is responsible for the
management of those risks, 3. develop the most effective way of
managing the risk, irrespective of whose responsibility it is, and
4. implement the necessary measures to manage the risk
However, the process doesn’t stop once the initial measures have been implemented. As the drivers of change bring new challenges, it will be necessary to reappraise the position and repeat the process to identify and implement new measures where these are required.
The rest of this section suggests why it is important to achieve these aims, and where relevant introduces how it can be done.
3.1
Agree the approach by which
flood risk will be managed
including procedures and
measures
Without this nothing will happen. The stakeholders will need to agree how to manage the work and communicate, and also the measures by which flood risk will be assessed and prioritised. These could include the frequency and or consequences of flooding that will trigger action, and the targets that will be used to compare different options for flood risk reduction.
3.2
Identify current and potential
future risks, and who is
responsible for the
management of those risks
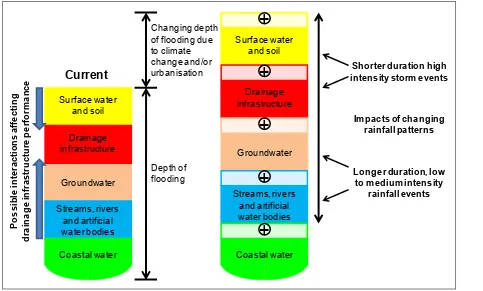
Responsibility for managing flood risk depends on the ownership of land and water bodies and also who is responsible for themanagement of the different aspects of land and water management which are listed in Table 1. However, a flood incident may have several causes, and in order to fairly attribute the causes of flooding and hence identify who should pay for the management of a problem, it is necessary to assess and analyse the
problem using appropriate techniques. Figure 1 provides a graphical illustration of how the output of such an analysis may be
FV: 121218 3 Surface water and soil Drainage infrastructure Groundwater Streams, rivers and artificial water bodies Coastal water
+
+
+
+
+
Surface water and soil Drainage infrastructure Groundwater Streams, rivers and artificial water bodies Coastal water Depth of flooding Changing depth of flooding due to climate change and/or urbanisation P o s s ib le in te ra c ti o n s a ff e c ti n g d ra in a g e in fr a st ru ct u re p e rf o rm a n ce CurrentImpacts of changing rainfall patterns
Longer duration, low to medium intensity
rainfall events Shorter duration high intensity storm events
Rural green space
Green space at urban fringe
Green space within urban area
Developed urban surface
[image:8.842.106.589.122.413.2]Sub divisions of surface water and soil
Figure 1: Flood component analysis – framework for identifying causes and attributing responsibility for problems (David Wilson2)
FV: 121218 4
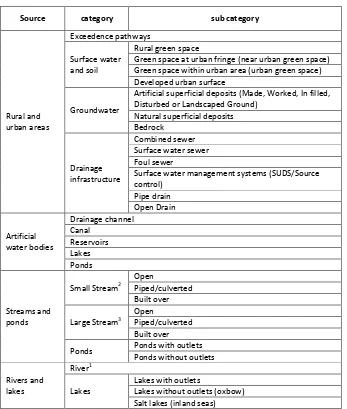
Table 1a: Inland flooding
Source category sub category
Rural and urban areas
Exceedence pathways
Surface water and soil
Rural green space
Green space at urban fringe (near urban green space) Green space within urban area (urban green space) Developed urban surface
Groundwater
Artificial superficial deposits (Made, Worked, In filled, Disturbed or Landscaped Ground)
Natural superficial deposits Bedrock
Drainage infrastructure
Combined sewer Surface water sewer Foul sewer
Surface water management systems (SUDS/Source control) Pipe drain Open Drain Artificial water bodies Drainage channel Canal Reservoirs Lakes Ponds Streams and ponds
Small Stream2
Open
Piped/culverted Built over
Large Stream3
Open
Piped/culverted Built over
Ponds Ponds with outlets
Ponds without outlets
Rivers and lakes
River1
Lakes
Lakes with outlets
Lakes without outlets (oxbow) Salt lakes (inland seas)
Table 1b: Coastal flooding
Source category sub category
Coastal
Open sea Estuaries Deltas
Fjords and inlets
Notes on inland flooding
River, stream and coastal flooding only occur in limited areas and for relatively short periods of time. In all other areas and at all other times flooding is classified as rural and urban area flooding
1 In this context a river is a body which drains sufficient area and has sufficient time of concentration to make flood warning a viable flood risk management option, whereas flood warning is not a viable option for a stream
2 A small stream is defined as a watercourse which is considered to be too small for inclusion in flood zone mapping required by the EU Flood Directive
3 A large stream is defined as a watercourse which is considered to be sufficiently large for inclusion in flood zone mapping required by the EU Flood Directive
[image:9.842.434.782.92.169.2]FV: 121218 5 In addition to the different flood components,
Figure 1 illustrates how climate change and urbanisation may change flood depths in the future and how different “types” of rainfall affect different flood components.
In order to attribute the responsibility for flood risk, it is necessary to arrive at agreed performance standards for the different flood components. These are illustrated in Figure 2, in which the term performance may be viewed from the perspectives of the likelihood of flooding or flood risk. However, of the two, the likelihood of flooding provides a more obvious and straightforward way of managing the boundaries between the different flood components and the responsible
organisations.
There is no standard approach, but in the absence of local or national standards, Table 2 may be used as a starting point. In Table 2, the identified standards have been drawn from a number of sources, but the aim is to develop consistency of approach across the different flood components.
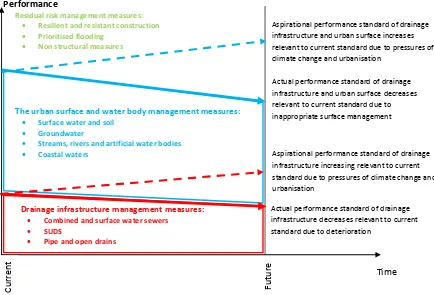
Figure 2: Aspirational performance of the drainage infrastructure, urban surfaces, water bodies and residual risk management measures.
Figure 2 represents drainage infrastructure (also known as the minor drainage system) in red and urban surfaces and different types of water body (known as the major drainage system) in blue. In this example, increasing pressures due to climate change and urbanisation are shown by the dashed lines and require increases in performance relative to current standards.
Cu
rren
t
Fu
ture
The urban surface and water body management measures: Surface water and soil
Groundwater
Streams, rivers and artificial water bodies
Coastal waters
SUDS
Pipe and open drains
Performance
Time Aspirational performance standard of drainage infrastructure and urban surface increases relevant to current standard due to pressures of climate change and urbanisation
Actual performance standard of drainage infrastructure and urban surface decreases relevant to current standard due to inappropriate surface management
Aspirational performance standard of drainage infrastructure increasing relevant to current standard due to pressures of climate change and urbanisation
Actual performance standard of drainage infrastructure decreases relevant to current standard due to deterioration
Residual risk management measures: Resilient and resistant construction Prioritised flooding
Non structural measures
Drainage infrastructure management measures:
Combined and surface water sewers
SUDS
FV: 121218 6 However, the actual performance shown by the solid line reduces
[image:11.842.430.766.70.375.2]because of deterioration of the drainage infrastructure and inappropriate management of the urban surface. This increases the need for residual risk management methods to maintain the same level of performance.
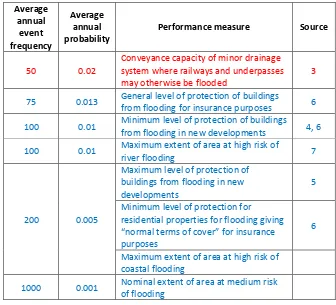
Table 2: Nominal standards of performance for minor and major drainage systems Average annual event frequency Average annual probability
Performance measure Source
10 0.1 Conveyance capacity of minor drainage
system in rural areas. 3
20 0.05
Conveyance capacity of minor drainage system in residential areas (presumably at periphery of drainage system).
3
25 0.04 Functional flood plain on which no
building should take place 4
30 0.33
Conveyance capacity of new minor
drainage systems in residential areas 5, 6 Conveyance capacity of minor drainage
systems in city centre/commercial areas (and presumably residential areas at core of system).
3
3
EN 752 (2008)
4
Development and flood risk practice guide: Planning policy statement 25, Communities and Local Government (2009) UK
5
Sewers for Adoption 6th Edition (WRc, 2006) and Sewers for Scotland 2nd Edition (WRc, 2007) UK
Average annual event frequency Average annual probability
Performance measure Source
50 0.02
Conveyance capacity of minor drainage system where railways and underpasses may otherwise be flooded
3
75 0.013 General level of protection of buildings
from flooding for insurance purposes 6
100 0.01 Minimum level of protection of buildings
from flooding in new developments 4, 6
100 0.01 Maximum extent of area at high risk of
river flooding 7
200 0.005
Maximum level of protection of buildings from flooding in new developments
5
Minimum level of protection for residential properties for flooding giving “normal terms of cover” for insurance purposes
6
Maximum extent of area at high risk of coastal flooding
1000 0.001 Nominal extent of area at medium risk of flooding
Note: Items in red refer to minor drainage system performance and those in blue refer to the major drainage system
6 Association of British Insurers
FV: 121218 7
3.3
Develop the most effective
way of managing the risk,
irrespective of whose
responsibility it is
The different service providers who have a stake in flood risk management are all funded by the same people. This makes it incumbent on the service providers to work together to provide the most cost effective and beneficial way of achieving agreed objectives,
irrespective of who the ownership of the risk. It is up to the service providers to develop appropriate mechanisms to transfer the required funding between each other. The potential impact of increasing runoff due to climate change and future hardening of urban surfaces can be catered for in the design of new developments. However, the main challenge lies within our current urban areas, especially where it is not possible to adapt current minor and major system assets to enhance their performance. It would not be economically feasible to upgrade our current combined sewer systems and the associated disruption would also be prohibitive; so the answer to the impact of climate change and to urbanisation lies in a change in the culture of urban design. If the increasing flood risk is to
be managed, then water will need to be managed on the urban surface. There also needs to be more focus on the management of residual risk.
3.4
Implement the necessary
measures to manage the risk
Once the stakeholders have agreed what they are responsible for and the most effective measures for managing flood risk have been identified, the next step is to develop a strategy for implementation. This is easy to say, but difficult to achieve. However,providing that the stakeholders recognise that they are all serving the same communities, then it should be possible to align their activities sufficiently to achieve a common goal.
It is important to make sure that stakeholders are made aware that they need to engage in the process, otherwise it will be difficult to take account of their concerns when developing and implementing measures.
4
Towards a local strategy
The danger in a document like this is to try and prescribe a strategy for everyone to adopt. However, there is no attempt to fall
into this trap. Strategies should be designed to address local circumstances and given the uncertain nature of the drivers of flood risk, should be adaptable and make provision for emerging issues. Local strategies should also take account of national and transnational demands, such as those for the
implementation of the EU Floods Directive alongside the implementation of the EU Water Framework Directive8. So what might a local strategy include? Here are a few
suggestions.
From a task based perspective:
1. The initial planning required in order to determine the priorities for the
identification of flood risk, the
development and selection of options and the implementation of measures, and who should participate in these activities. 2. Diagnostic studies to identify and
attribute responsibilities for current and
8
FV: 121218 8 future flood risk, and to establish a
consensus on the problems and the need to address them.
3. The development and assessment of an appropriate set of options to address the identified problems.
4. The development of a programme to implement the preferred options within a strategy to address ongoing emergent issues (e.g. through the planning and building control processes), including the management of residual risk (e.g. through awareness raising, capacity building and emergency response).
From people and resource based perspectives: 1. The identification of who should do what
in order to achieve the objectives of flood risk management. The roles of
organisations and departments within organisations should be identified. 2. The identification of who should
communicate with whom, so that an appropriate, effective and efficient communication system, covering data and information sharing and decision making, can be resourced.
3. The identification of the tools needed to manage and transform data and
information, and carry out the
assessments associated with the tasks to be undertaken
4. The identification of the skills needed to achieve all this.
5. The identification of the current
competencies and the implementation of a programme of capacity building to develop the required proficiencies, including sharing (and the cost of developing) knowledge, experience and resources with others.