City, University of London Institutional Repository
Citation
:
Ye, X., Lin, X., Dehmeshki, J., Slabaugh, G. G. and Beddoe, G. (2009).
Shape-Based Computer-Aided Detection of Lung Nodules in Thoracic CT Images. IEEE
Transactions on Biomedical Engineering, 56(7), pp. 1810-1820. doi:
10.1109/TBME.2009.2017027
This is the accepted version of the paper.
This version of the publication may differ from the final published
version.
Permanent repository link:
http://openaccess.city.ac.uk/4386/
Link to published version
:
http://dx.doi.org/10.1109/TBME.2009.2017027
Copyright and reuse:
City Research Online aims to make research
outputs of City, University of London available to a wider audience.
Copyright and Moral Rights remain with the author(s) and/or copyright
holders. URLs from City Research Online may be freely distributed and
linked to.
SHAPE-BASED CT LUNG NODULE SEGMENTATION USING FIVE-DIMENSIONAL MEAN
SHIFT CLUSTERING AND MEM WITH SHAPE INFORMATION
Xujiong Ye, Musib Siddique, Abdel Douiri, Gareth Beddoe, Greg Slabaugh
Medicsight PLC, 66 Hammersmith Road, London, W14 8UD, United Kingdom
ABSTRACT
This paper presents a joint spatial-intensity-shape (JSIS) feature-based method for the segmentation of CT lung nodules. First, a volumetric shape index (SI) feature based on the second-order partial derivatives of the CT image is calculated. Next, the SI feature is combined with spatial and intensity features to form a five-dimensional feature vectors, which are then clustered using mean shift to produce intensity and shape mode maps. Finally, a modified expectation-maximization (MEM) algorithm is applied on the mean shift intensity mode map to merge the neighboring modes with spatial and shape mode maps as priors.
The proposed method has been evaluated on a clinical dataset of thoracic CT scans that contains 80 nodules. A volume overlap ratio between each segmented nodule and the ground truth annotation is calculated. Using the proposed method, the mean overlap ratio over all the nodules is 0.81 with standard deviation of 0.05. Most of the nodules, including challenging juxta-vascular and juxta-pleural nodules, can be properly separated from adjoining tissues.
Index Terms— Mean shift, mode map, expectation-maximization (EM), lung nodule, shape index, shape prior.
1. INTRODUCTION
Accurate lung nodule segmentation provides a solid base for detection, feature calculation, classification in lung Computer Aided Detection (CAD) systems. However, nodule segmentation is a challenging task in medical imaging, particularly when the object has low contrast, a small size, or is located within an area of complicated anatomy [1]. For example, it becomes difficult to properly separate a nodule from adjoining tissues that have similar intensity characteristics, such as a blood vessel (juxta-vascular nodule) and the lung wall (juxta-pleural nodule).
Several approaches have been reported in literature for the segmentation of lung nodules [2-5]. Most of them are based on the pixel intensity in the image domain and use either region growing or model-based methods to segment the nodule boundary. In [2], an adaptive sphericity oriented contrast region growing method was used to segment the nodule boundary. The region growing operates on the fuzzy
connectivity map within a volumetric mask. Other approaches based on deformable surfaces can be found in [3]. To increase robustness, several methods impose an a priori model; for example, the approaches described in [4][5] utilize shape models for spherical and ellipsoidal nodules respectively. However, such models are limiting in that not all types of lung nodules are accurately represented with these shapes.
In this paper, we have developed a novel segmentation method that combines shape, image intensity, and spatial position to automatically segment lesions. The proposed algorithm has the following steps: it (1) calculates volumetric shape index (SI) at each voxel; (2) combines the SI with the intensity and the spatial position (x, y, z) to form a five-dimensional feature vector; (3) computes both the intensity mode map and shape index mode map (the densest regions) using the five-dimensional mean shift framework; (4) employs modified expectation-maximization algorithm (MEM) to merge the neighbouring modes on the intensity mode map. The MEM algorithm combines both the spatial intensity as well as the shape mode in the prior probability. The joint spatial–intensity-shape (JSIS) feature provides rich information for the object segmentation. The experimental results on a CT lung nodule dataset demonstrate the high performance of the proposed method.
2. METHODOLOGY
2.1. Volumetric shape index: a 3D geometric feature
The volumetric shape index (SI) at voxel p(x,y,z)can be defined as [6][7]:
( )
( )
( )
( )
p k( )
p kp k p k p
SI
2 1
2 1
arctan 1 2 1
− + −
=
π
(1)where k1
( )
p and k2( )
p are the principal curvatures at voxel p, which are defined as:( )
p H( )
p H( ) ( )
p K pk1 = + 2 − , k2
( )
p =H( )
p − H2( ) ( )
p −K psmoothed first and second partial derivatives of the image as described in [7].
Shape index represents the local shape feature at each voxel while being less sensitive to the image intensity. Every distinct shape, except for the plane, corresponds to a unique SI. For example, the SI value is 1.00 indicates a sphere-like shape (e.g. nodule), and 0.75 indicates a cylinder-like shape (e.g. vessel). Based on the definition, volumetric shape index directly characterizes the topological shape of an iso-surface in the vicinity of each voxel without explicitly calculating the iso-surface. This feature provides rich information for automated object segmentation in medical images, especially when image intensities of different shapes are very similar to each other (e.g. adjoining nodule).
2.2. Joint spatial-intensity-shape feature under the mean shift framework
The mean shift framework provides a very effective methodology for feature space analysis. Initially developed by Fukunaga and Hostetler [8], mean shift has recently been exploited in low level computer vision tasks by Comaniciu and Meer ([9]). In this paper, the joint spatial-intensity-shape (JSIS) feature is clustered using five-dimensional mean shift framework.
For each voxel, 3D spatial location, intensity and volumetric shape index features are concatenated in the joint spatial-intensity-shape domain of dimension d=5. Given n
data pointsxi, i=1,…,n on a five-dimensional space R5, (where n is the total number of voxels), the multivariate kernel is defined as the product of three radially symmetric kernels:
( )
¸¸ ¹ · ¨ ¨ © § ⋅ ¸ ¸ ¹ · ¨ ¨ © § ⋅ ¸ ¸ ¹ · ¨ ¨ © § = 2 2 2 5 , si si r r s s k h h h h x k h x k h x k c xK sr si (2)
where
c
k,5is a normalization constant which assures K(x)integrates to 1. xsis the spatial location, xris the intensity
and xsiis the shape index feature;
k
(x
)
is the common profile used in all the domains; hs, hrand hsiare the kernel window size for spatial, intensity and shape index kernel function, respectively. The Normal kernel is used in thispaper, where
( )
¸¹ · ¨
© §−
= − /2 2
2 1 exp ) 2 ( x x
k π d .
By using the mean shift framework, the shape index feature can be combined with the intensity for object segmentation. The mean shift vector with three kernel windows (spatial, intensity and shape index) can then be calculated as:
( )
in i si si r r s s n i si si r r s s i i h h h x h x g h x g h x g h x g h x g h x g x x
ms rsi −
¸ ¸ ¸ ¹ · ¨ ¨ ¨ © § ⋅ ¸ ¸ ¸ ¹ · ¨ ¨ ¨ © § ⋅ ¸ ¸ ¸ ¹ · ¨ ¨ ¨ © § ¸ ¸ ¸ ¹ · ¨ ¨ ¨ © § ⋅ ¸ ¸ ¸ ¹ · ¨ ¨ ¨ © § ⋅ ¸ ¸ ¸ ¹ · ¨ ¨ ¨ © § =
¦
¦
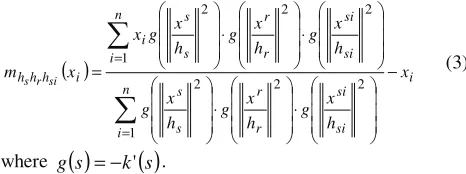
= = 1 2 2 2 1 2 2 2 (3)where g
( )
s =−k'( )
s .It is noted that mean shift procedure is an adaptive gradient ascent method. It always points toward the direction of the maximum increase in the density function. The mean shift algorithm estimates the modes (the densest regions) of the multivariate distribution underlying the feature space. The set of points that converge to the same mode is defined as the attraction basin. Mean shift maps all the data samples to the local maxima of their corresponding attraction basin, which is called mode map.
In this paper, two mode maps are calculated based on the joint JSIS mean shift clustering, namely an intensity mode map (Mi) and a shape index mode map (Msi). Both mode
maps represent the local densest regions under corresponding intensity and shape features in the five-dimensional feature space.
(a) (b) (c ) (d)
(e) (f)
(g) (h)
(i) (j)
Fig.1. One attached nodule with its intensity and shape mode maps determined with five-dimensional mean shift clustering. (a) Original CT sub-image; (b) Shape index map based on Eq. (1); (c) and (d) Intensity mode map and shape index mode map; (e) and (f) Intensity values and intensity mode values at the same voxel in the nodule; Shape index values for the nodule (g) and the attached vessel (i); and its corresponding shape index mode values for the same voxel in the nodule (h) and vessel (j), respectively.
[image:3.612.315.548.72.159.2]To illustrate the characteristics of both mode maps, Figure 1 shows an example of one nodule attached to vessels and its corresponding intensity and shape index mode maps by using five-dimensional JSIS mean shift clustering; (e) and (f) are the intensity values and intensity mode values for the same voxel in the nodule. (g) and (i) are shape index values for the nodule and vessel, respectively; while (h) and (j) are the corresponding shape index mode values. Compared to (e), (g) and (i), it is noted that the mode maps ((f), (h) and (j)) from five-dimensional JSIS mean shift clustering can be seen as “filtered” images and are less contaminated by outliers.
2.3. Modified expectation-maximization with spatial and shape priors using mean shift mode maps
The intensity mode map (Mi) obtained by the above JSIS
mean shift algorithm expresses the local structure of the data in the feature space. The number of modes depends on the kernel window size and the data structure. Although this number is a large compression of the initial data, sometimes it is still larger than the targeted number of classes (as shown in Figure 1 (c) or (f)). In this sub-section, to merge neighboring modes, a mixture Gaussian model with modified expectation-maximization (MEM) that considers not only spatial but also shape information is applied on the intensity mode map from mean shift clustering. Based on the Bayesian probability theory, for each mode, the probability of the mode belonging to one class is defined as:
(
)
(
)
( )
( )(
)
( )
( ) m i p M p p M p M p l i l l i l i l l i l il , =1,2,...,
⋅ ⋅ =
¦
ϕ ϕϕ ϕ
ϕ (4)
where, m is the total number of the modes in the mean shift intensity mode map, l is the class number, here, three classes (l∈[1,3]) for object (nodule), vessel and background (lung
tissue), is considered. pl
(
Miϕl)
is lth Gaussian model withparameter φl =(μl,σl) (mean μl and standard deviation
l
σ ), and p
( )
ϕl( )i is a prior probability.The prior probability p
( )
ϕl( )i plays an important role in Equation (4). The prior can be constrained by spatial information, which can be imposed by a Markov RandomField and Gibbs Random Field (MRF-GRF) [10] as follows:
( )
( )
( )
( )( )
( )
¦
¦
¦
» ¼ º « ¬ ª − » ¼ º « ¬ ª − = ≈ i i l c i c c i c N i i l l v l v l l p p exp expϕ (5)
where N
( )
i is the neighbourhood of mode i. vc( )
li is a potential function associated with the clique c which is defined as( )
(
i)
l i
cl p M
v =−β ⋅ ϕ . (6)
In Equation 6, β is an important factor that controls the size of clustering. Usually, a fixed value is used. In this
paper, we adaptively control the size of clustering based on the neighboring shape information. The details are as below.
From Figure 1 (d), (h) and (j), it is noted that the shape index mode map (
si
M ) from mean shift clustering can be seen
as a “filtered” image of shape index map. A shape weighting factor (
w
si) is defined as¦
⋅ = c si c si si i N M N i M i w )) ( ( 1 ) ( )( (7)
where Msi
( )
i is shape index mode value at mode i, and N( )
iis the neighbourhood of mode i in shape index mode map. The weighting factor
w
simeasures the local shapevariance. If a voxel under consideration has a similar shape as that of the neighborhood voxels, the weighting factor is closer to 1. We define βin Equation (6) as:
( )
1 if , ) ( 1 1 if , ) ( °¯ ° ® < ⋅ > ⋅ = si si si si w i w a w i w a iβ
, (8)Here, a is a positive constant.
From Equation (8), it is noted that, for each voxel, the size of the neighbourhood is chosen based on the shape weighting factor. If the voxel has a similar shape as that of the neighbourhood voxels, thenβis small, which means a small size of the neighbourhood is used. Otherwise, when βis large, it indicates different shapes between the voxel and its neighbourhood, and a larger size is used in the MRF-GRF. Since the shape weighting factor controls the size of clustering in Equation (6), the prior probability in Equation (5) can be rewritten as follows:
( )
( )
( )
( )(
)
(
)
¦
¦
¦
» ¼ º « ¬ ª ⋅ » ¼ º « ¬ ª ⋅ = ≈ i i l c i l c i l N i i l M p i M p i l l p p ϕ β ϕ β ϕ ) ( exp ) ( exp (9)By adaptively controlling the size of clustering based on its local shape features from the shape index mode map (
si
M ), the prior probability not only depends on the spatial
information, but also the shape feature. This provides better segmentation compared to only considering the spatial information using the intensity mode map (Mi).
3. EXPERIMENTAL RESULTS
Figure 2 shows examples of nodule segmentation on three different attached nodules. For comparison, the segmentation results based on four-dimensional mean shift without the shape index feature are given in the second column of this figure. Also, the results from the proposed shape based method are shown in the third column of Figure 2. It is noted that, there is no explicit threshold applied to the shape index for the segmentation. This feature is combined into mean shift framework, and the produced shape index mode map from five-dimensional mean shift clustering is then used in prior probability for MEM-based segmentation. By using the proposed method the nodules (third column in Figure 2) can be properly delineated from the lung parenchyma despite the presence of other non-target structures such as vessels. This is because the shape index characterizes the local shape while being independent of the image intensity.
Fig.2. Examples of nodule segmentation. 1st column:
original sub-image; 2nd column: segmentation based on
mean shift without the shape feature; 3rd column:
segmentation results based on the proposed method.
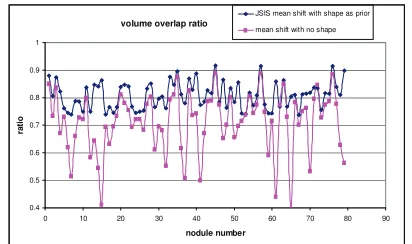
To evaluate the overall performance of the proposed algorithm, each nodule is segmented and compared to a ground truth manual segmentation. An overlap ratio between the segmented nodule and the ground truth annotation is calculated. Figure 3 shows the overlap ratios based on the proposed method with and without shape index feature. It is
noted that, without shape features, the mean overlap ratio for the whole dataset is 71% with standard deviation (std) of 0.1. However, the mean overlap ratio has been increased to 81% with the std decreasing to 0.05, by using the proposed five-dimensional JSIS mean shift clustering with shape feature as prior. This indicated the segmentation based on our proposed method is stable and accurate for different types nodules (such as non-spherical nodules or attached nodules).
5. CONCLUSION
We have presented a new method for nodule segmentation by integrating five dimensional spatial-intensity-shape features into the mean shift framework. Additionally, we present MEM-based segmentation that uses both shape and intensity in the prior probability. The joint JSIS feature provides rich information for nodule segmentation. Both visual inspection and quantitative measurement on a clinical dataset of thoracic CT scans demonstrates the potential of the proposed method. The method can successfully segment lesions adjacent to structures of similar intensity but different shape. The approach can also be applied to lesion segmentation in other anatomies, such as polyps in the colon.
11. REFERENCES
[1] I.Sluimer, A.Schiham, M.Prokop, and B.V.Ginneken,
“Computer analysis of computed tomography scans of the lung: A survey,” IEEE Trans. Medical Imaging, vol. 25, no.4, pp.385-405, 2006.
[2] J.Dehmeshki, H.Amin, and X.Ye, “Segmentation of
Pulmonary Nodules in Thoracic CT scans: A Region Growing Approach,” IEEE Trans. Medical Imaging, 27(4), 2008.
[3] Y.Kawata, N.Niki, H.Ohmatsu, R.Kakinuma, K.Eguchi,
M.Kaneko, and N.Moriyama, “Quantitative surface characterization of pulmonary nodules based on thin-section CT images”, IEEE Trans Nucl Sci 1998: 45:2132-2138.
[4] W.Mullally, M.Betke, J.Wang, and J.P.Ko, “Segmentation of
nodules on chest computed tomography for growth assessment”, Medical Physics, April 2004, 31(4), pp.839-848.
[5] K.Okada, D. Comaniciu, A. Krishnan, “Robust anisotropic
gaussian fitting for volumetric characterization of pulmonary
nodules in multislice CT”, IEEE Trans. Medical Imaging,
2005, vol.24, no.3, 409-423.
[6] O.Monga and S. Benayoun, “Using partial derivatives of 3D
images to extract typical surface features,” Computer Vision and Image Understanding, vol.61, pp.171-189, 1995.
[7] H.Yoshida and J. Nappi, “Three-dimensional computer-aided
diagnosis scheme for detection of colonic polyps,” IEEE
Trans. Medical Imaging, vol.20, no.12, pp.1261-1273, 2001.
[8] K.Fukunaga and L.D.Hostetler, “Estimation of the gradient of a density function with applications in pattern recognition,” vol.IT-21, pp.32-40, 1975.
[9] D.Comaniciu and P.Meer, “Mean shift: A robust approach
toward feature space analysis,” IEEE Transactions on Pattern Analysis and Machine Intelligence, vol.24, pp.603-619, 2002.
[10] S. Z. Li, “Markov Random Field Modeling in Computer
Vision,” Springer-Verlag, 1995.
volume overlap ratio
0.4 0.5 0.6 0.7 0.8 0.9 1
0 10 20 30 40 50 60 70 80 90
nodule number
ra
tio
JSIS mean shift with shape as prior mean shift with no shape
Fig.3. Volume overlap ratio based on the two different methods.