Procedia Computer Science 90 ( 2016 ) 80 – 86
1877-0509 © 2016 The Authors. Published by Elsevier B.V. This is an open access article under the CC BY-NC-ND license (http://creativecommons.org/licenses/by-nc-nd/4.0/).
Peer-review under responsibility of the Organizing Committee of MIUA 2016 doi: 10.1016/j.procs.2016.07.027
ScienceDirect
International Conference On Medical Imaging Understanding and Analysis 2016, MIUA 2016,
6-8 July 2016, Loughborough, UK
Computer-Aided Classification of Liver Lesions from CT Images
Based on Multiple ROI
Hussein Alahmer
a,*, Amr Ahmed
aa
University of Lincoln, Brayford Pool, Lincoln LN6 7TS, UK
Abstract
This manuscript introduces an automated Computer-Aided Classification (CAD) system to classify liver lesions into Benign or Malignant. The system consists of three stages; firstly, automatic liver segmentation and lesion detection. Secondly, extracting features from multiple ROIs, which is the novelty. Finally, classifying liver lesions into benign and malignant. The proposed system divides a segmented lesion into three areas, i.e. inside, outside and border areas. This is because the inside lesion, boundary, and surrounding lesion area contribute different information about the lesion. The features are extracted from the three areas and used to build a new feature vector to feed a classifier. The novelty lies in using the features from the multiple ROIs, and particularly the surrounding area (outside), because the malignant lesion affects the surrounding area differently compared to a benign lesion. Utilising the features from inside, border, and outside lesion area supports better differentiation between benign and malignant lesions. The experimental results showed an enhancement in the classification accuracy (using multiple ROI technique) compared to the accuracy using a single ROI.
© 2016 The Authors. Published by Elsevier B.V.
Peer-review under responsibility of the Organizing Committee of MIUA 2016.
Keywords:CAD system; liver segmentation; lesion detection; fuzzy-c-means; multiple ROI.
1. Introduction
The liver is an important organ that performs vital functions. However, diseases can occur without warning and early detection will help to reduce cancer death and becomes critical to successful treatment. According to Global
* Corresponding author: Hussein Alahmer. Tel.: +44-152-283-7478. E-mail address:[email protected]
© 2016 The Authors. Published by Elsevier B.V. This is an open access article under the CC BY-NC-ND license (http://creativecommons.org/licenses/by-nc-nd/4.0/).
Cancer Statistics1 it was reported that, worldwide, liver cancer was the fifth most commonly diagnosed and the second-leading cause of cancer death for men. While in women, it is the seventh most frequently diagnosed and the sixth most common cause of cancer death. Moreover, the incident statistic’s rate of liver cancer is increasing across many parts of the world where most patients who are diagnosed with liver cancer die within six months of diagnosis.
There are various imaging modalities such as Computed tomography (CT), Ultrasound, X-Ray, and Magnetic Resonance Imaging (MRI) used to diagnose liver lesions. The CT scan is often preferred for diagnosing liver diseases, especially as it is considered to be highly accurate imaging and cheaper than MRI2. However, liver segmentation and liver lesion detection can be a very challenging task and it depends on the experience of the radiologist and that is referring to small noticeable changes between healthy liver tissue and a lesion2. Existing medical image processing technologies are still growing; although research on computer aided classification has precedents3. Generally, along with the improvements in image processing for extracting features and artificial intelligence used in a classifier to diagnose liver disease. Designing and developing CAD systems to classify liver lesions has received considerable attention over the past years, since these systems can provide diagnostic assistance to clinicians for the improvement of diagnosis and increasing accuracy4.
Feature extraction is considered the most important phase in CAD systems to classify lesions. Low-level features5,6are usually used for understanding radiological images. Therefore, several approaches have been proposed to extract the appropriate low-level features to classify lesions.
In this paper, the overview of various liver lesion classification methodologies is explained briefly. The novelty of this work lies in building a new feature vector through extracting features from the surrounding lesion area (outside lesion), inside, and the border lesion area. The new feature vector is used in the classification process.
The paper is ordered as follows. Section 2 discusses related work, section 3 presents the proposed work, section 4 deals with the experiment, results and discussion, while section 5 concludes the work.
2. Related work
There are several systems that have been proposed by researchers to classify liver lesions according to the tissue types (Normal, Benign, and Malignant) based on extracting features from the lesion area. Our proposed system utilises multiple ROIs (inside, border, and outside lesion area) to enhance the classification accuracy.
Among the various liver segmentation, lesion detection and feature extraction techniques, Ganeshan et al.7 proposed a system to determine whether texture analysis of CT images in the apparently healthy liver region was changed through the presence of a malignant tumour in patients with colorectal cancer. The dataset consists of three groups of tissue. Firstly, healthy tissue with no malignancy. Secondly, malignancy tissue but no liver involvement. Finally, liver metastases tissue (malignant). The tumour region was manually constructed as a region of interest. The statistical parameter of texture (mean grey-level intensity, Entropy, and Uniformity) were extracted from both unfiltered images as well as filtered images (high-lighting fine, medium and coarse texture). However, the experiments revealed that the texture features derived from unfiltered images for the three groups were not significantly different, while statistically different when filtered images were used.
The semi-automatic classification system was presented by Stoitsis et al.8Image pre-processing (mean, median, Laplacian, and Gaussian filters) was used to enhance image quality and defined tumour as ROI. Their proposed system was able to classify four types of liver tissues: normal, cyst, hemangioma, and HCC. Five texture features (FOS, COM, GLDM, LET, and FM) were extracted for each tumour. The most useful features were found using a feature selection, based on Genetic Algorithms. A Neural Network was used in the classification to achieve an accuracy of 90.63%. This work was later extended by considering different feature sets (FOS, SGLDM, GLDM, TEM, and FDM) by Mougiakakou et al.9
Another classification system was proposed by Wang et al.10The system classified three types of hepatic tissue (Normal, HCC, and Hemangioma). The ROIs of the tumour were defined by experienced radiologists. For each ROI, four texture features (FOS, SGLDM, GLRLM, and GLDM) were extracted to feed a SVM classifier. The classifier used two strategies to construct multiclass SVMs: one-against-all11 and one-against-one12. The performance of classification was assessed through a 5-fold cross validation. The best accuracy was observed with the multiclass SVM using one-against-one method (97.78%). However, the proposed system used a fixed size ROI
(32x32), while the lesion has a variable size, larger or smaller than this selected ROI, which cannot usually fulfil the fixed size ROI structure as part of the lesion might be outside the fixed size ROI.
The fully automated classification system proposed by Kumar et al.13, specialised in differentiation between HCC (malignant) and hemangioma (benign). From each ROI four texture features set (grey level, co-occurrence of grey level, wavelet coefficient statistics, and contourlet coefficient statistic) were extracted. A probabilistic neural network classifier was used in the tumour classification. The highest accuracy achieved was 96.7%, which had been obtained with contourlet coefficient co-occurrence features. However, the proposed system can be extended for other types of liver diseases but the performance measures and accuracy mainly depend on the number of samples used.
An additional study in liver lesion classification was provided by Doron et al.14 The combination of texture features (GLCM, LBP, Gabor, GLBP) and intensity feature (gray level intensity) were obtained from a given lesion. For classification module, SVM and KNN classifiers were used to distinguish between four types of liver tissues, namely: Cyst, Hemangioma, Metastases, and Healthy tissue. However, the best result of 97% accuracy was obtained with a combination of Gabor, LBP and Intensity features using a SVM classifier.
After surveying the published papers, many researchers try to diagnose liver disease using different techniques to increase the classification performance. However, it has been found that the previous studies on CAD systems usually used the low-level features, which are extracted from only the lesion region in classification. In this study the low-level features were extracted from multiple ROIs (inside, border, and outside lesion areas) and employed as a new feature vector in our proposed classification system.
3. Proposed Work
The main goal of this paper is to compare the efficiency of CAD system to classify CT liver lesions as benign or malignant based on low-level features, extracted from only the lesion and the proposed multiple ROIs technique.
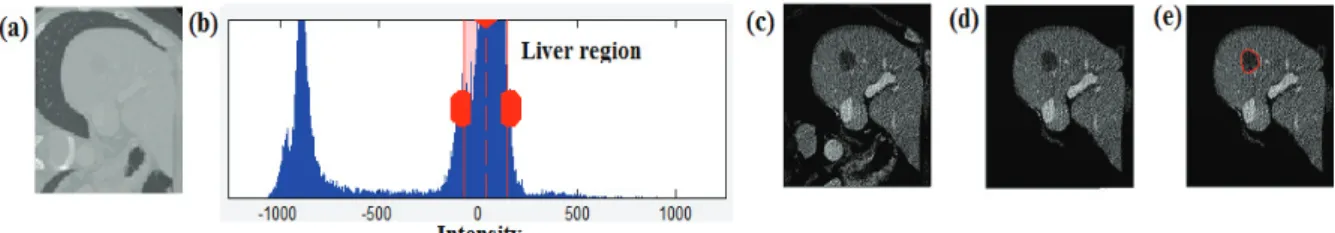
The system uses a two-step process. Firstly, segment the liver by generating a binary liver mask. The CT greyscale image is split into three classes using a memory efficient implementation of the fuzzy c-means (FCM) clustering algorithm15,16. Computational efficiency is achieved by using the histogram of the image intensities during the clustering process instead of the raw image data. After that the combinations of several morphological operations (closing, and opening) were applied to separate the liver from other organs where the liver was defined as the largest connected area.
Secondly, region growing is applied to segment tumours17, where the seed point is detected automatically from the FCM clustering algorithm. The process of liver and lesion segmentation from the CT image is shown in Fig. 1.
Fig. 1. Liver and Lesion segmentation process: (a) DICOM CT image; (B) Histogram of CT image; (C) Extracted liver with noise; (d) After morphological operation; (e) Detected lesion.
3.1. Features extraction
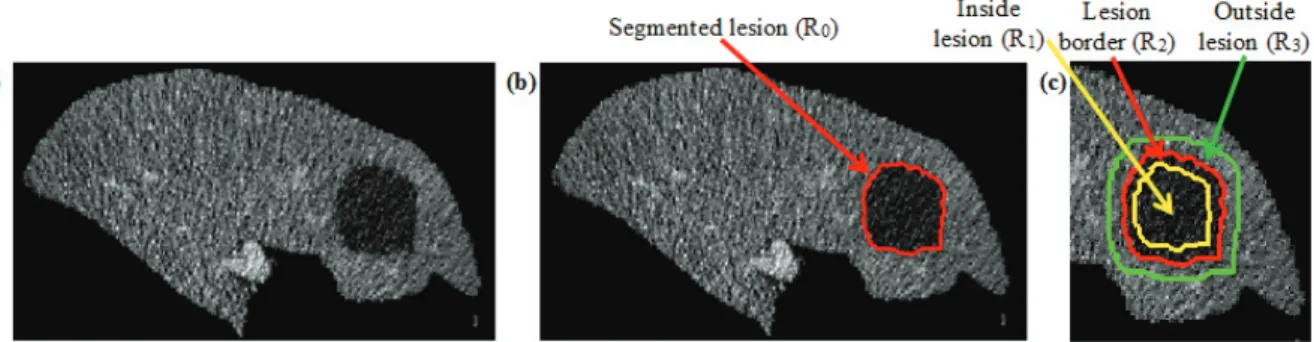
After extracting the liver and defining the lesion as the main ROI, the proposed system will divide the segmented lesion (R0) into two ROIs (where R0= R1 R2). R1is the area inside the lesion and is defined as an area where more
than 70% of the lesion pixels are located inside the lesion. Otherwise, the area is considered as a lesion border (R2).
Then liver tissue that surrounds the lesion (R0) is defined as the third ROI (R3). Fig. 2 depicts an illustration for the
Fig. 2. Liver lesion ROIs: (a) segmented liver; (b) segmented lesion (R0); (c) Three ROIs; inside lesion R1is yellow; boundary lesion R2is red;
outside lesion R3is green.
The multiple ROIs are done according to the following algorithm: Algorithm 1. Segmenting Multiple ROIs
Input: Segmented liver (LV), Segmented lesion (R0)
OUTPUT: R1(inside lesion), R2(lesion border), R3(surrounding lesion)
Operation
SET MINDIM = minimum diameter of R0;
SET Structure element, S_INSIDE = MINDIM*0.3; SET R1= Erode (R0, S_INSIDE);
SET R2= R0-R1;
SET Structure element, S_OUTSIDE = 2* S_INSIDE; SET = Dilate (R0, S_OUTSIDE) LV;
SETR3= – R0;
RETURN R1, R2, R3.
END
The process of lesion classification into Benign or Malignant is shown in Fig. 3.
Fig. 3. CAD system process.
However, there is a large diverse set of features to be used. These come under three categories; intensity, shape, and texture features. These are presented in Table 1.
Table 1. Features extraction type.
Intensity features Texture features Shape features
Histogram, Mean, Variance, Skewness, Energy, Entropy, Kurtosis.
GaborEnergy, GLCM (Homogeneity, Energy, Correlation, Contrast)
Area, Smoothness, Compactness, Sphericity, Solidity R1 Inside lesion R2 Lesion border R3 Surrounding lesion Feature extraction (Shape feature) Feature extraction (intensity, texture) Feature extraction (intensity, texture) Feature extraction (intensity, texture) SVM Classifier Classification Benign/ Malignant lesion R0 Segmented lesion Input CT image Lesion detection
For each ROI, the proposed system computes intensity and texture features as mentioned in table 1. The shape features are computed to the segmented lesion (R0) as presented in Fig. 2 (b).
For lesion shape, the feature extraction module calculates another four shape features. Namely, dispersion, elongation, and two circularity of lesion features to define the lesion margin shape. As described in table 2.
Table 2. Shape feature equations.
Dispersion Elongation Circularity1 Circularity2
Area MaxRadius D 2 ) * 2 ( MaxRadius Area E ) * ( 1 2 MaxRadius Area C S MaxRadius MinRadius C2 * Estimates the
irregularity of the lesion
* Differentiates the regular oval mass from the irregular
* Computes the circularity of the lesion where the result takes a value of 1 for perfect circles
* Differentiates circular/ oval lesion from irregular. This value measures how a lesion is similar to an ellipse.
The motivation for using multiple ROIs (inside, boundary, and surrounding lesion) and the chosen features is based on the fact that the benign lesions vary from the malignant lesion by their inside, boundary, and surrounding tissue characteristics. In malignant lesions, the internal lesion structure shows a wide range of changes (heterogeneous attenuation) and invasion of adjacent structures; the lesion is surrounded by a thick enhancing rim; the lesion border is defined as irregular or ill-defined margins. But in benign lesions, the internal structure is diffusely homogeneous; with a thin or absent rim; the lesion border is round or oval shaped with a sharp margin18. 3.2. Classification
Classification is the last stage in an automated CAD system, where its input is the extracted set of feature vectors(s) from the previous stage. The goal of the classification stage is to apply a learning-based approach considering its input feature vector(s) for the purpose of disease diagnosis. A Support Vector Machine (SVM) was used to classify a lesion as benign or malignant.
4. Experimental Results
The dataset (presented later) was divided into testing data and training data. The first experiment focused on extracting the features from multiple ROIs, then building a feature vector. A new feature vector is used to feed the classifier to differentiate between liver lesions into benign or malignant.
While experiment two focused on extracting the intensity, texture, and shape features from the segmented lesion (R0), and then build a feature vector. A SVM classifier will be used for the classification for all the test experiments.
4.1. Dataset and experimental setup
The dataset consists of 60 patient cases, where liver lesions are identified in CT scans and divided into 33 malignant cases and 27 benign cases. The CT images had varied resolutions, slices and spacing.
The experiments have been done on Intel Core I5- 3.40 GHz computer with 8 Gigabytes of RAM under windows 7, 64-bit operating system. The Matlab R2014a was used to run experiments and extract the features and the Weka 3.6.11 machine learning tool19was used for classification.
4.2. Evaluation and results
This section presents the evaluation and results for each stage of the lesion classification. The performance of the proposed system was estimated by the 5-fold cross-validation. In 5-fold cross-validation, sequentially 80% of the dataset is used as a training set and the remaining 20% cases are used as a test set. The average classification accuracy of five rounds was used as the final result.
The classifier output is compared with the original class attribute to generate a confusion matrix and identify True Positive (TP); where malignant disease is classified correctly as malignant disease, True Negative (TN); benign disease classified as benign disease correctly, False Positive (FP); classified benign disease incorrectly as malignant disease, and False Negative (FN); classified malignant disease incorrectly as benign disease.
The baseline Doron et al.14has already been introduced in detail in the literature section. This baseline is selected since it is the most recent baseline and operates on the single phase CT images (portal phase). Furthermore, the baseline classifies the same types of lesion as our proposed system. Due to the limited availability of the dataset used, we have regenerated the baseline by implementing14and applying it on our dataset. The results when using lesion ROI (R0), and using multiple ROIs features, compared to the baseline, are shown in Table 3.
Table 3. Comparison between proposed method (using Lesion ROI (R0), and multiple ROIs) and baseline.
Baseline Proposed Lesion ROI (R0) Proposed Multiple ROIs
Malignant Benign Malignant Benign Malignant Benign
Accuracy 0.917 0.917 0.951 0.951 0.983 0.983
Sensitivity 0.91 0.926 0.941 0.963 1.00 0.963
Specificity 0.926 0.91 0.963 0.941 0.963 1.00
The higher accuracy classification result is achieved when using the multiple ROIs, compared to the lesion ROI (R0) only and baseline. The importance of the proposed system is the ability to classify the liver lesion into benign
and malignant with the high accuracy of over 98% through the novelty of building feature vectors based on multiple ROI features, which utilise the useful information from the lesion (inside, and border) and surrounding lesion tissue.
5. Conclusion
This paper presented an automated approach for a liver lesion classification system into benign and malignant. The inside, border, and surrounding lesion areas contribute to the lesion feature representation. The novelty of this work is based on dividing the segmented lesion into inside and border areas. In addition, it also utilises the surrounding lesion tissue to build new feature vectors and use them in training a classifier, which improved the classification accuracy to over 98%. The proposed system can be updated in the future to further classify lesions into more specific types such as cysts, and hemangioma for benign, and HCC, metastatic for malignant.
References
1. Jemal A., Bray F., Center M. M., Ferlay J., Ward E. and Forman D. Global cancer statistics. CA: A Cancer Journal for Clinicians. 2011; 61: 69–90. doi: 10.3322/caac.20107.
2. Arakeri Megha P. "Recent Advances and Future Potential of Computer Aided Diagnosis of Liver Cancer on Computed Tomography Images." In Computer Networks and Intelligent Computing, pp. 246-251. Springer Berlin Heidelberg; 2011.
3. Dankerl P., Cavallaro A., Alexey T., Costa M., Suehling M., Janka R., Uder M., and Hammon M. "A Retrieval-based computer-aided diagnosis system for the characterization of liver lesions in CT scans." Academic radiology;2013: 20, no. 12: p. 1526-1534.
4. Kumar S. S., Moni R. S., and Rajeesh J. "Liver tumor diagnosis by gray level and contourlet coefficients texture analysis." In Computing, Electronics and Electrical Technologies (ICCEET), International Conference on; 2012; p. 557-562. IEEE.
5. Depeursinge A., Kurtz C., Beaulieu C., Napel S., Rubin D. "Predicting Visual Semantic Descriptive Terms from Radiological Image Data: Preliminary Results with Liver Lesions in CT," Medical Imaging, IEEE Transactions 2014; vol.33, no.8, p.1669-1676.
6. Taylor Paul M. "A review of research into the development of radiologic expertise: Implications for computer-based training." Academic radiology2007; 14, no. 10: p. 1252-1263.
7. Ganeshan B., Kenneth A., Miles, Young R. CD., and Chatwin C. R. "Texture analysis in non-contrast enhanced CT: Impact of malignancy on texture in apparently disease-free areas of the liver." European journal of radiology70, no. 1 2009; p. 101-110.
8. Stoitsis, John, Ioannis Valavanis, Stavroula G. Mougiakakou, Spyretta Golemati, Alexandra Nikita, and Konstantina S. Nikita. "Computer aided diagnosis based on medical image processing and artificial intelligence methods." Nuclear Instruments and Methods in Physics Research Section A: Accelerators, Spectrometers, Detectors and Associated Equipment569, no. 2. 2006; p.591-595.
9. Mougiakakou, Stavroula G., Ioannis K. Valavanis, Alexandra Nikita, and Konstantina S. Nikita. "Differential diagnosis of CT focal liver lesions using texture features, feature selection and ensemble driven classifiers." Artificial Intelligence in Medicine41, no. 1. 2007; p.25-37. 10. Wang, Luyao, Zhi Zhang, Jingjing Liu, Bo Jiang, Xiyao Duan, Qingguo Xie, Daoyu Hu, and Zhen Li. "Classification of hepatic tissues
from CT images based on texture features and multiclass Support Vector Machines." In Advances in Neural Networks–ISNN 2009, 2009; p. 374-381. Springer Berlin Heidelberg.
11. Liu, Yi, and Yuan F. Zheng. "One-against-all multi-class SVM classification using reliability measures." In Neural Networks, 2005. IJCNN'05. Proceedings. 2005 IEEE International Joint Conference on, vol. 2, pp. 849-854. IEEE, 2005.
12. Hsu, Chih-Wei, and Chih-Jen Lin. "A comparison of methods for multiclass support vector machines." Neural Networks, IEEE Transactions on13, no. 2. 2002; p.415-425.
13. Kumar, S. S., R. S. Moni, and J. Rajeesh. "An automatic computer-aided diagnosis system for liver tumours on computed tomography images." Computers & Electrical Engineering39, no. 5. 2013; p.1516-1526.
14. Doron, Yeela, Nitzan Mayer-Wolf, Idit Diamant, and Hayit Greenspan. "Texture feature based liver lesion classification." In SPIE Medical Imaging, 2014; p. 90353K-90353K. International Society for Optics and Photonics.
15. Wu, Kuo-Lung, and Miin-Shen Yang. "Alternative c-means clustering algorithms." Pattern recognition,35(10): 2002; p.2267-2278. 16. Yang, Miin-Shen, Yu-Jen Hu, Karen Chia-Ren Lin, and Charles Chia-Lee Lin. "Segmentation techniques for tissue differentiation in MRI
of ophthalmology using fuzzy clustering algorithms." Magnetic Resonance Imaging,20(2): 2002; p.173-179.
17. Zhao, Binsheng, Lawrence H. Schwartz, Li Jiang, Jane Colville, Chaya Moskowitz, Liang Wang, Robert Leftowitz, Fan Liu, and John Kalaigian. "Shape-constraint region growing for delineation of hepatic metastases on contrast-enhanced computed tomograph scans." Investigative radiology,41(10): 2006; p.753-762.
18. Heiken J. “Distinguishing benign from malignant liver tumours.” Cancer Imaging,7(Spec No A): 2007; p. S1-S14.
19. Hall, M., Frank, E., Holmes, G., B. Pfahringer, P. Reutemann, and I.H. Witten. The WEKA data mining software: an update. ACM SIGKDD explorations newsletter,11(1), 2009; p.10-18.