R E S E A R C H
Open Access
Evaluating long-term effectiveness of
sleeping sickness control measures in Guinea
Abhishek Pandey
1,4, Katherine E. Atkins
2*, Bruno Bucheton
2,3, Mamadou Camara
2, Serap Aksoy
4,
Alison P. Galvani
1,4and Martial L. Ndeffo-Mbah
1,4Abstract
Background:Human African Trypanosomiasis threatens human health across Africa. The subspeciesT.b. gambiense
is responsible for the vast majority of reported HAT cases. Over the past decade, expanded control efforts accomplished a substantial reduction in HAT transmission, spurring the WHO to include Gambian HAT on its roadmap for 2020 elimination. To inform the implementation of this elimination goal, we evaluated the likelihood that current control interventions will achieve the 2020 target in Boffa prefecture in Guinea, which has one of the highest prevalences for HAT in the country, and where vector control measures have been implemented in combination with the traditional screen and treat strategy.
Methods:We developed a three-species mathematical model of HAT and used a Bayesian melding approach to
calibrate the model to epidemiological and entomological data from Boffa. From the calibrated model, we generated the probabilistic predictions regarding the likelihood that the current HAT control programs could achieve elimination by 2020 in Boffa.
Results:Our model projections indicate that if annual vector control is implemented in combination with annual or biennial active case detection and treatment, the probability of eliminating HAT as public health problem in Boffa by 2020 is over 90%. Annual implementation of vector control alone has a significant impact but a decreased chance of reaching the objective (77%). However, if the ongoing control efforts are interrupted, HAT will continue to remain a public health problem. In the presence of a non-human animal transmission reservoir, intervention strategies must be maintained at high coverage, even after 2020 elimination, to prevent HAT reemerging as a public health problem. Conclusions:Complementing active screening and treatment with vector control has the potential to achieve the elimination target before 2020 in the Boffa focus. However, surveillance must continue after elimination to prevent reemergence.
Keywords:Human African trypanosomiasis, Active surveillance, Vector control, Disease elimination, WHO 2020 goals, Tsetse target, Mathematical model
Background
Human African Trypanosomiasis (HAT) poses a serious health risk to humans in vast regions of Sub-Saharan Africa [1]. Gambian HAT disease progresses over several years from the initial symptoms of fever, headaches and lymph-adenopathy (Stage I) through neuropsychiatric disorders and sleep disturbance (hence the name sleeping sickness) (Stage II). If untreated, most HAT cases result in death [1].
The two protozoan subspecies of the parasite Trypano-soma brucei (T.b.) responsible,T.b. gambiense (Tbg) and
T.b. rhodesiense (Tbr), are both transmitted by tsetse flies [1, 2].Tbg causes the Gambian form of the disease and is found in 24 countries across West and Central Af-rica. Tbg accounts for over 95 % of HAT cases in Sub-Saharan Africa [3–5]. It is transmitted by the Palpalis -group of tsetse, particularly by the subspecies ofGlossina fuscipes and Glossina palpalis [6, 7]. Palpalis tsetse are riverine insects and generally infest humid habitats on the fringes of rivers, lake shores and wetlands of West and Central Africa [8, 9]. Due to the absence of a vaccine, * Correspondence:[email protected]
2
HAT National Control Program, Ministry of Health, Conakry, Republic of Guinea
Full list of author information is available at the end of the article
intervention strategies against HAT are based on on vec-tor control as well as on“active”and“passive”case detec-tion followed by treatment [7]. Active case detecdetec-tion is implemented by HAT screening of an exposed population, whereas passive case detection relies on self-presentation of HAT patients. After widespread intervention cam-paigns, the Gambian disease was nearly eradicated in the early 1960s [1, 10]. However, a collapse of surveillance and control activities, often due to periods of political instabil-ity, led to disease rebound during the 1990s [11]. With renewed control activities that centered around case de-tection and treatment, the number of reported cases of Gambian HAT fell by 75 % between 1999 and 2010, from 27,862 to 6,984 [4]. This decline in incidence has spurred the WHO to include Gambian HAT on its 2020 roadmap for the elimination of neglected tropical diseases [5]. The WHO 2020 HAT elimination goal seeks to eliminate Gambian HAT as a public health problem by reducing the annual incidence rate to less than 1 in 10,000 people in 90 % of endemic foci [5]. It is unclear if the WHO HAT elimination goal is feasible under current interventions or if complementary strategies will have to be considered.
We developed a mathematical model for HAT to assess the likelihood that ongoing vector control, active screen-ing and treatment strategies could eliminate Gambian HAT as a public health problem by 2020. We focus on the Boffa prefecture in Guinea as our study area, which has one of the highest prevalence for HAT in Guinea [12–14].
We fitted our model to HAT infection prevalence between 2008 and 2013 in Boffa East using a Bayesian inference ap-proach to capture uncertainty of epidemiological data into model projections. We used scenario analysis to evaluate the robustness of our predictions to the existence of a non-human animal transmission reservoir.
Methods Model
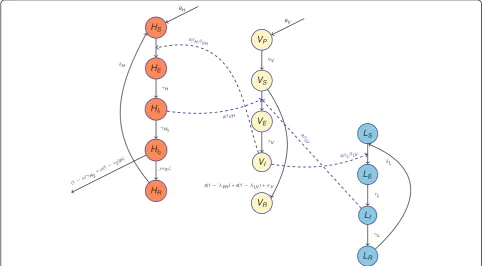
Gambian HAT is generally regarded as a disease primar-ily infecting humans, with uncertainty about the role of non-human animals in sustaining the transmission cycle. We developed two mathematical models, with and with-out a non-human animal transmission reservoir. Here, we describe the model that includes the non-human res-ervoir resres-ervoir. To evaluate the long-term effectiveness of HAT control measures in Guinea, we developed a three-species SEIR differential-equation model for T.b. gambiense infection among tsetse (V), humans (H) and non-human animals (NHA) (L) based on previous math-ematical models [15, 16]. Each species was categorized in terms of their infection status: susceptible (VS,HS,LS), exposed (VE,HE,LE), infectious (VI,HI,LI) or recovered (VR,HR,LR) (Fig. 1, Additional file 1). To capture the reality that tsetse flies are more likely to become infected during their first bloodmeal and the susceptibility of tsetse to trypanosome decreases with age (hours after eclosion of the fly from the puparium) at first meal [17],
[image:2.595.56.539.438.704.2]we assumed that tsetse are susceptible to trypanosome infection only during their first blood-meal and within 24 h after emergence from pupa (VP) to the adult stage (VS) [17]. Susceptible tsetse (VS) become infected after feeding on an infectious human or NHA and enter the exposed state (VE) during which the infection incubates. After incubation, tsetse become infectious (VI) for the rest of their life and can transmit infection to human and non-human animals. We assumed that the tsetse population has a density-dependent mortality rate:
μV ¼μV0 1þμV1V
; ð1Þ
whereμV0 is the death rate in the absence of intra-species competition,μV1measures the effect of intra-species com-petition on death rate, andVis the population size of all non-pupal tsetse.
Both humans and NHAs may become exposed to in-fection after being bitten by an infectious tsetse (VI). After the incubation period, humans and NHA hosts enter the infectious stage of HAT (HI1 and LI
respect-ively), in which they can transmit infection to susceptible tsetse if bitten. Human hosts progress to stage II of infection ðHI2Þ, in which they are assumed not to be
infectious due to isolation arising from the severity of symptoms in this stage of disease progression [1, 18]. Infected people in stage II either seek treatment and recover (HR) or die due to being untreated or due to treatment failure. Successfully treated HAT patients are temporarily resistant to reinfection and exposure via tse-tse (through immunity to reinfection or hospitalization, respectively) before returning to full susceptibility (HS). Infectious NHAs (LI) clear infection and become tem-porarily immune to reinfection (LR) before returning to the susceptible state (LS). We assumed that both human and NHA populations are of constant size throughout the analysis.
Our model captured the annual active screening and treatment in Boffa, by assuming that active surveillance occurs within a 20 day-period, during which a propor-tion,ϕ, of the human population is tested forTbgusing
the Card Agglutination Test for Trypanosomiasis
(CATT) and then a Trypanolysis test (TL). While the
CATT diagnostic tool can be performed in situ using
blood from a finger prick, TL is performed in laborator-ies using plasma samples [19]. TL has been implemented successfully in Guinea, Cote d’Ivoire and Burkina Faso during medical surveys with a 100 % specificity, com-pared to 91 % for CATT [20]. Therefore the combined CATT-TL testing has a sensitivity ofρand specificity of 100 %. Once infection status has been confirmed, a lumbar puncture is performed to determine whether the patient has progressed to stage II. We assumed that all patients testing positive were treated [21], such that a
fraction, ϕρϵ1 and ϕρϵ2, of stage I and stage II HAT patients recover after 20 days of active surveillance (whereϵ1andϵ2are the efficacies of stage I and stage II treatment).
To reduce transmission, insecticide-treated targets have been deployed in areas where people live and work [21]. Consistent with previous model calibration work [22] that showed temporary efficacy of this type of vec-tor control, we assumed that for the initial three months of deployment, the targets induced a tsetse maximal kill rate ofx, which decreased linearly to zero in the following three months, and remained ineffective for the subsequent six months until the targets were replaced [22].
Data sources
To calibrate and validate our dynamic model, we used multiple data sources from the Boffa region of Guinea. For calibration, we used four data sources: i) the number of HAT cases (partitioned by stage) diagnosed and treated in the Boffa East region through active annual screening activities in 2008 and 2013 with known coverage [12, 21],
ii) the Tbg prevalence in non-human animal reservoir
across Boffa East, iii) theTbgprevalence in tsetse across Boffa East, and iv) the reduction in tsetse density between 2012 and 2013 in Boffa East as a result of a vector control program. For validation, we used i) the number of HAT cases (partitioned by stage) diagnosed and treated in Boffa East through active annual screening activities in 2010 and 2012 [12, 21], and ii) the HAT incidence in 2012 [21]. To parameterize human population size, we used data from a 2011 census of Boffa. As previous a study has shown Tbgprevalence to be extremely low in tsetse and NHA [12], we assumed that both of these prevalences were under 1 %. All other parameters were based on pub-lished estimates (Table 2).
Model fitting
by 60 % over a year [21]. To estimate the maximal kill rate,
x, we used maximum likelihood estimation with normal distribution as the likelihood function to fit the model to this reduction in tsetse density [21]. The model was run until 2013 for best fit parameters from Bayesian fitting with active screening and treatment in year 2008, 2010, 2012 followed by vector control in year 2012. We refined the posterior distributions of the epidemiological parame-ters (βVH, βH,ζ ,βL), obtained from the initial Bayesian fitting of the model to the 2008 data which were then used as prior distributions for fitting the model to 2013 data of HAT stage I and II prevalences (Fig. 2).
The Bayesian melding method takes all available prior information on model inputs and, when combined with a likelihood function, generates posterior distributions of model parameters and predicted model outputs through statistical comparisons of model predictions with obser-ved data. We used a uniform prior distribution for each model parameter (βVH,βH,ζ, βL) and Beta distributions for the observed data on stage I and stage II HAT, tsetse and NHA trypanosomiasis prevalence. To describe the Bayesian melding algorithm, we denote the simulation model (Additional file 1) by M, the epidemiological pa-rameters (βVH, βH,ζ, βL) as Θand the model-predicted
output asΓ=M(Θ). We denote the prior distribution for each model parameter asq(Θ). We denote the data asW
and the associated likelihood of the model outputs as
L(Γ) = Pr (Γ|W). The posterior distribution of inputs is then proportional to q(Θ)L(Γ). We implemented a sample-importance-resample algorithm to approximate the posterior distribution. First, we generated a set of
input parameters, Θ(i), by randomly sampling from
the respective prior distributionsitimes. We then evalu-ated the model using that set of parameters,Γ(i) =M(Θ(i)) for each run i. Next, we calculated the corresponding likelihood for the model run. For each sample Θ(j), with non-zero corresponding likelihood, the sampling
weight was Ωð Þ ¼j LðΓð ÞjÞ=X
Nl
k¼1
LðΓð Þk Þ. To ensure a
sufficient sample from the posterior distributions, we set i= 400,000.
The number of non-zero likelihood samples, Nl, was 520 for the model without NHA reservoir, and 1,053 for the model with an NHA when fit to 2008 prevalence data. After refinement to fit the models to 2013 data, the final sample size was 290 for the model without an NHA reservoir, and 395 with an NHA reservoir. We
[image:4.595.60.536.393.685.2]repeated this sampling procedure 10,000 times with re-placement, using a probability of selection proportional to the sampling weights to obtain an approximation of the posterior distribution for the inputs. Output from the simulation resampled most frequently (i.e., the simu-lation most compatible with empirical prevalence data) represents the estimated mode for the output parame-ters of interest. The 2.5th and 97.5th percentiles of the inputs (and corresponding model outputs) correspond to 95 % credible limits.
Effectiveness of intervention strategies
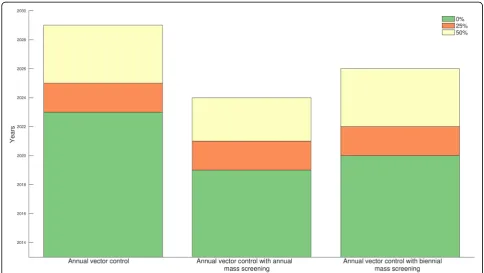
We evaluated the disease dynamics under two model structures: first, with no NHA reservoir, following a sur-vey in Boffa showing no evidence of NHA infection [12], and second, with a small prevalence of NHA infection, following studies suggesting the importance of NHAs in the maintenance of disease transmission [25]. Using the calibrated models, we projected the model between 2013 and 2030 under the assumption that all control mea-sures are implemented with the same coverage and effi-cacies as achieved in year 2012, with the exception of years 2014 and 2015 when no control measures were implemented due to the Ebola crisis. We then evaluated the probability of reaching the WHO elimination thresh-old of less than one case per 10,000 annually, which corresponds to a “low transmission focus”, and also the more stringent condition of 1 case per 100,000 inhabi-tants, which corresponds to a “very low transmission focus” [5]. We assessed the probability of elimination under three different control interventions: annual vector control effort, annual vector control effort with annual active-screening and treatment, and annual vector control effort with biennial active-screening and treatment.
Model code
The analysis was performed using Matlab R2014b, and all model codes are available via https://github.com/abhiganit/ Sleeping-Sickness.
Results
We employed a Bayesian melding approach to fit our models, with and without NHA reservoir, to epidemio-logical data of HAT in Boffa East, Guinea. Using prior distributions of epidemiological parameters based on estimates available in the literature (Table 1), we derived a posterior distribution for each epidemiological param-eter for which the model gives the best estimate for stage I and stage II HAT prevalences in 2008 and 2013 and trypanosomiasis prevalence among tsetse and NHA reservoir (Fig. 2, Tables 2 and 3). The prevalence of stage I and Stage II HAT in 2010 and 2012 and the stage I in-cidence in 2013 were used for model validation (Fig. 2 and Table 3).
We projected the trajectory of our model until 2030 and estimated the probability of HAT elimination as a public health problem by 2020 under various control in-terventions (Fig. 3). Predictions from our model indicate that if no further control intervention is implemented after 2015, HAT will likely continue as a public health problem in Boffa East with annual incidence exceeding 2 cases per 10,000 individuals by the end of 2020. To evaluate the likelihood of achieving the WHO 2020 goal of HAT elimination as a public health problem in Boffa, we assumed that the intervention strategies are continu-ously implemented from 2016 until 2020, at which time control efforts are ceased. Our base-case model, without NHA reservoir, showed that annual implementation of vector control at the same efficacy as 2012 is likely to eliminate HAT as a public health problem by 2020, with the new cases remaining less 1 per 10,000 people (Fig. 3a). If vector control is complemented by annual active screening and treatment, then the model predicts that a 100 % probability of elimination is achieved in 2018. With only biennial implementation of active screening and treatment, elimination is achieved in 2019 (Fig. 3a).
When we incorporated a non-human animal transmis-sion reservoir, our model predicts at least 77 % probability of HAT elimination as a public health problem in Boffa East by 2020 under the three control strategies if the coverage and efficacy remains consistent (Fig. 3b). Though likelihood of elimination is high, none of the three control strategies implemented at their 2012 efficacy level guaran-tee elimination of HAT as it was the case in the absence NHA reservoir (compare Fig. 3a to b). Moreover, in the presence of an NHA reservoir, intervention strategies must be maintained at high coverage, even after 2020 elimination, to prevent HAT reemerging as a public health problem in Boffa East by 2025 (Fig. 3b).
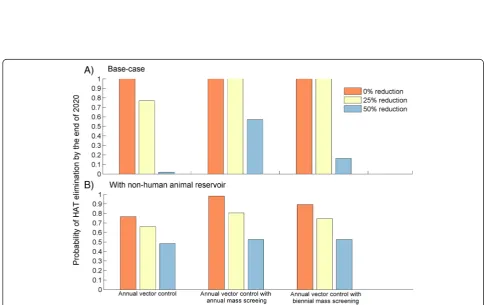
Maintaining a high efficacy of vector control, high density of insecticide-treated targets, may be unsustain-able in the long term. Our results indicate that if vector control efficacy is reduced by 25 %, this would lower the probability of HAT elimination as a public health problem by the end of 2020 to 77 %. Moreover, a 50 % reduction in vector control efficacy would likely prevent elimination by the target date, with only a 1.9 % probability of attaining the goal (Fig. 4a).
16 % for biennial and 57 % for annual active screening in the absence of an NHA reservoir (Fig. 4).
Considering that current control efforts are predicted to be sufficiently efficacious to meet the WHO HAT elimination goal in Boffa East Mainland, we evaluated time to elimination under the more stringent criteria of 1 cases per 100,000 people when control interventions are continuously implemented until 2030. We found that vector control implemented annually will meet the threshold if it is continued through 2023. If the annual vector control is complemented with annual or biennial active screening, the threshold can be achieved by the end of 2020 and 2021, respectively (Fig. 5). We also found that if the controls are implemented with lower
efficacy and coverage, the control will have to be con-tinued at least until 2025 to meet the threshold (Fig. 5).
We used Akaike Information Criterion (AIC) to
[image:6.595.57.540.101.540.2]compare our base-case model and the model with an NHA reservoir. The model without NHA had smaller AIC. However, the relative likelihood for the model with NHA was 27 % and the difference in AIC value between the models was 2.64, suggesting that both models are plausible [26]. Thus, while there is some support for preferring the simpler model that includes an NHA reservoir, there is limited evidence for either the presence of absence of an NHA transmission reservoir.
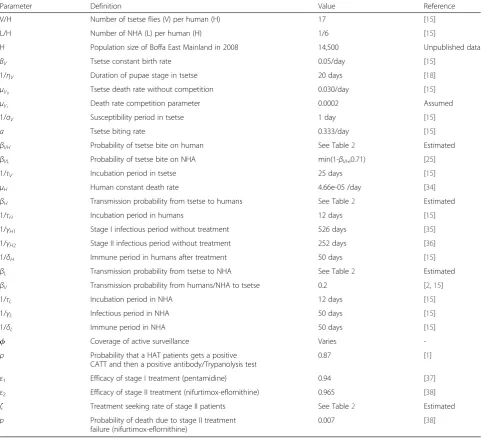
Table 1Definitions and values for model parameters
Parameter Definition Value Reference
V/H Number of tsetse flies (V) per human (H) 17 [15]
L/H Number of NHA (L) per human (H) 1/6 [15]
H Population size of Boffa East Mainland in 2008 14,500 Unpublished data
BV Tsetse constant birth rate 0.05/day [15]
1/ηV Duration of pupae stage in tsetse 20 days [18]
μV0 Tsetse death rate without competition 0.030/day [15]
μV1 Death rate competition parameter 0.0002 Assumed
1/σV Susceptibility period in tsetse 1 day [15]
a Tsetse biting rate 0.333/day [15]
βVH Probability of tsetse bite on human See Table2 Estimated
βVL Probability of tsetse bite on NHA min(1-βVH,0.71) [25]
1/τV Incubation period in tsetse 25 days [15]
μH Human constant death rate 4.66e-05 /day [34]
βH Transmission probability from tsetse to humans See Table2 Estimated
1/τH Incubation period in humans 12 days [15]
1/γH1 Stage I infectious period without treatment 526 days [35]
1/γH2 Stage II infectious period without treatment 252 days [36]
1/δH Immune period in humans after treatment 50 days [15]
βL Transmission probability from tsetse to NHA See Table2 Estimated
βV Transmission probability from humans/NHA to tsetse 0.2 [2,15]
1/τL Incubation period in NHA 12 days [15]
1/γL Infectious period in NHA 50 days [15]
1/δL Immune period in NHA 50 days [15]
ϕ Coverage of active surveillance Varies
-ρ Probability that a HAT patients gets a positive CATT and then a positive antibody/Trypanolysis test
0.87 [1]
ε1 Efficacy of stage I treatment (pentamidine) 0.94 [37]
ε2 Efficacy of stage II treatment (nifurtimox-eflornithine) 0.965 [38]
ζ Treatment seeking rate of stage II patients See Table2 Estimated
p Probability of death due to stage II treatment
failure (nifurtimox-eflornithine)
Discussion
We developed a mathematical model of HAT transmis-sion calibrated to data from Boffa East in Guinea to evaluate the effectiveness of vector control combined with active screening to eliminate HAT as a public health problem in this disease focus. Annual vector con-trol combined with annual or biennial active screening and treatment is predicted to achieve the WHO HAT elimination goal by 2020 in Boffa East, if maintained at the current efficacy. Vector control alone leads to at least a 77 % probability of achieving the elimination goal. If current control efficacies cannot be sustained, lower probabilities of elimination by 2020 are predicted. In the presence of a non-human animal reservoir, our model predicts an increased risk of HAT reemerging as a public health problem in Boffa East after 2025, if control efforts are not continued after the public health elimination goal is achieved in 2020.
While active screening and treatment has effectively controlled HAT in many foci [27], some areas that have not concomitantly adopted vector control have failed to bring HAT under control [7]. There is also evidence to suggest that there are asymptomatic carriers and sero-positive cases who are not detected by parasitological techniques, which will likely limit the effectiveness of active screening and treatment for breaking the HAT transmission cycle [25, 28, 29].
Consistent with a mathematical model fitted to data from the Democratic Republic of Congo [39], our model does not inform the question of whether there exists a non-human animal reservoir. However, the existence of a NHA reservoir impacts the chance of sustaining HAT elimination. We found that, in the presence of a non-human animal reservoir, HAT was more resistant to elim-ination, with a heightened risk of becoming a public health problem after 2020 again if control efforts are interrupted. Moreover, when there is a NHA transmission reservoir, using vector control strategies to complement HAT treat-ment programs is crucial to achieve elimination.
The impact of control strategies in disease foci depends on the trypanosomiasis prevalence among tsetse and NHA reservoir. As the tsetse and NHA prevalence in Boffa is relatively low [12], it may take longer to reach elimination in higher intensity areas. For example, Rock et al. [39] showed that HAT elimination in the high endemicity re-gion of Democratic Republic of Congo is highly unlikely to be reached by 2020 with current controls. Regardless, con-trol efforts should be sustained following HAT elimination as a public health problem, as the possibility of a NHA res-ervoir poses a risk for reemergence, as would transmission from surrounding regions. Although we assumed specific ratios of human to tsetse and humans to NHA different ra-tios would have a marginal impact on our results, as these variations will be absorbed into the transmission parame-ters that were fitted to prevalence data.
The data from medical surveys conducted in Guinea use the Trypanolysis test (TL) to ensure accuracy of HAT patient reporting. However, many countries rely on CATT and, if positive, a parasitology test for confirm-ation. As CATT has a relatively low specificity and a parasitology test has a relatively low sensitivity, many foci will suffer from under- or over-diagnosis, respect-ively. Such misdiagnosis will implicitly lower or raise the stringency of the elimination threshold, respectively.
Previous studies have suggested that tsetse may bite a host more than once per feeding cycle, shortening the feed-ing interval of tsetse flies to less than three days [30, 31]. A shorter cycle increases the biting rate of tsetse, resulting in a higher probability that an infected tsetse fly will infect a susceptible host, and thus increasing the effectiveness of vector control.
[image:7.595.56.291.102.288.2]In our study, we assumed that tsetse feed randomly on individuals in a given species, such that individuals are equally likely to be bitten by tsetse, and thereby exposed
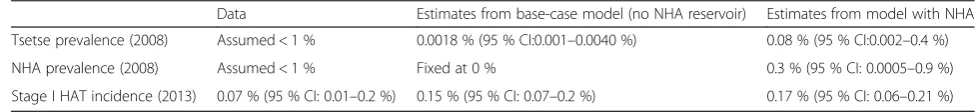
Table 3Model calibration to tsetse and NHA trypanosome prevalence and validation to 2013 stage I HAT incidence
Data Estimates from base-case model (no NHA reservoir) Estimates from model with NHA
Tsetse prevalence (2008) Assumed < 1 % 0.0018 % (95 % CI:0.001–0.0040 %) 0.08 % (95 % CI:0.002–0.4 %)
NHA prevalence (2008) Assumed < 1 % Fixed at 0 % 0.3 % (95 % CI: 0.0005–0.9 %)
[image:7.595.51.541.677.733.2]Stage I HAT incidence (2013) 0.07 % (95 % CI: 0.01–0.2 %) 0.15 % (95 % CI: 0.07–0.2 %) 0.17 % (95 % CI: 0.06–0.21 %)
Table 2Prior and posterior distribution of parameter estimatesa
No non-human animal reservoir (Base-case)
Parameter Prior Median (95 % CI)
βVH U(0.1,0.6) 0.3750 (0.1698, 0.5626)
βH U(0,1) 0.1751 (0.0778,0.8550)
1/ζ U(0,252) 202 (97,250)
x - 0.0503
With non-human animal reservoir
Parameter Prior Median (95 % CI)
βVH U(0.1,0.6) 0.3020 (0.1021, 0.5932)
βH U(0,1) 0.0076 (0.0011,0.3265)
1/ζ U(0,252) 203 (101, 243)
βL U(0,1) 0.1345 (0.0476, 0.6619)
x - 0.0503
a
Fig. 4Probabilities of HAT elimination as public health problem by the end of 2020 (a) in the absence of a non-human animal (NHA) reservoir, and (b) with an NHA reservoir. All controls were implemented either annually or biennially and different colors represent different reduction levels of vector control efficacy and active screening coverage relative to 2012 efficacy and coverage
[image:8.595.59.538.86.356.2] [image:8.595.54.540.390.695.2]to trypanosomiasis. However, empirical studies have ob-served heterogeneity in exposure to tsetse bites within humans and livestock [21, 32]. Within-species heterogeneity suggests that either tsetse flies may be preferentially feeding on certain individuals within a given species or that some in-dividuals are geographically more exposed to tsetse habitats. Notwithstanding variation in tsetse bite exposure, some individuals may be more genetically susceptible to HAT in-fection [28], which could impact elimination goals. For ex-ample, a reservoir of undiagnosed cases who maintain a transmission reservoir will truncate the effectiveness of case finding and treatment. Similarly, clustering of incidence in remote sub-populations will also limit the effectiveness of human-targeted control interventions. Heterogeneities in tsetse exposure would be important to explore in future work assessing the sustainability of HAT elimination [21].
Given that tsetse population sizes fluctuate seasonally and vary between foci [15], human exposure to tsetse and therefore HAT transmission dynamics may exhibit seasonal and geographical variation [33]. Our model ac-counts for the impact of seasonal variation on the effi-cacy of insecticide-treated target traps using a relatively simple step function to capture the decrease in traps ef-ficacy over time from seasonal and non-seasonal factors. With data from enhanced surveillance techniques across wider areas, future modeling may be able to explicitly incorporate seasonality in tsetse population dynamics and human–tsetse contact.
Conclusion
We evaluated the feasibility of HAT elimination goal by 2020 in Boffa East focus using a data-driven mathematical model by calculating probabilistic estimates of whether the current HAT control program is likely to achieve HAT elimination as a public health problem by 2020. Our ana-lysis revealed that combinations of annual vector control with active-screening will most likely meet the WHO 2020 elimination goal. Furthermore, the combined control implemented with the coverage and efficacy achieved in 2012 is predicted to be sufficient to reduce incidence below 1 case per 100,000 people by 2020. As vector con-trol works synergistically with active screening and treat-ment, using a combined approach for Boffa has the potential to meet the WHO goal by 2020 in Boffa focus.
Additional file
Additional file 1:Model Equations.(PDF 73 kb)
Competing interests
The authors declare that they have no competing of interests.
Authors’contributions
AP, KEA, BB, MC, SA, APG, and MLN-M conceived the study; AP performed analysis; AP, KEA, and MLN-M interpretation of the data; AP, KEA, APG, and MLN-M wrote and revised the manuscript. All authors read and approved the final manuscript.
[image:9.595.55.540.88.361.2]Acknowledgements
AP, KEA, SA, APG, and MLNM gratefully acknowledge funding of the NTD Modelling Consortium by the Bill and Melinda Gates Foundation in partnership with the Task Force for Global Health. BB and MC gratefully acknowledge funding from Bill and Melinda Gates Foundation (grant number 1017770) and the World Health Organization (medical surveys). The authors thank Kat Rock for her comments on the manuscript, and Philippe Solano for data provision. Simulations were run using the Yale University Biomedical High Performance Computing Center, which is supported by NIH grants RR19895 and RR029676-01. The views, opinions, assumptions or any other information set out in this article are solely those of the authors.
Author details
1
Center for Infectious Disease Modeling and Analysis, Yale School of Public Health, New Haven, CT 06510, USA.2HAT National Control Program, Ministry of Health, Conakry, Republic of Guinea.3UMR INTERTRYP IRD/CIRAD, TA A 17/G, Campus International de Baillarguet, 34398, Montpellier cedex 5, France.4Department of Epidemiology of Microbial Diseases, Yale School of Public Health, New Haven, CT 06510, USA.
Received: 29 August 2015 Accepted: 29 September 2015
References
1. Brun R, Blum J, Chappuis F, Burri C. Human African trypanosomiasis. Lancet. 2010;375:148–59.
2. Davis S, Aksoy S, Galvani A. A global sensitivity analysis for African sleeping sickness. Parasitology. 2011;138:516–26.
3. Simarro PP, Cecchi G, Paone M, Franco JR, Diarra A, Ruiz JA, et al. The Atlas of human African trypanosomiasis: a contribution to global mapping of neglected tropical diseases. Int J Health Geogr. 2010;9:57.
4. World Health Organization. Accelerating work to overcome the global impact of neglected tropical diseases–A roadmap for implementation. 2012. 5. World Health Organization. Report of a WHO meeting on elimination of
African trypanosomiasis (Trypanosoma brucei gambiense). 3-5 December 2012, Geneva, Switzerland. WHO/HTM/NTD/IDM 2013.
6. Aksoy S, Caccone A, Galvani AP, Okedi LM. Glossina fuscipes populations provide insights for human African trypanosomiasis transmission in Uganda. Trends Parasitol. 2013;29:394–406.
7. Solano P, Torr SJ, Lehane MJ. Is vector control needed to eliminate gambiense human African trypanosomiasis? Front Cell Infect Microbiol. 2013;3:33.
8. Dyer NA, Lawton SP, Ravel S, Choi KS, Lehane MJ, Robinson AS, et al. Molecular phylogenetics of tsetse flies (Diptera: Glossinidae) based on mitochondrial (COI, 16S, ND2) and nuclear ribosomal DNA
sequences, with an emphasis on the palpalis group. Mol Phylogenet Evol. 2008;49:227–39.
9. Rayaisse JB, Esterhuizen J, Tirados I, Kaba D, Salou E, Diarrassouba A, et al. Towards an optimal design of target for tsetse control: comparisons of novel targets for the control of Palpalis group tsetse in West Africa. PLoS Negl Trop Dis. 2011;5:e1332.
10. Steverding D. The history of African trypanosomiasis. Parasit Vectors. 2008;1:3.
11. Simarro PP, Diarra A, Postigo JAR, Franco JR, Jannin JG. The human african trypanosomiasis control and surveillance programme of the world health organization 2000–2009: The way forward. PLoS Negl Trop Dis. 2011;5(2):e1007.
12. Kagbadouno MS, Camara M, Rouamba J, Rayaisse J-B, Traoré IS, Camara O, et al. Epidemiology of sleeping sickness in Boffa (Guinea): where are the trypanosomes? PLoS Negl Trop Dis. 2012;6:e1949.
13. Camara M, Kaba D, KagbaDouno M, Sanon JR, Ouendeno FF, Solano P. [Human African trypanosomiasis in the mangrove forest in Guinea: epidemiological and clinical features in two adjacent outbreak areas]. Med Trop. 2005;65:155–61.
14. Ilboudo H, Jamonneau V, Camara M, Camara O, Dama E, Léno M, et al. Diversity of response to Trypanosoma brucei gambiense infections in the Forecariah mangrove focus (Guinea): perspectives for a better control of sleeping sickness. Microbes Infect. 2011;13:943–52.
15. Rogers DJ. A general model for the African trypanosomiases. Parasitology. 1988;97(Pt 1):193–212.
16. Medlock J, Atkins KE, Thomas DN, Aksoy S, Galvani AP. Evaluating paratransgenesis as a potential control strategy for African trypanosomiasis. PLoS Negl Trop Dis. 2013;7:e2374.
17. Walshe DP, Lehane MJ, Haines LR. Post eclosion age predicts the prevalence of midgut trypanosome infections in Glossina. PLoS One. 2011;6:e26984. 18. Rock KS, Stone CM, Hastings IM, Keeling MJ, Torr SJ, Chitnis N. Mathematical
Models of Human African Trypanosomiasis Epidemiology. Adv. Parasitol., 2015;87:53–133
19. Van Meirvenne N, Magnus E, Buscher P. Evaluation of variant specific trypanolysis tests for serodiagnosis of human infections with Trypanosoma brucei gambiense. Acta Trop. 1995;60:189–99.
20. Jamonneau V, Bucheton B, Kaboré J, Ilboudo H, Camara O, Courtin F, et al. Revisiting the immune trypanolysis test to optimise epidemiological surveillance and control of sleeping sickness in West Africa. PLoS Negl Trop Dis. 2010;4:e917. 21. Courtin F, Camara M, Rayaisse J-B, Kagbadouno M, Dama E, Camara O, et al.
Reducing Human-Tsetse Contact Significantly Enhances the Efficacy of Sleeping Sickness Active Screening Campaigns: A Promising Result in the Context of Elimination. PLoS Negl Trop Dis. 2015;9:e0003727.
22. Vale GA, Hargrove JW, Lehane MJ, Solano P, Torr SJ. Optimal strategies for controlling riverine tsetse flies using targets: a modelling study. PLoS Negl Trop Dis. 2015;9:e0003615.
23. Ndeffo Mbah ML, Gilbert JA, Galvani AP. Evaluating the potential impact of mass praziquantel administration for HIV prevention in Schistosoma haematobium high-risk communities. Epidemics. 2014;7:22–7. 24. Poole D, Raftery AE. Inference for Deterministic Simulation Models: The
Bayesian Melding Approach. J Am Stat Assoc. 2000;95:1244. 25. Funk S, Nishiura H, Heesterbeek H, Edmunds WJ, Checchi F. Identifying
transmission cycles at the human-animal interface: the role of animal reservoirs in maintaining gambiense human african trypanosomiasis. PLoS Comput Biol. 2013;9:e1002855.
26. Pandey A, Mubayi A, Medlock J. Comparing vector-host and SIR models for dengue transmission. Math Biosci. 2013;246:252–9.
27. Welburn SC, Maudlin I. Priorities for the elimination of sleeping sickness. Adv Parasitol. 2012;79:299–337.
28. Bucheton B, MacLeod A, Jamonneau V. Human host determinants influencing the outcome of Trypanosoma brucei gambiense infections. Parasite Immunol. 2011;33:438–47.
29. Jamonneau V, Ilboudo H, Kaboré J, Kaba D, Koffi M, Solano P, et al. Untreated human infections by Trypanosoma brucei gambiense are not 100% fatal. PLoS Negl Trop Dis. 2012;6:e1691.
30. Baylis M. Effect of defensive behaviour by cattle on the feeding success and nutritional state of the tsetse fly, Glossina pallidipes (Diptera: Glossinidae). Bull Entomol Res. 1996;86:329–36.
31. Hargrove JW, Ouifki R, Kajunguri D, Vale GA, Torr SJ. Modeling the control of trypanosomiasis using trypanocides or insecticide-treated livestock. PLoS Negl Trop Dis. 2012;6:e1615.
32. Torr SJ, Prior A, Wilson PJ, Schofield S. Is there safety in numbers? The effect of cattle herding on biting risk from tsetse flies. Med Vet Entomol. 2007;21:301–11.
33. Franco JR, Simarro PP, Diarra A, Jannin JG. Epidemiology of human African trypanosomiasis. Clin Epidemiol. 2014;6:257–75.
34. The World Factbook. [https://www.cia.gov/library/publications/the-world-factbook/rankorder/2102rank.html]Accessed Aug 12, 2015.
35. Checchi F, Filipe JAN, Haydon DT, Chandramohan D, Chappuis F. Estimates of the duration of the early and late stage of gambiense sleeping sickness. BMC Infect Dis. 2008;8:16.
36. Checchi F, Francesco C, Sebastian F, Daniel C, Haydon DT, François C. Updated estimate of the duration of the meningo-encephalitic stage in gambiense human African trypanosomiasis. BMC Res Notes. 2015;8:292. 37. Doua F, Miezan TW, Sanon Singaro JR, Boa Yapo F, Baltz T. The efficacy of
pentamidine in the treatment of early-late stage Trypanosoma brucei gambiense trypanosomiasis. Am J Trop Med Hyg. 1996;55:586–8. 38. Priotto G, Kasparian S, Mutombo W, Ngouama D, Ghorashian S, Arnold U, et
al. Nifurtimox-eflornithine combination therapy for second-stage African Trypanosoma brucei gambiense trypanosomiasis: a multicentre, randomised, phase III, non-inferiority trial. Lancet. 2009;374:56–64. 39. Rock K, Torr SJ, Keeling MJ. Quantitative evaluation of the strategy to