A novel fluorescent sensor protein for detecting changes in airway surface
liquid glucose concentration
Nordine Helassa*, James P. Garnett†, Matthew Farrant†, Faaizah Khan‡, John C. Pickup‡, Klaus M. Hahn§, Christopher J. MacNevin§, Robert Tarran§and Deborah L. Baines†1
*Institute of Cardiovascular and Cell Science, St George’s, University of London, London SW17 0RE, U.K.
†Institute for Infection and Immunity, St George’s, University of London, London SW17 0RE, U.K.
‡Diabetes Research Group, King’s College London, Guy’s Hospital Campus, London SE1 1UL, U.K.
§Department of Pharmacology/Cell Biology & Physiology, University of North Carolina, Chapel Hill, NC, 27599 U.S.A.
Both lung disease and elevation of blood glucose are associated with increased glucose concentration (from 0.4 to∼4.0 mM) in the airway surface liquid (ASL). This perturbation of ASL glucose makes the airway more susceptible to infection by respiratory pathogens. ASL is minute (∼1μl/cm2) and the measurement
of glucose concentration in the small volume ASL is extremely difficult. Therefore, we sought to develop a fluorescent biosensor with sufficient sensitivity to determine glucose concentrations in ASL in situ. We coupled a range of environmentally sensitive fluorophores to mutated forms of a glucose/galactose-binding protein (GBP) including H152C and H152C/A213R and determined their equilibrium binding properties. Of these, GBP H152C/A213R–BADAN (Kd0.86+−0.01 mM,Fmax/F03.6) was optimal for glucose sensing and in ASL increased fluorescence
when basolateral glucose concentration was raised from 1 to 20 mM. Moreover, interpolation of the data showed that the glucose concentration in ASL was increased, with results similar to that using glucose oxidase analysis. The fluorescence of GBP H152C/A213R–BADAN in native ASL from human airway epithelial cultures in situwas significantly increased over time when basolateral glucose was increased from 5 to 20 mM. Overall our data indicate that this GBP is a useful tool to monitor glucose homoeostasis in the lung.
Key words: airway epithelial cell, airway surface liquid, BADAN, glucose, glucose-binding protein.
INTRODUCTION
The respiratory tract is covered by a thin layer of fluid that lines the luminal surface of the epithelium [airway surface liquid (ASL)], which is important for lung defence against infection. In the upper airway, glucose concentrations are normally∼0.4 mM, 12.5 times lower than in plasma at∼5 mM, which serves to deprive bacteria of a potential food source and thus limits bacterial growth [1– 4]. There is accumulating evidence that glucose concentrations are raised in patients (up to 4 mM) during airway inflammation (e.g. in respiratory disease), when blood glucose levels are increased (e.g. in diabetes mellitus) and, more potently, when both are present. Similar changes can also be detected in the ASL of in vitro models of airway epithelium in response to basolateral hyperglycaemia and pro-inflammatory stimuli [5–7]. The increase in ASL glucose concentrations makes the airways more susceptible to infection from pathogens such as methicillin-resistantStaphylococcus aureusandPseudomonas aeruginosa.
Measurement of glucose concentrations in the airways and distal lungs of patients, in in vivo models of airways disease and in vitro models of airway epithelium is difficult because of limited accessibility, the thinness of the ASL (∼7μm) and low concentrations of glucose obtained when dilution techniques are used (e.g. brochoalveolar lavage and exhaled breath condensate). Standard techniques such as glucose oxidase analysis or HPLC are concentration-limited and time-consuming respectively. Moreover, neither technique enables real-time dynamic changes in ASL glucose concentration in response to hyperglycaemic/pro-inflammatory challenge to be measured. The
development of biosensors to measure glucose in the airway
in vitro and in vivowill be a useful tool to better understand ASL glucose homoeostasis, how it is changed with inflammation and hyperglycaemia and how it modifies the innate immunity in the ASL.
Recently, the development of molecular glucose sensors for less invasive continuous monitoring of plasma glucose in patients has received significant interest in the field of diabetes research. One of these biosensors employs glucose/galactose-binding protein (GBP) which alters its conformation when glucose binds. This protein has been covalently linked to environmentally sensitive fluorophores which allow glucose binding to be detected as a change in fluorescence [8,9]. Native bacterial GBP has a very low dissociation constant (Kd2μM) [8] which is not appropriate for ASL glucose measurement. However, in the present study we have used mutated forms of the GBP with altered binding constants (GBP H152C and GBP H152C/A213R), covalently bound to environmentally sensitive fluorophores. The molecular glucose sensors were characterized in terms of affinity and dynamic range, and their potential for measurement of glucose in ASL
in situwas assessed.
EXPERIMENTAL Materials
Escherichia coli XL10-Gold and BL21(DE3) Gold cells were purchased from Stratagene. EZ-Run protein ladder was purchased
Abbreviations: ASL, airway surface liquid; EMEM, Eagle’s minimal essential medium; GBP, glucose/galactose-binding protein; HBEC, human bronchial epithelial cell; Ni-NTA, Ni2+-nitrilotriacetate; PSS, physiological salt solution; TCEP, tris-(2-carboxyethyl)phosphine.
Table 1 Summary of the biophysical characteristics of GBP-labelled mutants
The asterisks (*) indicate that fluorescence was decreased upon glucose binding.
Protein Fluorophore λexc/λem Kd(mM) n R2 Fmax/F0
GBP H152C IANBD 470/535 0.18+−0.01 1.8+−0.1 0.98 3.6
Blue Oxazine 637/666 0.22+−0.03 0.7+−0.1 0.57 1.3
Nile Blue 625/670 0.19+−0.02 0.8+−0.1 0.51 1.4
Chromis 678 677/701 0.046+−0.002 1.4+−0.1 0.93 1.4
mero53 594/618 0.65+−0.01 1.8+−0.1 0.93 1.8*
mero87 591/616 0.68+−0.02 1.1+−0.1 0.90 1.8*
GBP H152C/A213R BADAN 387/535 0.86+−0.01 1.2+−0.1 0.99 3.5
Blue Oxazine 637/666 4.6+−0.3 1.1+−0.1 0.80 1.3
Nile Blue 625/670 11.4+−0.5 0.8+−0.1 0.93 1.7
Chromis 678 677/701 15.2+−0.3 1.1+−0.1 0.98 1.4
mero62 586/608 1.4+−0.1 1.2+−0.1 0.97 1.7
from Fisher Bioreagents and Ni2+-nitrilotriacetate (Ni-NTA) resin
from Qiagen. IANBD, Click-iT®Protein Reaction Buffer kit and iodoacetamide alkyne were obtained from Life Technologies. BADAN, oxazine derivatives (Blue Oxazine, Red Oxazine and Nile Blue) and Chromis dyes (Chromis 630 and 678) were purchased from Eurogentec, Chromeon and Cyanagen, respectively. The merocyanine dyes (Mero 53, 62 and 87) were synthesized as previously described [10–12]. Texas Red–dextran was obtained from Life Technologies.
Expression and purification of GBP proteins
The expression vectors pET303-GBP H152C and pET303-GBP H152C/A213R were used for the production of the GBP mutants [8]. GBP proteins were overexpressed inE. coliBL21(DE3) Gold. Cells were grown at 37◦C and expression was induced overnight at 20◦C in the presence of 0.5 mM IPTG. Cells were pelleted by centrifugation and processed as previously described [9]. Briefly, cells were resuspended in 50 mM NaH2PO4, 300 mM NaCl,
10 mM imidazole and 5 mM tris-(2-carboxyethyl)phosphine (TCEP), pH 8, supplemented with Complete EDTA-free protease inhibitor cocktail (Roche). The suspension was incubated on ice with 1 mg·ml−1 lysozyme for 30 min before lysis by sonication
(VibraCell, Jencons PLS), clarified by centrifugation and purified by Ni-chromatography on an ¨AKTA Purifier system (GE Healthcare) at 4◦C. The 5 ml Ni-NTA column was equilibrated with 50 mM NaH2PO4, 300 mM NaCl, 10 mM imidazole and
5 mM TCEP, pH 8. The purified protein was eluted in buffer containing 300 mM imidazole and stored at −80◦C. Purity of the eluted fractions was determined by SDS/PAGE.
Measurement of protein concentration
Protein concentration was determined using a Nanodrop 1000 spectrophotometer (Thermo Scientific) with a molar absorption coefficient (εo) of 37,930 M−1·cm−1, calculated from the amino
acid composition [13].
Protein labelling using thiol-reactive dyes (IANBD, BADAN, mero53, mero62 and mero87)
For labelling with UV-excitable fluorophores, GBP proteins (100μM) were incubated in the presence of 10-fold excess of dye (IANBD or BADAN) overnight at 4◦C in PBS and 5 mM TCEP,
pH 7.4 [14]. The excess of dye was removed by gel filtration using a PD-10 column (GE Healthcare). For labelling with merocyanine dyes, 100μM of protein were mixed with 5-fold excess of dye for 2 h at room temperature in PBS, pH 7.4. The excess of dye was removed by extensive dialysis in PBS, pH 7.4 at 4◦C (Slide-a-Lyser 10 kDa cut-off, Pierce).
Protein labelling using click chemistry for oxazine derivatives (Blue Oxazine, Red Oxazine, Nile Blue) and chromis dyes (Chromis 630, Chromis 678)
First, GBP-alkyne was obtained by incubating 100μM GBP with 10-fold excess of iodoacetamide alkyne in PBS and 2.5 mM TCEP, pH 7.4, for 2 h at room temperature. The excess of iodoacetamide alkyne was removed by extensive dialysis in PBS, pH 7.4, at 4◦C (Slide-a-Lyser 10 kDa cut-off, Pierce). The second step of the process consisted of labelling the GBP-alkyne with the dye azide using the Click-iT® Protein Reaction Buffer kit following the manufacturer’s recommendations. Briefly, 40μM GBP-alkyne was incubated with 2.5-fold excess of dye in 100μM reaction buffer containing 25μl of copper sulfate reagent and 25μl of kit additive 1, for 1 h at room temperature (Vt=500μl).
The excess of dye was removed by extensive dialysis in PBS, pH 7.4, at 4◦C (Slide-a-Lyser 10 kDa cut-off, Pierce).
Equilibrium glucose binding
Equilibrium glucose-binding curves were obtained by continuous titration followed by corrections for dilution and photobleaching. To determine the fluorescence dynamic range (Fmax/F0), the co-operativity (n) and the dissociation constant (Kd) of the labelled
GBP proteins, glucose affinity assays were performed using an automated syringe pump (ALADDIN 1000, WPI). Labelled GBP proteins (40–100 nM) were titrated continuously withD-glucose at 10–20μl/min flow rate in a stirred 3 ml cuvette, in PBS, pH 7.4. Fluorescence was measured at fluorophore excitation and emission wavelength peaks (Table 1) at 20◦C on a Fluorolog3 spectrofluorimeter (Horiba Scientific). Data are expressed as the means+−S.E.M. of triplicates. The fluorescence changes were normalized and fitted to the Hill equationY=Bmax×Xn/(Kdn+Xn)
using Prism GraphPad 6 software.
Fluorescence stability at 37◦C of GBP H152C/A213R– BADAN (100 nM) was monitored over 7 h (λexc387 nm andλem
Cell culture and ASL glucose measurement Calu-3 cells
The human adenocarcinoma-derived cell line, Calu-3 [15], was grown in Eagle’s minimal essential medium (EMEM) plus 10%FBS, 2 mML-glutamine, 100 units/ml penicillin, 100μg/ml streptomycin, and 1%non-essential amino acids (Sigma) and incubated in humidified air containing 5%CO2at 37◦C. Calu-3
cells were seeded on to clear Costar Transwell® inserts
(0.45-μm pore size) at 250 000 cells/cm2 to form confluent polarized
monolayers, as previously described [16]. Experiments were carried out 10–14 days post-seeding. Calu-3 cells were bathed with 100μl of glucose-free physiological salt solution (PSS) (117 mM NaCl, 25 mM NaHCO3, 4.7 mM KCl, 1.2 mM MgSO4,
1.2 mM KH2PO4 and 2.5 mM CaCl2) on the apical surface and
1 ml of PSS on the basolateral side supplemented with 1, 2, 5, 10, 15 or 20 mM glucose, in a 95%O2/5%CO2gassed incubator
at 37◦C. The ASL was collected after 1 h or 24 h. GBP–BADAN (2μl) was added to 48μl of ASL and fluorescence measured on a Fluorolog3 spectrofluorimeter (Horiba Scientific) atλexc387 nm
andλem535 nm. The remaining 50μl of ASL was analysed using
glucose oxidase (Glucox).
Primary human bronchial epithelial cells
Primary human bronchial epithelial cells (HBECs) were obtained from endobronchial brushings or extracted from explanted lungs and cultured as previously described [17–19]. HBECs were obtained in accordance with approval from the relevant ethics committees: The University of North Carolina at Chapel Hill Biomedical Institutional Review Board (protocol #03-1396). Cells were transferred on to transwell permeable supports and grown at air–liquid interface to form confluent monolayers. Cells were studied 3–5 weeks post-seeding. For ASL glucose studies, cells were transferred into Hepes-buffered PSS (24 mM Hepes, 101 mM NaCl, 12 mM NaHCO3, 1.2 mM MgCl2, 1.2 mM
CaCl2·2H2O and 5.2 mM KCl) and the apical surface washed with
100μl. PSS (20μl) containing 0.1 mg/ml Texas Red–dextran 10 000 Mr (Life Technologies) and 2μl of a 50μM solution of GBP–BADAN were added to the apical surface and the fluorescence emission of Texas Red and BADAN was analysed from five different areas of the transwell surface using a Infinite M1000 plate reader (Tecan). To initiate the experiment, 5 mMD -glucose, 10 mMD-glucose, 20 mMD-glucose, 5 mMD-glucose plus 5 mM L-glucose (osmotic control for 10 mM D-glucose), or 5 mMD-glucose plus 15 mML-glucose (osmotic control for 20 mM D-glucose), was added to the basolateral chamber and fluorescent readings of the apical surface taken hourly. Data were analysed as the ratio of GBP–BADAN/Texas Red–dextran fluorescence (to correct for changes in ASL fluid volume).
Statistical methods
Groups were compared using ANOVA with Tukey’s post-hoc test. Results are presented as means+−S.E.M., unless otherwise stated.
RESULTS
Equilibrium glucose binding to GBP H152C and H152C/A213R
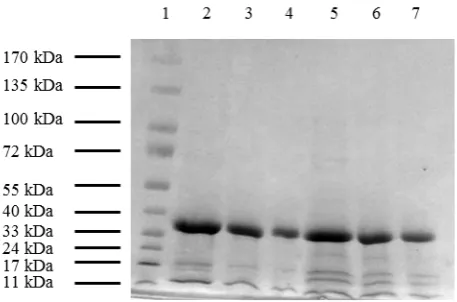
GBP proteins were highly purified on a single-step affinity chromatography column (Figure S1), allowing accurate concentration measurements by spectrophotometry. One litre of culture yielded in 200–250 mg of purified protein.
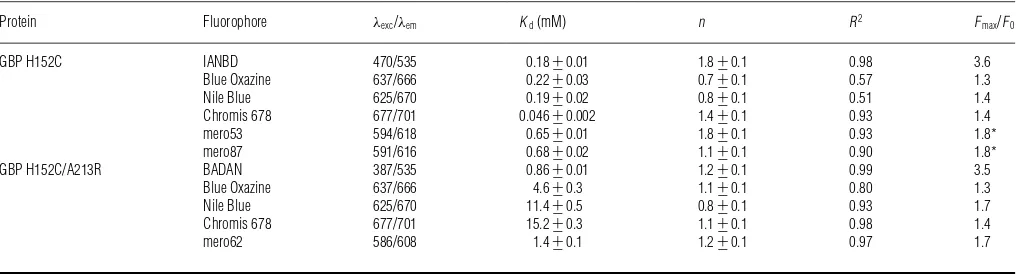
Glucose equilibrium binding for labelled GBP H152C and H152C/A213R showed that using UV-excitable environmentally sensitive dyes such as BADAN and IANBD offered the highest fluorescence dynamic range (Fmax/F0) ranging from 2.7 to 3.6 (Table 1). GBP labelled with long-wavelength excitable dyes showed a maximum fluorescence change upon glucose binding of 80%for GBP H152C coupled to merocyanines. The dissociation constant (Kd) for GBP H152C and GBP H152C/A213R
ranged from 0.046+−0.002 mM to 0.68+−0.02 mM and from 0.86+−0.01 mM to 15.2+−0.3 mM, respectively (Figure 1 and Table 1). For most labelled glucose-binding proteins, glucose binding did not occur with co-operativity as determined by analysis of the Hill coefficient (n). All the parameters obtained from the glucose titration curves are summarized in Table 1. GBP H152C and GBP H152C/A213R labelled with Red Oxazine and Chromis 630 did not show a significant fluorescence change upon glucose binding (results not shown).
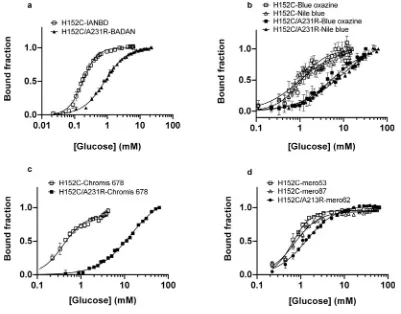
Specificity of GBP H152C/A213R–BADAN (GBP–BADAN) for D-glucose
The specificity of glucose induced fluorescence of GBP–BADAN was analysed in PSS by comparing fluorescence in the presence of
D-glucose, its isomerL-glucose andD-fructose. Fluorescence did not change with increasingD-fructose orL-glucose concentration but exhibited a similar dose response toD-glucose as described above (Figure 2A). There was a significant difference in the mean values between 0.01 and 0 mMD-glucose (i.e. in the presence ofL -glucose) (P= 4.6944×10⁻⁵,n=3). This indicated that the limit
of detection was below 0.01 mM. However, we did not explore this further because values below 0.01 mM were not relevant to our study system. This was also the case for glucose concentrations above 50 mM. The calculated value for precision (3.3×S.D./slope for the linear part of the graph shown in Figure 1) was 0.27 mM.
Comparison of GBP–BADAN fluorescence with glucose oxidase measurement of glucose concentration
Glucose oxidase analysis showed similarD-glucose specificity, with mM values obtained for increasing concentrations of L -glucose and D-fructose being unchanged from 0 (Figure 2B). Interestingly, GBP–BADAN exhibited changes in fluorescence at low concentrations ofD-glucose (from 0.01 mM; Figure 2A). Changes in low glucose concentrations were less discernable by glucose oxidase analysis. Furthermore, changes in fluorescence could be detected at concentrations up to 50 mM where no accurate and repeatable readings could be determined at this concentration by glucose oxidase analysis calibrated for standard glucose measurement (glucose oxidase data not shown). Therefore, GBP–BADAN appears to be a more sensitive probe than glucose oxidase and can measure glucose over a broader range of concentration.
GBP–BADAN to measure hyperglycaemia-induced changes in Calu-3 ASL glucose concentration
Figure 1 Equilibrium glucose titrations for fluorescently labelled GBP H152C and GBP H152C/A213R
Equilibrium glucose titrations for GBP H152C and GBP H152C/A213R, labelled with UV-excitable dyes (A), oxazine derivatives (B), Chromis 678 (C) and Merocyanine dyes (D). Titrations were carried out in at least triplicates and the curves represent the means+−S.E.M. Data were fitted to the Hill equation using GraphPad Prism 6.0 and the fitted parameters are shown in Table 1.
the apical surface and removed after 1 and 24 h, and glucose concentrations measured by glucose oxidase and GBP–BADAN fluorescence. Hyperglycaemia was mimicked by increasing theD -glucose concentration of the basolateral fluid (from 1 to 20 mM), as previously described [6].
GBP–BADAN fluorescence in ASL increased significantly when basolateral D-glucose was elevated from 1 to 5 mM and above (P<0.05, n=4) with maximal values occurring when basolateral glucose was 15–20 mM (P<0.01,n=4). ASL glucose concentrations were higher in samples obtained after 24 h compared with 1 h after elevation of basolateralD-glucose (Figure 3A).
A similar pattern was observed when glucose concentration in the samples of ASL was analysed by glucose oxidase method. At 1 h, glucose concentration in ASL was very low (0.007+−0.002 mM) and at the limit of detection when basolateral D-glucose was 1–2 mM but significantly increased when basolateral glucose was raised to 5 mM (0.3+−0.06 mM in ASL; P<0.01, n=4) and was highest when basolateral D -glucose was increased to 15 mM (1.1+−0.3 mM;P<0.01,n=4). ASL glucose further increased after 24 h rising to 0.6+−0.17 and 5.0+−1.2 mM when basolateralD-glucose was 5 and 15 mM, respectively (Figure 3B). Importantly, ASL glucose concentration remained lower than basolateral glucose at any concentration tested.
Airway epithelial monolayers maintained their transepithelial resistance when glucose in the basolateral chamber was replaced with fructose, as previously reported [22]. As fructose did not bind to GBP–BADAN, ASL from cells grown in basolateral fructose
was used to obtain ASL in which glucose was not present and correct for background fluorescence. Then, using the standard curve (Figure 2C), ASL glucose concentration can be determined. Importantly, the interpolated ASL glucose concentrations were similar to those determined by glucose oxidase analysis at 0.2+−0.1 and 0.8+−0.4 mM when basolateral D-glucose was 5 mM and 2.0+−0.8 and 4.8+−1.1 mM when basolateral D -glucose was 15 mM at 1 and 24 h respectively (Figure 3C). These data indicate that GBP–BADAN fluorescence can be used to accurately measure ASL glucose at similar sensitivity to glucose oxidase analysis.
GBP–BADAN to measure dynamic changes in HBEC ASL glucose concentration in response to hyperglycaemic challengein situ
Figure 2 Titration of BADAN-labelled GBP H152C/A213R (GBP–BADAN) with monosaccharides
Titration of BADAN-labelled GBP H152C/A213R (GBP–BADAN) (A) withD-glucose,L-glucose orD-fructose, in PSS compared with glucose oxidase analysis (B). Fluorescence intensity titration curve
for GBP–BADAN (D-glucose minusD-fructose) (C). This curve was used to interpolate data shown in Figure 3. Titrations were carried out in triplicate and the curves represent the means+−S.E.M. Data were fitted to the Hill equation using GraphPad Prism 6.0. a.u., arbitrary unit (s).
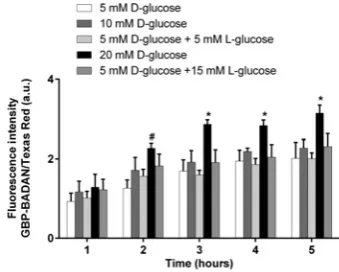
after 3 h (Figure 4). Although no significant difference in GBP– BADAN fluorescence was observed in the ASL of HBECs bathed in 10 mM basolateral glucose compared with 5 mM control, increasing basolateral glucose to 20 mM significantly enhanced fluorescence after 2 h (P<0.05,n=4). The increase in GBP– BADAN fluorescence was maintained throughout the 5 h time-course and was also significantly greater than cells bathed in 5 mM
D-glucose plus 15 mM L-glucose (from 3 h onwards;P<0.05,
n=4), consistent with a glucose-induced change in fluorescence rather than one induced by a difference in osmotic gradients.
The fluorescence of GBP–BADAN was monitored over 7 h at 37◦C and no significant change in fluorescence was observed indicating that the labelled protein was stable over this time course (Figure S2).
DISCUSSION
The world burden of diabetes is increasing both as an independent disease and as co-morbidity with other chronic conditions. In the lung, evidence is accumulating that hyperglycaemia associated with Type 1 and Type 2 diabetes results in increased glucose concentration in the ASL which promotes infection, particularly when associated with underlying respiratory disease [1,5,6,24–
27]. However, measurement of real-time changes of ASL glucose
in vitroandin vivohas not previously been possible.
Evidence indicates that glucose concentrations in the ASL range from approximately 0.4 to 4.0 mM in vivo and in vitro
[1,6,7,24]. In order to efficiently monitor glucose concentrations in ASL in vivo, the biosensors should have a Kd between 0.1
and 10 mM and a high fluorescence dynamic range upon glucose binding. We initially disregarded GBP H152C (which contains a mutation to enable covalent labelling of fluorophores via the cysteine amino acid) because when it was bound to BADAN theKd
was 2μM, somewhat below our ideal range [8,28]. However, our data showed that when bound to other fluorophores, particularly IANBD, a shift in the Kd to higher, more useful, values in the millimolar range could be achieved. Similar increases inKdwere also observed when these fluorophores were attached to GBP H152C/A213R. These data indicate that the molecular structure of the fluorophore bound to these proteins can significantly modify affinity for the ligand, consistent with the findings of others [9,29]. Unfortunately, linking the double mutant to IANBD increased the Kd to ∼32 mM (results not shown), making it unlikely to be suitable for ASL glucose measurement, although it gave the next best dynamic range after BADAN. Interestingly, all the longer wavelength fluorophores, which were designed for
Figure 3 Determination of glucose concentrations in ASL
Determination of glucose concentrations in ASL removed from Calu-3 monolayers grown at air–liquid interface in different basolateral glucose concentrations for 1 and 24 h measured by fluorescence (A) and glucose oxidase analysis (B), using BADAN-labelled GBP H152C/A213R (GBP–BADAN). Glucose concentration calculated by interpolation of fluorescence intensity of GBP–BADAN (C), using graph shown in Figure 2(c). Data represent the means+−S.E.M. Significantly different from 1 mM glucose: *P<0.05, **P<0.01, ***P<0.001,n=4.
were based on optimization of both environmental sensitivity and brightness, as these factors together determine sensitivity in living cells [30]. Of these dyes, GBP H152C/A213R–mero62 was the most promising for further development with aKdof 1.4 mM and
a fluorescence dynamic range of 1.7.
GBP H152C/A213R–BADAN (GBP–BADAN) gave the most usefulKd(0.86+−0.01 mM) and the largest fluorescence dynamic range (Fmax/F03.5) and exhibited clear specificity forD-glucose.
Moreover, we found that it was a better sensor over the range of glucose concentrations required than using the glucose oxidase method. This was in part due to technical limitations of the sensing machine. That is, in order to obtain readings at concentrations below 1 mM, the Glucox analyser has to be re-calibrated differently from settings used to obtain blood glucose readings (2–20 mM). This meant that glucose concentrations in the higher range>10 mM did not give a consistent output value. When measuring glucose in samples of ASL removed from the surface of cells, GBP–BADAN and glucose oxidase analysis showed similar changes with increasing basolateral glucose. Glucose oxidase analysis gave absolute glucose concentrations whereas we obtained fluorescence intensity for GBP–BADAN. We utilized the finding that the presence of basolateralD-fructose (which maintains cell survival) is not sensed by GBP–BADAN to obtain background fluorescence readings for ASL with no glucose. This enabled us to convert the mean fluorescence data into glucose concentration (mM) by interpolation of the standard curve. Glucose concentration values obtained by fluorescence
Figure 4 Dynamic changes in primary human bronchial ASL glucose concentrationin situ
Dynamic changes in primary human bronchial epithelial ASL glucose concentrationin situ, measured as fluorescence of BADAN-labelled GBP H152C/A213R in response to raised basolateral glucose over time. Data are shown as means+−S.E.M. Significantly different from all other columns at time point: *P<0.05; significantly different from 5 mMD-glucose only: #P<0.05,n=4.
[image:6.595.343.513.461.597.2]lower in ASL, consistent with our previous findingsin vitroand
in vivo[6,7,24].
Work by others has shown that highly technical glucose sensor technology using ZnO-coated microelectrodes or a phosphorescence sensing material [crystalline iridium(III)-Zn(II) co-ordination polymers], which utilize glucose oxidase production of H2O2 to quantify glucose, can be useful in
measuring glucose in small fluid volumes such as ASL and over similar ranges of glucose (0.1–6 mM) [26,31,32]. However, the benefit of a fluorescent molecular glucose sensor that is easy to produce and can be used to rapidly measure real-time (and reversible) changes in glucose concentration in ASL overlying cellsin situis particularly attractive. In a unique experiment, we used GBP–BADAN applied directly to the ASL of HBECsin situand showed that glucose concentration rises faster and to higher levels over a time course of 5 h when basolateral glucose concentration was increased from 5 to 20 mM. These data support our model of glucose homoeostasis where raised basolateral glucose concentration increases the driving force for glucose diffusion into ASL. The resultant ASL glucose concentration is the net balance between diffusion and glucose uptake by the epithelial cells. Thus, if uptake remains the same, increased diffusion would result in elevated ASL glucose [33,34].
These experiments now open the way for development of fluorophore-labelled GBPs as biosensors, for use in vitro and
in vivo, to further understand how hyperglycaemia and respiratory disease change ASL glucose concentration in the proximal and distal lung. We now intend to use GBP–BADAN applied directly to ASL of proximal and distal airway cells in vitro
to explore factors regulating glucose homoeostasis.In vivo, we have previously used glucose oxidase sticks to detect glucose in human nasal secretions. We have shown that changes in glucose concentration in nasal secretions are representative of the airway as a whole [24,35,36]. However, these sticks are no longer available, colour change interpretation was subjective and dynamic changes were difficult to measure. Therefore, immobilization of GBP–BADAN and its incorporation into a small fibre-optic probe (<1 mm diameter) for insertion into the nasal cavity, could prove a more accurate and minimally invasive biosensor for detection of glucose in nasal secretions [37]. During our in vitro experiments we did not observe any changes in transepithelial resistance which indicated GBP–BADAN toxicity, but this will need to be tested further. Nevertheless, we hope such tools will be helpful to find new ways to reduce glucose in ASL and help combat respiratory infections.
AUTHOR CONTRIBUTION
Nordine Helassa, James Garnett and Matthew Farrant carried out the experiments. Faaizah Khan and John Pickup developed and provided the GBP mutants. Klaus Hahn and Christopher MacNevin developed and provided the merocyanine dyes. Robert Tarran provided the HBECs and facilities forin situstudies. Deborah Baines designed the project, and Deborah Baines, Nordine Helassa and James Garnett wrote the paper.
ACKNOWLEDGEMENTS
We thank Katalin T¨or¨ok, St George’s, University of London, for the use of her equipment and facilities.
FUNDING
This work was funded by the Medical Research Council [grant number MICA MR/K012770/1] and a St George’s, University of London, Impact and Innovation Award. J.P. and F.K. are grateful to the Engineering and Physical Sciences Research Council (EPSRC) for funding research on the protein engineering of GBP. R.T. was funded by the National Institutes of Health/Food and Drug Administration (FDA) [grant numbers
HL108927 and HL120100]. Research reported in this publication was in part supported by the National Institutes of Health and the FDA Center for Tobacco Products (CTP). The content is solely the responsibility of the authors and does not necessarily represent the official views of the National Institutes of Health or the Food and Drug Administration.
REFERENCES
1 Baker, E. H., Clark, N., Brennan, A. L., Fisher, D. A., Gyi, K. M., Hodson, M. E., Philips, B. J., Baines, D. L. and Wood, D. M. (2007) Hyperglycemia and cystic fibrosis alter respiratory fluid glucose concentrations estimated by breath condensate analysis. J. Appl. Physiol.102, 1969–1975CrossRef PubMed
2 Kalsi, K. K., Baker, E. H., Medina, R. A., Rice, S., Wood, D. M., Ratoff, J. C., Philips, B. J. and Baines, D. L. (2008) Apical and basolateral localisation of GLUT2 transporters in human lung epithelial cells. Pflugers Arch.456, 991–1003CrossRef PubMed 3 Barker, P. M., Boyd, C. A., Ramsden, C. A., Strang, L. B. and Walters, D. V. (1989)
Pulmonary glucose transport in the fetal sheep. J. Physiol.409, 15–27PubMed 4 Saumon, G., Martet, G. and Loiseau, P. (1996) Glucose transport and equilibrium across
alveolar-airway barrier of rat. Am. J. Physiol.270, L183–L190PubMed
5 Garnett, J. P., Baker, E. H., Naik, S., Lindsay, J. A., Knight, G. M., Gill, S., Tregoning, J. S. and Baines, D. L. (2013) Metformin reduces airway glucose permeability and hyperglycaemia-induced Staphylococcus aureus load independently of effects on blood glucose. Thorax68, 835–845CrossRef PubMed
6 Garnett, J. P., Gray, M. A., Tarran, R., Brodlie, M., Ward, C., Baker, E. H. and Baines, D. L. (2013) Elevated paracellular glucose flux across cystic fibrosis airway epithelial monolayers is an important factor forPseudomonas aeruginosa growth. PLoS ONE8, e76283CrossRef PubMed
7 Garnett, J. P., Nguyen, T. T., Moffatt, J. D., Pelham, E. R., Kalsi, K. K., Baker, E. H. and Baines, D. L. (2012) Proinflammatory mediators disrupt glucose homeostasis in airway surface liquid. J. Immunol.189, 373–380CrossRef PubMed
8 Khan, F., Saxl, T. E. and Pickup, J. C. (2010) Fluorescence intensity- and lifetime-based glucose sensing using an engineered high-Kd mutant of glucose/galactose-binding protein. Anal. Biochem.399, 39–43CrossRef PubMed
9 Khan, F. and Pickup, J. C. (2013) Near-infrared fluorescence glucose sensing based on glucose/galactose-binding protein coupled to 651-Blue Oxazine. Biochem. Biophys. Res. Commun.438, 488–492CrossRef PubMed
10 MacNevin, C. J., Gremyachinskiy, D., Hsu, C. W., Li, L., Rougie, M., Davis, T. T. and Hahn, K. M. (2013) Environment-sensing merocyanine dyes for live cell imaging applications. Bioconjug. Chem.24, 215–223CrossRef PubMed
11 Toutchkine, A., Nguyen, D. V. and Hahn, K. M. (2007) Simple one-pot preparation of water-soluble, cysteine-reactive cyanine and merocyanine dyes for biological imaging. Bioconjug. Chem.18, 1344–1348CrossRef PubMed
12 Toutchkine, A., Kraynov, V. and Hahn, K. (2003) Solvent-sensitive dyes to report protein conformational changes in living cells. J. Am. Chem. Soc.125, 4132–4145 CrossRef PubMed
13 Gill, S. C. and von Hippel, P. H. (1989) Calculation of protein extinction coefficients from amino acid sequence data. Anal. Biochem.182, 319–326CrossRef PubMed 14 Torok, K., Tzortzopoulos, A., Grabarek, Z., Best, S. L. and Thorogate, R. (2001) Dual effect
of ATP in the activation mechanism of brain Ca2+/calmodulin-dependent protein kinase
II by Ca2+/calmodulin. Biochemistry40, 14878–14890CrossRef PubMed
15 Shen, B. Q., Finkbeiner, W. E., Wine, J. J., Mrsny, R. J. and Widdicombe, J. H. (1994) Calu-3: a human airway epithelial cell line that shows cAMP-dependent Cl- secretion. Am. J. Physiol.266, L493–L501 PubMed
16 Garnett, J. P., Hickman, E., Burrows, R., Hegyi, P., Tiszlavicz, L., Cuthbert, A. W., Fong, P. and Gray, M. A. (2011) Novel role for pendrin in orchestrating bicarbonate secretion in cystic fibrosis transmembrane conductance regulator (CFTR)-expressing airway serous cells. J. Biol. Chem.286, 41069–41082CrossRef PubMed
17 Brodlie, M., McKean, M. C., Johnson, G. E., Perry, J. D., Nicholson, A., Verdon, B., Gray, M. A., Dark, J. H., Pearson, J. P., Fisher, A. J. et al. (2010) Primary bronchial epithelial cell culture from explanted cystic fibrosis lungs. Exp. Lung Res.36, 101–110 CrossRef PubMed
18 Forrest, I. A., Murphy, D. M., Ward, C., Jones, D., Johnson, G. E., Archer, L., Gould, F. K., Cawston, T. E., Lordan, J. L. and Corris, P. A. (2005) Primary airway epithelial cell culture from lung transplant recipients. Eur. Respir. J.26, 1080–1085CrossRef PubMed 19 Randell, S., Fulcher, M. L., O’Neal, W. and Olsen, J. (2011) Primary epithelial cell models
for cystic fibrosis research. In Cystic Fibrosis (Amaral, M. D. and Kunzelmann, K., eds), pp. 285–310, Humana PressCrossRef
20 Dubin, R. F., Robinson, S. K. and Widdicombe, J. H. (2004) Secretion of lactoferrin and lysozyme by cultures of human airway epithelium. Am. J. Physiol. Lung Cell. Mol. Physiol.286, L750–L755CrossRef PubMed
22 Garnett, J. P., Braun, D., McCarthy, A. J., Farrant, M. R., Baker, E. H., Lindsay, J. A. and Baines, D. L. (2014) Fructose transport-deficient Staphylococcus aureus reveals important role of epithelial glucose transporters in limiting sugar-driven bacterial growth in airway surface liquid. Cell. Mol. Life Sci., doi:10.1007/s00018-014-1635-y 23 Tarran, R. (2004) Regulation of airway surface liquid volume and mucus transport by
active ion transport. Proc. Am. Thorac. Soc.1, 42–46 CrossRef PubMed
24 Baker, E. H., Wood, D. M., Brennan, A. L., Clark, N., Baines, D. L. and Philips, B. J. (2006) Hyperglycaemia and pulmonary infection. Proc. Nutr. Soc.65, 227–235
CrossRef PubMed
25 Baker, E. H. and Bell, D. (2009) Blood glucose: of emerging importance in COPD exacerbations. Thorax64, 830–832CrossRef PubMed
26 Pezzulo, A. A., Asif, M. H., Willander, M. and Zabner, J. (2011)In situ quantification of glucose concentration in airway surface liquid with functionalised ZnO nanorod-coated microelectrodes. J. Anal. Bioanal. Tech.S7, 002PubMed
27 Pezzulo, A. A., Gutierrez, J., Duschner, K. S., McConnell, K. S., Taft, P. J., Ernst, S. E., Yahr, T. L., Rahmouni, K., Klesney-Tait, J., Stoltz, D. A. and Zabner, J. (2011) Glucose depletion in the airway surface liquid is essential for sterility of the airways. PLoS ONE6, e16166CrossRef PubMed
28 Pickup, J. C., Khan, F., Zhi, Z. L., Coulter, J. and Birch, D. J. (2013) Fluorescence intensity- and lifetime-based glucose sensing using glucose/galactose-binding protein. J. Diabetes Sci. Technol.7, 62–71CrossRef PubMed
29 Thomas, K. J., Sherman, D. B., Amiss, T. J., Andaluz, S. A. and Pitner, J. B. (2006) A long-wavelength fluorescent glucose biosensor based on bioconjugates of galactose/glucose binding protein and Nile Red derivatives. Diabetes Technol. Ther.8, 261–268CrossRef PubMed
30 Machacek, M., Hodgson, L., Welch, C., Elliott, H., Pertz, O., Nalbant, P., Abell, A., Johnson, G. L., Hahn, K. M. and Danuser, G. (2009) Coordination of Rho GTPase activities during cell protrusion. Nature461, 99–103CrossRef PubMed
31 Cheng, K. Y., Wang, J. C., Lin, C. Y., Lin, W. R., Chen, Y. A., Tsai, F. J., Chuang, Y. C., Lin, G. Y., Ni, C. W., Zeng, Y. T. and Ho, M. L. (2014) Electrochemical synthesis,
characterization of Ir-Zn containing coordination polymer, and application in oxygen and glucose sensing. Dalton Trans.43, 6536–6547CrossRef PubMed
32 Chang, G., Tatsu, Y., Goto, T., Imaishi, H. and Morigaki, K. (2010) Glucose concentration determination based on silica sol-gel encapsulated glucose oxidase optical biosensor arrays. Talanta83, 61–65CrossRef PubMed
33 Garnett, J. P., Baker, E. H. and Baines, D. L. (2012) Sweet talk – insights into the nature & importance of glucose transport in lung epithelium. Eur. Respir. J.40, 1269–1276 CrossRef PubMed
34 Kalsi, K. K., Baker, E. H., Fraser, O., Chung, Y. L., Mace, O. J., Tarelli, E., Philips, B. J. and Baines, D. L. (2009) Glucose homeostasis across human airway epithelial cell monolayers: role of diffusion, transport and metabolism. Pflugers Arch.457, 1061–1070 CrossRef PubMed
35 Philips, B. J., Meguer, J. X., Redman, J. and Baker, E. H. (2003) Factors determining the appearance of glucose in upper and lower respiratory tract secretions. Intensive Care Med.29, 2204–2210CrossRef PubMed
36 Wood, D. M., Brennan, A. L., Philips, B. J. and Baker, E. H. (2004) Effect of hyperglycaemia on glucose concentration of human nasal secretions. Clin. Sci.106, 527–533CrossRef PubMed
37 Saxl, T., Khan, F., Ferla, M., Birch, D. and Pickup, J. (2011) A fluorescence lifetime-based fibre-optic glucose sensor using glucose/galactose-binding protein. Analyst136, 968–972CrossRef PubMed
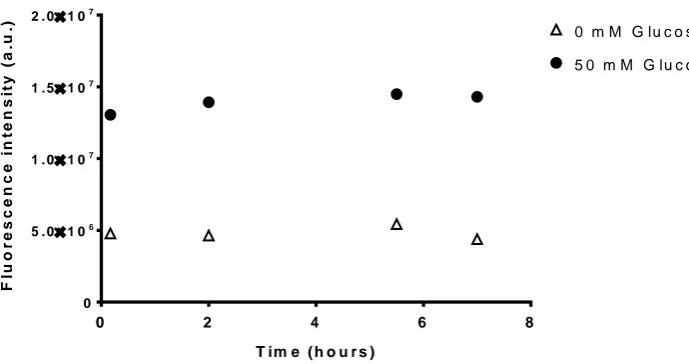
0 2 4 6 8
0 5 . 01 06 1 . 01 07 1 . 51 07 2 . 01 07
T im e ( h o u r s )
F
lu
o
r
e
s
c
e
n
c
e
i
n
te
n
s
it
y
(
a
.u
.) 0 m M G lu c o s e
5 0 m M G lu c o s e
[image:10.595.81.426.198.380.2]