Abstract— Measurements are described of current, voltage
and local dielectric strength for a current interrupter which utilized a novel form of electromagnetically convolved electric arc in Air. Experiments have been performed with various interrupter structures and operational conditions. Pre current zero voltage extinction peaks and post arc local breakdown voltages have been measured and are compared with values for
non convoluted arcs in Nitrogen and SF6. An empirical
relationship between the extinction peak voltage and various design and operational parameters is presented. Signatures for the various interrupter structures under different operational conditions have been obtained using a chromatic methodology and embodying the extinction peak, and a local breakdown voltage.
Index Terms—Arc discharges, magnetic fields, dielectric
measurements, plasma arc devices, plasma control, ablation, data processing.
I. INTRODUCTION
ANYforms of power network current interrupters have been proposed or implemented which involve the use of electromagnetic arc control (e.g. [1], [2]) and appropriate gaseous arcing media. These forms of circuit interrupters have been of interest since they provide the possibility of utilizing the electromagnetic forces available for reducing the external power demands of the interrupter’s operating mechanism. There can also be an enhancement of the thermal energy derived from the arc to assist the arc plasma quenching process [3] whilst producing gentle but effective current interruption with good dielectric recovery properties.
This contribution describes some experimental results obtained with a novel form of electromagnetic arc control [4]. The control is based upon tailoring electromagnetic forces to produce a highly convoluted arc in atmospheric pressure air around the outer periphery of a hollow PTFE cylinder onto
Manuscript received 2 April, 2008
L. M. Shpanin is with the Power System and Control Group, Department of Electronic, Electrical and Computer Engineering, The University of
Birmingham, Edgbaston Birmingham B15 2TT, U.K. (e-mail:
G. R. Jones, J. E. Humphries, J. W. Spencer are with the Centre for Intelligent Monitoring Systems, Department of Electrical Engineering and Electronics, The University of Liverpool, Liverpool L69 3GJ, U.K. (e-mail: [email protected]).
whose surface the arc plasma column is tightly wound by the electromagnetic forces. Experimental measurements are presented for the time variation of the voltage across the convoluted arcs as well as the breakdown voltage at a single location close to (but not across the overall) contact gap, using a dielectric voltage probe energized from its own circuit. Comparisons are made with results for some other forms of electromagnetic arc control units [1], [2]. An empirical relationship is considered for describing the dependence of the magnitude of the arc voltage extinction peak upon various operational parameters. Chromatic processing methods [5] are applied for comparing the signatures of the various interrupters under different operating conditions and which incorporate the extinction peak and local breakdown voltages.
It is shown that the convoluted arc unit is capable of interrupting alternating currents, although the full potential of the approach warrants further investigations.
II. PRINCIPLE OF OPERATION
The principle of operation of the convoluted arc plasma unit is shown on Fig. 1. An electric arc is initially formed vertically between two contacts when they are physically separated. The arc is immediately rotated due to a Lorenz force
(
Iz×Bx)
produced with a suitably orientated B-field (Fig. 1a). Iz is the current through the arc; Bx is the radial component of the B-field produced by a current carrying coil, which is concentric with the contacts axis [4]. As the gap between the contacts increases, the arc column extends axially into regions of different magnetic field orientations (Fig. 1b). The spatial B-field distribution is such that it distorts the arc column by the contrary rotation of the anode and cathode regions of the arc
)
(
Iz×Bx so that it assumes the azimuthal form shown on Fig. 1b and which persists and is maintained by an orthogonal Lorenz force(
Io×Bz)
. If an alternating current sustains the electric arc and the B-field, the B-field coil looses its influence on the arc control (when the current reduces to zero since i=0 and B≈0). The electromagnetically compressed plasma is then released so that the arc helix repels itself azimuthally [6]. In so doing the arc column self-disrupts (Fig. 1c). The azimuthally formed plasma may be contained within an annular gap formed between the coil containing cylinder and a second cylinder of greater diameter and concentric with the coil containingCurrent Interruption Using Electromagnetically
Convolved Electric Arcs in Gases
Leonid M. Shpanin, Gordon R. Jones, Jim E. Humphries, Joseph W. Spencer
cylinder. Such an arrangement provides a means for the arc plasma column to interact with the material forming both walls of the annular gap.
III. EXPERIMENTAL TEST HEADS
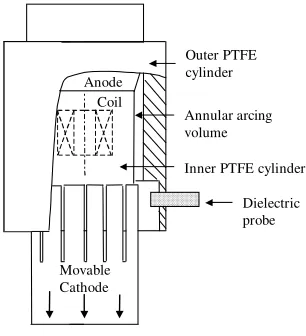
A versatile interrupter unit which enabled the operation principles described in section II to be implemented is shown on Fig. 2. This consisted of a fixed anode, a movable cathode, outer and inner PTFE cylinders, the latter housing the B- field producing coil. The anode was a copper ring fitting within the cylindrical annular gap between the outer and inner PTFE cylinders. The cathode was a copper tube also fitting within this annular space and which carried fingers to mate with the fixed anode when the contact gap was closed. One end of the B-field producing coil was connected to the anode of the contact gap and the other end to a high voltage test circuit (Fig. 3). Thus a B-field could be produced by a fault current flowing through the coil in series with the anode and cathode. During operation, the copper cathode tube slid along the annular gap between the inner and outer PTFE cylinders so that the opening gap and electric arc were gradually exposed to the B-field produced by the coil. The anode and both the inner and outer PTFE cylinders remained fixed at the same positions
as the cathode was retracted.
Five variants (Units A-E) of the basic test head configuration shown on Fig. 2 were used in the present investigations. These are listed on Tables I and II. Conditions which were varied were the presence /absence of a B-field, an outer PTFE cylinder, moving/stationary cathode and background gas and its pressure.
Unit A was used for establishing the rate at which the contact gap was opened so that the length and axial location of the B-field producing coil could be optimized relative to the contact travel. It was also used for some preliminary tests in Nitrogen and SF6 at above ambient pressures. Unit B was used
to check the effect of a B-field with different gap lengths each being kept constant during the entire arcing period (with arc initiation via a fuse wire). Unit C was used to investigate the effect of a time varying contact gap produced by a moving cathode without either a B-field or outer PTFE cylinder to indicate ablation effects from the inner cylinder alone without a B-field. Unit D was used to determine the effect of a moving contact with a B-field and without an outer PTFE cylinder. Unit E was the prototype interrupter with both a B-field and outer PTFE cylinder as shown on Fig. 2. An advantage of
Units B, C and D was the ease with which photographic images of the convoluted arc could be obtained [4], [7]. Units C and D were also used for comparing contact wear with and
Post arc plasma motion c)
Anode
Cathode
Cathode
b) x
z
Coil
) (Io×Bz
) (Iz×Bx
Iarc
Anode
) (Iz×Bx
a)
Anode
Cathode (movablecontact)
Iarc
Arc winding
)
(Iz×Bx PTFE
[image:2.595.93.235.136.449.2]cylinder
Fig. 1. Arc convolution principle.
a) Arc initiation; b) Peak current azimuthal compression; c) Current zero arc rupture.
TABLEI
UNITS TESTED AND PURPOSE
Unit Coil Outer PTFE
Moving Cathode
Closed Chamber
Purpose
A
B
C
D E
No
Yes
No
Yes
Yes Yes
No
No
No
Yes Yes
No
Yes
Yes
Yes
Yes
No
No No
No
Gap-Coil optimised
Fixed length arcs, B>0
Moving cathode, B=0
Moving cathode, B>0
Annular arc, B>0
Movable Cathode
Outer PTFE cylinder
Inner PTFE cylinder Anode
Coil
Annular arcing volume
Dielectric probe
[image:2.595.323.537.185.304.2] [image:2.595.345.498.512.680.2]
without a B-field. Units D and E allowed comparisons to be made to determine the effect of the annular gap between the PTFE cylinders on the current interrupting arc.
Fig. 2 also shows the position within the test units at which dielectric probes were installed for monitoring changes in the breakdown strength of the arc exposed gases. Three test points equally inclined to each other azimuthally at 120 degrees from each other were used at the axial location shown on Fig. 2. These points corresponded to locations at which high-speed photographs reported by Shpanin et. al. [7] suggested that the residence of post arcing hot gases might be extended in time and so form a region of reduced dielectric strength.
IV. TEST CIRCUITS AND EXPERIMENTAL CONDITIONS
The main test circuit consisted of an L-C source connected across the terminals of the interrupter unit under test. With the field interrupter units (Units B, D, E) one terminal of the B-field coil was connected to the L-C source whilst the other coil terminal was connected to the anode of the arc gap (Fig. 3).
At contact separation, Ignitron 1, connected in series with a resistor, was triggered to conduct a quasi steady dc current through the B-field coil and electrodes (connected in series). At a predetermined time, Ignitron 2 was triggered to short circuit the current limiting resistor R1 and the first ignitron (Fig. 3) to produce a half cycle of sinusoidal current tuned to 50Hz by the circuit inductance. Thus this current not only sustained the electric arc between the cathode and anode but
also produced the B-field by passage through the series connected coil. Ignitron 3 controlled the duration of the electric arcing by being triggered to connect the dump resistor R2 30 ms after the switching of Ignitron 2 in order to dump the remaining energy from the capacitor bank. Examples of the time variation of the initial, quasi steady current followed by the half sinusoid current loop are shown on Fig. 4a and b. For
units contained a B-field coil (e.g. Unit E, Air curves, Fig. 4a, b) this current passed through both the arc gap and series connected coil.
The local dielectric strength measurements were made using the technique and circuitry described by Ennis [2] and Mori et. al. [1]. A high voltage source of 16kV (separate from the main power source, Fig. 2) charged a small capacitor C through a series resistor R. A pair of electrodes forming a short gap were
TABLEII
EXAMPLES OF EXPERIMENTAL UNITS AND CONDITIONS INVESTIGATED
Experiment
I peak AC
B peak field
V peak (gas used)
Gap V extinction
(gas used)
Pressure gauge
V recovery (gas used)
kA mT V m V bar V
12.0 12.2
580 N2 900 SF6
0.110 490 N2
700 SF6 3 3
240 N2 230 SF6 14.8
14.0
420 N2 600 SF6
0.093 400 N2
620 SF6 3 3
380 N2 360 SF6 A. Non-rotary arc
reference interrupter: (preliminary arc tests).
18.3 18.0
560 N2 470 SF6
0.068 250 N2
510 SF6 3 3
400 N2 530 SF6
B. Arc control: (with coil).
1.3 33.75 500 Air 0.093 340 Air Atmosphere 340 Air
C. Current interrupter: (no coil).
12.8 320 Air 0.102 250 Air Atmosphere 270 Air
306.35 480 Air 0.122
342.70 363.47 420.59
400 Air 320 Air 250 Air
0.106 0.095 0.070 11.8
13.2 14.0 16.2
420 Air 410 Air 370 Air 190 Air
Atmosphere Atmosphere Atmosphere Atmosphere
230 Air 400 Air 450 Air 390 Air
10.5 272.60 352 Air 0.106 500 Air Atmosphere 240 Air
D. Current interrupter head:
(with the arc-driving coil).
E. Prototype interrupter: (with the arc-driving coil).
11.8 13.3 14.0 15.0 15.8
306.35 345.30 363.47 389.43 410.20
500 Air 320 Air 320 Air 360 Air 260 Air
0.122 0.106 0.095 0.106 0.070
490 Air 430 Air 360 Air 448 Air 180 Air
Atmosphere Atmosphere Atmosphere Atmosphere Atmosphere
280 Air 390 Air 480 Air 490 Air 680 Air
(System voltage is 2.3kV for interrupters A, C, D, E and 1.3kV for B; Quasi-steady current: 2 - 9.3kA).
C
Ignitron 1 R1
Ignitron 2 Ignitron 3
Coil
L-C source
Cathode L
R2
Anode
[image:3.595.83.506.111.385.2]Arc
Fig. 3.Experimental test circuit showing the series connection of the B-field
connected across the capacitor and were located within each interrupter at the axial position shown on Fig. 2. When the voltage across this gap reached the breakdown voltage of the gas, conduction across the gap caused the capacitor C to be discharged. After recovery from breakdown, the voltage across the capacitor increased again because of a charging current of 1mA flowing from the 16kV source. Each time the voltage on the capacitor reached the breakdown voltage the capacitor repeatedly discharged so providing an indication of the time variation of the breakdown voltage at the locations of the probes.
Examples of the experimental conditions investigated are summarized on Table II. Capacitor source voltages up to 2.3kV were used. Quasi steady D.C. currents in the range of 2 - 9.3kA and 50Hz alternating currents of peak values 1.3 to 18.3kA were used with B-fields of 33.75 - 420.59mT. The duration of the ac-arc discharge was set at 10ms, whilst the dc-arc duration was set at a maximum of 10ms depending upon the electrodes gap required at the end of the half cycle of current. The gap between the contacts at current zero at the end of a half cycle of current was in the range 68 to 122mm. With Unit B, several fixed gap lengths were tested but only one example is given in Table II.
Measurements have been made of the current through the interrupter unit, the voltage across the arc gap and the breakdown voltages of the arc-heated gas at the locations shown on Fig. 2.
V. EXPERIMENTAL RESULTS
A. Arc Voltage Results
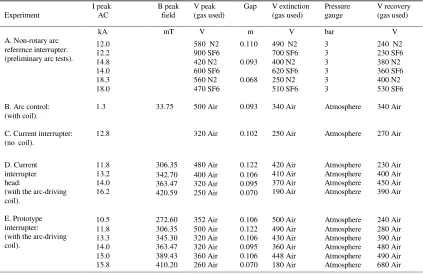
Typical time variations of current through and voltages across the interrupter units are given on Fig. 4 a and b. In these particular tests the initial quasi-steady current was 2kA and the peak alternating current approximately 12.5kA.
Fig. 4 a is for Nitrogen in the reference, non-rotary arc interrupter (unit A, Table II) at 3 bar pressure and Air at atmospheric pressure in the prototype interrupter (unit E, Table II). Fig. 4 b is for SF6 at 3 bar pressure in the reference interrupter (unit A) and Air at atmospheric pressure in the prototype interrupter (unit E).
These results show a general trend for the arc voltage to have quasi steady values during the lower current DC phase and higher levels quasi steady values during the main alternating current period, with a peak (voltage extinction peak) developing just prior to the current zero.
B. Local Breakdown Voltage results
Fig. 5 shows a typical time variation at the axial location of the dielectric probes of the breakdown voltage relative to the pre arcing value.
The operating conditions were with air at atmospheric pressure, 5kA peak alternating current and 16.5ms arcing duration. A substantial decrease in breakdown voltage is
- 50 0 50 100 150
1 51 101 151 201 251 301 351 401 451
18.75
12.50
6. 25
0
-6.25
C
u
rr
en
t
[k
A
]
V
o
lt
ag
e
[V
]
1500
1000
500
0
-500 Current zero
Time [ms]
Trigger Contact separation Quasi-dc 2kA
N2, V
Air, V
-5 0 5 10 15 20 25 30 35 40 a)
I
V
Time [ms]
-50 0 50 100 150
1 51 101 151 201 251 301 351 401 451
18.75
12.50
6. 25
0
-6.25
C
u
rr
en
t
[k
A
]
V
o
lt
ag
e
[V
]
1500
1000
500
0
-500 Current zero
Trigger Contact separation Quasi-dc 2kA
SF6, V
Air, V
-5 0 5 10 15 20 25 30 35 40 250V b)
I
[image:4.595.315.522.90.465.2]V
Fig. 4. Comparisons of interrupter current and voltage: time characteristics.
a) Reference (Unit A, N2, 3bar pressure) and Prototype (Unit E, Air,
atmospheric pressure) interrupters; b) Reference (Unit A, SF6,3bar pressure)
and Prototype (Unit E, Air, atmospheric pressure) interrupters.
0 0.2 0.4 0.6 0.8 1 1.2
0 5 10 15 20 25 30 35 40 45 50 55 60 65 70 75 80 85 90 95 100 105
SF6, 3bar, 4.48kA, 4794N/m, [2]
Air, atmospheric pressure, 5kA, 649N/m, Prototype SF6, atmospheric pressure, 9.5kA, 3876N/m, [1]
-20 -15 -10 -5 0 5 10 15 20 25 30 35 40 45 50 55 60 65 70 75 80
Time wrt start of current[ms]
R
at
io
o
f
b
re
ak
d
o
w
n
v
o
lt
a
g
e
Arc extinction
SF6, 3bar
SF6, At.
Air, At.
Fig. 5. Response of dielectric probe for arc duration of 16.5ms (Prototype
[image:4.595.313.541.531.721.2]apparent during the arcing period, followed by a gradual increase post arcing, tending towards the initial pre-arcing value.
VI. ANALYSIS OF RESULTS
A. Voltage Extinction Peak
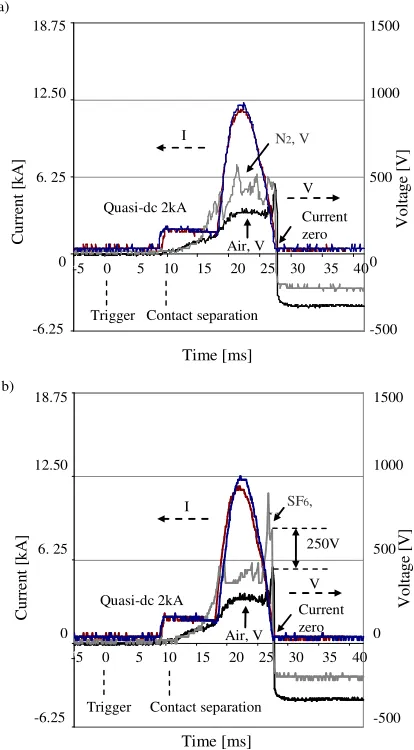
[image:5.595.328.505.160.328.2]Results of the form shown on Fig. 4 a, b and summarized on Table II enable voltage extinction peaks: peak fault current / B field / contact gap characteristics of the form shown on Fig. 6 to be obtained for the various interrupters (e.g. A, D, E). These results show, for example, that the voltage extinction peaks in both Nitrogen and SF6 increase with pressure, the SF6 values
being higher than those for Nitrogen and Air. (E.g. for a 12.3kA peak ac, the extinction peak-voltage for SF6 (Unit A, 3
bar) is higher than with the prototype interrupter operated in Air at atmospheric pressure by about 250 - 400V). Also for the prototype interrupter (atmospheric pressure air, 106 mm contact gap) there is only a small variation of extinction voltage with peak alternating current in the range 8.8 - 15kA.
B. Local Dielectric Strength
The time variation of the relative breakdown voltage at the axial location investigated (Fig. 5) may be used to yield values for the time required for the local dielectric strength to recover following arcing. Fig. 7 shows an example of the time required for the local dielectric strength (mean of three tests) to fully recover as a function of contact gap at current zero for the
prototype interrupter (E) (atmospheric pressure air) with a 5kA peak alternating current.
The result indicates that there is an optimum contact gap, which produces the most rapid overall recovery at the particular axial location shown on Fig. 2.
VII. QUANTIFICATION OF TRENDS
The voltage extinction peak results (Fig. 4 and 6) and the local breakdown voltage results (Fig. 5 and 7) provide a coarse indication respectively of the probable thermal and local dielectric recoveries of an interrupter.
These two parameters, derived from only voltage measurements, can be considered for giving an indication of interrupter response to different duties as a function of various designated parameters (e.g. contact gap, gas pressure etc.).
A. Voltage Extinction Peak
Results of the form shown on Fig. 4, 6 and Table II enable an empirical relationship to be obtained between the voltage extinction peak (
V
EXT) and the peak magnetic field [B (T)], p peak current [i
p(A)], contact gap [l (m)], and pressure [P/(PREF)] can be derived. This empirical relationship is asfollows:
[ ]
kV , d P P i )l αB K(1 V L l e REF n p g m p EXT − +≅ (1)
The coefficients α, m, g and n are constants determined from Fig. 6 having the values 1.8, 1.0, 1.64 and 0.23 respectively, for the present operating conditions. The constant Khas values of 90, 96, and 172 respectively for Air, N2 and
SF6 determined from Fig. 6. The constant e was determined
with the reference test head (Unit A) for different gases and pressures being, 0.27 (SF6) and 0.39 (N2 and Air). d represents
0 0.1 0.2 0.3 0.4 0.5 0.6 0.7 0.8 0.9 1
0 5 10 15 20 25
122 106 95 70 68 Gap, [mm]
Peak fault current, [kA]
Coil B-peak field, [mT]
0 129.8 259.6 389.4 519.2
Curve1 Curve2 Curve3 Curve4 V o lt a g e e x ti n ct io n p ea k m ag n it u d e , [k V ] Fig. 6. Voltage extinction peak magnitude: peak fault current. Experimental
points: “■” Unit A (reference interrupter), N2, 3bar; “▲” Unit A (reference
interrupter), SF6, 3bar; “□” Unit D (current interrupter), Air, atmospheric
pressure; “○” Unit E, (prototype interrupter), Air, atmospheric pressure. (Also
shown gap length and B-field corresponding to current). Theoretical curves (equation 1, atmospheric pressure): Curve 1: coil current 11.8kA and B-field 306.35mT, gap 122mm; Curve 2: coil current 13.2kA and B-field 342.7mT, gap 106mm; Curve 3: coil current 14kA and B-field 363.47mT, gap 95mm; Curve 4: coil current 16.2kA and B-field 420.59mT, gap 70mm.
0 15 30 45 60 75 90 105 120
0 5 10 15 20 2 5 30 3 5 40 4 5 50
68 95 118 Electrodes gap at the time of the arc extinction [mm]
[image:5.595.54.288.342.556.2]T im e fo r d ie le ct ri c st re n g th r ec o v er y f ro m t h e ti m e o f th e ar c ex ti n ct io n , [ m s]
the effect of the arc chamber volume being 1.0 with and 0.9 without the outer PTFE cylinder. L, a contact gap constant of 0.106 [m] represents the threshold gap beyond which the effect of the outer cylinder should be observed on the current interruption (Fig. 6).
Examples of extinction voltage: peak current characteristic curves for various interrupters and operating conditions using equation (1) are shown on Fig. 6 (curves 1, 2, 3, 4).
B. Local Dielectric Strength
The local breakdown voltage: time results for the air prototype unit (E, atmospheric pressure, 5kA peak current) are compared on Fig. 5 with similar local dielectric probe results for SF6 reported in [2] (3bar, conventional rotary arc interrupter) and in [1] (atmospheric pressure, reference interrupter, no inner PTFE cylinder). The results show that the overall time for full recovery of the relative breakdown voltage is similar for the Air and SF6 based interrupters. However, during the arcing period, the breakdown voltage relative to the ambient value is lower at the probe location for the air prototype than at similar locations with the two SF6 units. During the intermediate period between arc extinction and the approach to full recovery (20-22ms, Fig. 5) the relative voltage recovery rate of the air prototype (E) is ~ 0.55 compared with ~0.1 for the SF6 rotary unit [2]. Thus overall the actual relative voltage recovery values at a given time during this period are lower for the air prototype interrupter compared with the 3 bar SF6 unit but closer to the atmospheric SF6 unit results.
It should be noted that the critical rate of rise of recovery voltage (RRRV) across the entire contact gap during a period of 7.8µs immediately after current zero for interrupter D with atmospheric air (Table I) reported previously [4], [8] was 26V/µs for a peak current of 12.5-13kA (dI/dt=1.75A/µs, e.g. during the final 50µs before current zero) and an electrode gap of 95mm. This result corresponds to the optimum value shown on Fig. 7.
Taken collectively, these results provide a preliminary indication of the dielectric recovery capabilities of such convoluted arc units.
The empirical relationship for the dielectric recovery derived in [1] is also applicable to the prototype interrupter of this investigation.
C. Chromatic analysis
The above discussion is based upon separate empirical relationships for the extinction and breakdown voltages. However, it is possible to embody the various interrupter and operational parameters together in a single description based upon an approach known as chromatic analysis [5],[9]. Applying this methodology to the present case involves first ordering and classifying the parameters from Table II, suitably normalized into three groups (I, II, III) as follows:
• I Gas pressure (p/pn=pc; pn=1bar).
• I Contact gap (1- l/gn=gc; gn=1m).
• II,
I B-field (1 – B/Bn=Bc; Bn=1T).
• II
Fault current (Ipk/Ipkn=Ipkc; Ipkn=20kA).
• II, III
Arc voltage (1-Vpk/Vpkn=Vpkc; Vpkn=1kV).
• III Extinction peak (1- Vext/Vextn=Vec; Vextn=1kV).
• III Recovery Voltage (1- Vrc/Vrcn=Vrcc; Vrcn=1kV).
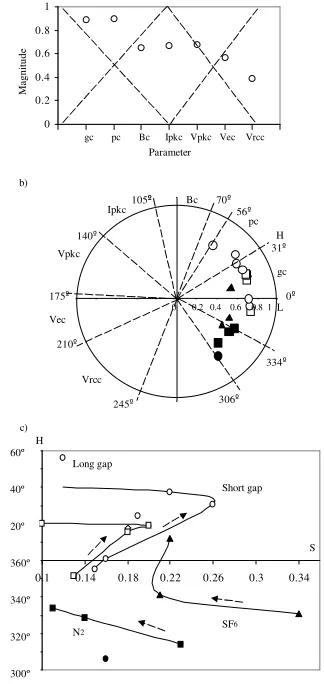
Group I includes a priori determined control parameters, group II the proposed interruption conditions and group III the interrupter responses. The B-field belongs to both groups I and II, whilst the belongs to both groups II and III. The normalisation is arranged so that an increase in a parameter value represents a reduction in interrupter performance. Three overlapping processors (R, G, B), corresponding to each group (I, II, III) are superimposed upon the ordered set of parameters [5] (Fig. 8 a). The outputs from each of the processors (R, G, B) are fed into chromatic algorithms (Appendix I) to yield three chromatic parameters, which represent respectively, the dominating parameter (H), the severity of conditions (L) and
b)
-1 0 1
- 1 -0.8 -0. 6 -0 .4 -0.2 0 0.2 0.4 0.60 0.2 0.4 0 .6 0.8 1
0.8 1 L gc pc Bc Ipkc
Vpkc
Vec
Vrcc
0º
31º
H
56º 70º
105º
140º
175º
210º
245º 306º
334º
a)
0 0.2 0.4 0.6 0.8 1
0 1 2 3 4 5 6 7 8
gc pc Bc Ipkc Vpkc Vec Vrcc
M
a
gn
it
u
d
e
Parameter
- 6 0 - 5 0 - 4 0 - 3 0 - 2 0 - 10 0 10 2 0 3 0 4 0 5 0 6 0
0.1 0.14 0.18 0.22 0.26 0.3 0.34
H 60º
40º
20º
360º
340º
320º
300º
S
N2 SF
6
Long gap
Short gap
[image:6.595.343.505.341.683.2]c)
Fig. 8. Chromatic processing of data for current interrupters.
a) Data set ordering with non-orthogonal processors superimposed (Example data for interrupter E, Ipeak=13.3kA, Bpeak=345.3mT, Gap=0.106m; Table II); b) Polar H: L diagram; c) Cartesian H: S diagram
(Expanded region). Interrupters: “▲” A-SF6; “■” A-N2; “◊” B-Air; “●”
the spread of the influence amongst the various parameters (S). Each interrupter and operating condition listed on Table II may be processed in this manner to yield a signature defined by the values of H, L, S. The interrupter signature may then be represented by points on each of two diagrams H: L, H: S. An example of a H: L polar diagram is shown on Fig. 8 b (H=azimuthal angle, L=radius) with the various operational parameters occupying different H locations. The diagram enables the interrupters / operational conditions dominated by gap length, gas pressure to be identified as those in the range 0<H<56. It also shows that the prototype (E) and current (D) interrupters (0.64<L<0.8) are more severely stressed than interrupter (A) (0.5<L<0.64) and that (A) is more severely stressed when operated with Nitrogen (0.58<L<0.64) than SF6 (0.5<L<0.55).
Expanding a chromatic sector of a H-S diagram using Cartesian coordinates (Fig. 8c) shows that for all the interrupters and conditions investigated no single parameter is outstandingly dominant since in all cases S<0.34 (S=0-equal influence; S=1-single totally dominant feature). The variation with peak current is indicated by arrows.
For the prototype interrupter (E), Fig. 8b and c show that increasing the contact length equilibrates further the effects of the various parameters (S reduced from 0.22 to 0.12) by promoting the influence of B, p (H60) whilst reducing the stress level (L reduced from 0.725 to 0.64).
VIII. CONCLUSIONS
It has been shown that the interruption of an alternating current can be achieved with a convoluted arc formed outside a B-field producing coil along with PTFE ablation. Preliminary assessment of a prototype interrupter (E), design optimized following tests with four subsidiary units (A, B, C, D), has been based upon values of the arc voltage extinction peak prior to current zero and the recovery of dielectric strength at a single axial location close to the arc quenching zone.
The results for the arc voltage extinction peaks are similar for the prototype interrupter (E) with atmospheric pressure air, to those with a reference interrupter (A) with 3bar Nitrogen pressure. This suggests that similar pre current zero power losses and hence arc quenching is achievable with the prototype interrupter with only one third of the gas pressure without a B-field.
The local dielectric recovery results showed that the full relative voltage recovery for the prototype interrupter (E) occurred on time scales similar to those of rotary arc interrupters [1], [2]. The axial location of the prototype interrupter had a lower dielectric strength during arcing than observed at the locations addressed in the rotary arc interrupters.
Performance signatures of the various interrupters and their dependence upon operational conditions (e.g. gas pressure etc.) have been produced using a chromatic analysis technique [5].
Further investigations of the convoluted arc interrupter would be warranted particularly to explore in more detail the initial rate of recovery voltage capability and that of the entire contact gap rather than only at the location of the probe investigated here.
APPENDIX I
The chromatic parameters H, L, S are given in [5]: B)/3
G (R
L= + + (I.1) MIN]
MIN]/[MAX
-[MAX
S= + (I.2)
MAX B
MIN], G)]/[MAX
-R ( 60[4
MAX G
MIN], R)]/[MAX
-B ( 60[2 H
MAX R
MIN], B)/[MAX
-60(G
= +
+
= +
+ =
= +
(I.3)
Where: MAX = the highest (R, G or B) output value, MIN = the lowest (R, G or B) output value.
REFERENCES
[1] T. Mori, J. W. Spencer, J. E. Humphries, G. R. Jones, “Diagnostic
measurements on rotary arcs in hollow polymeric cylinders”, IEEE Trans. Power Deliv., Vol.20, No. 2, pp.765-771, Apr. 2005.
[2] M. G. Ennis, “Investigation of fundamental processes affecting the
behaviour of electric arcs in electromagnetic interrupters” PhD thesis, Univ. of Liverpool, 1996.
[3] H. M. Ryan and G. R. Jones, “SF6 switchgear”, IEE Power Engineering
Series 10, UK, Peter Peregrinus Ltd., 1989, pp.14-22, 167-177.
[4] L. M. Shpanin, “Electromagnetic arc control for current interruption”,
PhD thesis, Univ. of Liverpool, 2006.
[5] G. R. Jones, A. G. Deakin, J. W. Spencer, “Chromatic Monitoring of
Complex Conditions”, Taylor and Francis ISBN 9781584889885, April 2008.
[6] B. E. Djakov, L.M. Shpanin, J.W. Spencer, G.R. Jones, “Propulsion of a
plasma ring in a rotary arc device at atmospheric pressure”, Journal of Theoretical and Applied Mechanics, Sofia, Vol.37, No.1, pp.39-54, March 2007.
[7] L. M. Shpanin, G.R. Jones, J.W. Spencer, B.E., Djakov, “Control and
propulsion of an atmospheric pressure plasma ring”, IEEE Trans. Plasma Sci., vol. 36, no. 5, Oct. 2008, pp.2795-2800.
[8] L. M. Shpanin, G. R. Jones, J. W. Spencer, J. E. Humphries,
“Electromagnetic arc convolution and enhanced PTFE ablation for current interruption”, Proc. 17th Int. Conf. on Gas Discharges and their Applications, Cardiff, U.K., 2008, pp.133-136.
[9] G. R. Jones and J. W. Spencer, “Chromatic characterization of current
interrupters”, Proc. Euro TechCon Conf. (Chester, UK), 2007.
Leonid M. Shpanin received the M.Sc. degree in radio engineering from Azerbaijanian Technical University, Azerbaijan and Ph.D. degree in electrical engineering from University of Liverpool, U.K. He holds position as a Research Fellow in the Power System and Control Group, Department of Electronic, Electrical and Computer Engineering, University of Birmingham, U.K. He is a member of the Institute of Electrical and Electronics Engineering (IEEE), USA and a member of the IEEE Nuclear and Plasma Sciences Society, USA.
and the D.Sc. degree from University of Wales, U.K. He is an Emeritus Professor and past Director of the Centre for Intelligent and Monitoring Systems at University of Liverpool. He is author of several books in the area
of Chromatic monitoring, high-pressure arcs and SF6 switchgear. He is a
member of the Executive Management Committee of the International Series of Conferences on Gas Discharge and Their applications and is a member of an international study group on switchgear arcs, the Current Zero Club. He was awarded the Institution of Electrical Engineering (IEE) Science, Education and Technology Achievements Medal in 1999 and a Medal of Distinction in 2006 by the Academy of Sciences, Bulgaria. He is a Fellow of the IET, U.K. and member of the Institute of Physics, U.K.
Jim E. Humphries received the M.Phil. degree in electrical engineering from University of Liverpool, U.K. He is a Senior Experimental Officer in the Department of Electrical Engineering and Electronics, University of Liverpool. He is responsible for experimental project works at the Centre of Intelligent and Monitoring Systems.