This is a repository copy of
Evaluating power-law properties from data using a wavelet
transform correlation method with applications to foreign exchange rates
.
White Rose Research Online URL for this paper:
http://eprints.whiterose.ac.uk/74636/
Monograph:
Wei, H.L. and Billings, S.A. (2008) Evaluating power-law properties from data using a
wavelet transform correlation method with applications to foreign exchange rates.
Research Report. ACSE Research Report no. 979 . Automatic Control and Systems
Engineering, University of Sheffield
Reuse
Unless indicated otherwise, fulltext items are protected by copyright with all rights reserved. The copyright exception in section 29 of the Copyright, Designs and Patents Act 1988 allows the making of a single copy solely for the purpose of non-commercial research or private study within the limits of fair dealing. The publisher or other rights-holder may allow further reproduction and re-use of this version - refer to the White Rose Research Online record for this item. Where records identify the publisher as the copyright holder, users can verify any specific terms of use on the publisher’s website.
Takedown
If you consider content in White Rose Research Online to be in breach of UK law, please notify us by
Evaluating Power-Law Properties from Data Using a Wavelet
Transform Correlation Method with Applications to
Foreign Exchange Rates
H. L. Wei and S. A. Billings
Research Report No. 979
Department of Automatic Control and Systems Engineering The University of Sheffield
Mappin Street, Sheffield, S1 3JD, UK
Evaluating Power-Law Properties from Data Using a Wavelet
Transform Correlation Method with Applications to
Foreign Exchange Rates
H. L. Wei and S. A. Billings
Department of Automatic Control and Systems Engineering, the University of Sheffield,
Mappin Street, Sheffield, S1 3JD, UK.
[email protected], [email protected]
Abstract: Numerous studies in the literature have shown that the dynamics of many time series
including observations in foreign exchange markets exhibit scaling behaviours. A novel statistical
method, derived from the concept of the continuous wavelet transform correlation function (WTCF),
is proposed for the evaluation of power-law properties from observed data. The new method reveals
that foreign exchange rates obey power-laws and thus belong to the class of self-similarity processes.
Keywords: Continuous wavelet transform, correlation function, foreign exchange rates, scaling law,
2
1. Introduction
The wavelet transform (Daubechies 1992) provides a powerful tool for analyzing and synthesizing
signals. The wavelet transform has the property of localisation both in time and frequency. In wavelet
analysis, the scale that can be used to look at data at different resolution levels plays a special role,
because wavelet algorithms process data at different scales or resolutions. At a coarse resolution level,
one would notice gross features. Similarly, at a fine resolution level, one would get detailed features.
This enables us to see both the ‘forest’ and the ‘trees’, so to speak, and makes wavelets very useful
(Amara 1995) for data modelling and analysis in diverse fields including dynamical system modelling
(Billings and Wei 2005a, 2005b, Wei and Billings 2004a, 2004b, 2006, 2007), as well as random
signal processing and analysis for example statistical self-similarity detection and fractal property
characterization (Argoul 1990, Flandrin 1992, Wornell 1995, Arneodo et al. 1996, Abry and Veitch
1998, Soltania et al. 2004).
Numerous studies in the literature have shown that the dynamics of many time series in foreign
exchange markets exhibit scaling behaviours (Muller et al. 1990, Mantegna and Stanley 1995,
Dacorogna et al. 1996, Guillaume1 et al. 1997, Vandewallea and Ausloos, 1998, Gopikrishnan et al.
1999, Mulligan 2000, Gencay et al. 2001, Muniandya et al. 2001, Xu and Gencay 2003, Jiang et al.
2007). For example, Muller et al. (1990) and Guillaume1et al. (1997) have shown that the mean
absolute price changes over certain time intervals for foreign exchange rates obey scaling laws.
Recently, Xu and Gencay (2003) have shown that US dollar to Deutschemark (USD-DEM) returns
present scaling and multifractal properties.
The objective of this paper is to introduce a new wavelet transform based method to detect and
evaluate the fractal self-similarity properties from observed time series. The new method involves the
calculation of a continuous wavelet transform correlation function (WTCF), which plays key a role in
linking the time-domain data with the associated scaling law properties that are explicitly presented by
the wavelet scale (revolution) parameter.
2. The Wavelet Transform Correlation Method
(A) The wavelet transform
Let f(t) be a square integrable function defined inL2(R). For a given mother waveletψ , the
continuous wavelet transform (CWT) of the function f(t) is defined as (Daubechies 1992)
dt t t f a
b
Wf
∫
ba∞ + ∞ −
= () , ()
) ,
( ψ
ψ dt
a b t t f a
∫
∞ + ∞
−
−
= 1 ()ψ (1)
where b,a(t)=a 1/2 ((t−b)/a) − ψ
ψ , a∈R+ and b∈Rare the dilation (scale) and translation (shift)
order to guarantee (1) is invertible so that f can be reconstructed from Wfψ, the following admissible
condition is required
∞ <
=
∫
∞ ωω ω ψ ψ d C 0 2 ) ( ˆ (2)
where ψˆ is the Fourier transform of the function ψ .
For a stochastic process f(t), the wavelet transform Wfψ(b,a) can be viewed as a random field on
the upper (positive) half plane. For a given scale parameter a, the transform Wfψ(b,a) contains a piece
of information of the original process at this given scale. Extensive research has been done to exploit
the wavelet transform, to analyze and determine the characteristics of random processes (Mallat and
Hwang 1992, Flandrin 1992, Masry 1993, Wornell 1995, Abry and Veitch 1998).
(B) The wavelet transform correlation function
Let x(t)be a wide-sense (weak-sense) stationary random process that is square integrable in
) (
2
R
L . For a chosen wavelet ψ , the wavelet transform correlation function (WTCF) of the
signalx(t), with respect to the locations b1andb2 at scales a1and a2, is defined as below
] ) , ( ) , ( [ ) , ; ,
( 1 2 1 2 1 1 2 2
,x b b a a EWx b a Wx b a
x ψ ψ
ψ = Φ 2 1 2 2 2 1 1 1 2 1 2 1 ] ) ( ) ( [
1 τ τ ψ τ ψ τ τ τ
d d a b a b x x E a
a
∫ ∫
∞ ∞ − ∞ ∞ − − −
= (3)
Note that Rx,x(τ1,τ2)=E[x(τ1)x(τ2)] is the correlation function of x(t). Using the property that
) , ( 1 2
,x τ τ x
R =Rx,x(τ −2 τ1,0) =Rx(τ −2 τ1) =E[x(t)x(t+τ −2 τ1)], it can be derived from equation (3)
that
) , ; ,
( 1 2 1 2 ,x b b a a x
ψ
Φ
∫ ∫
Rx,x(τ1,τ2)ψb1,a1(τ1)ψb2,a2(τ2)dτ1dτ2 ∞ ∞ − ∞ ∞ − =∫ ∫
∞ ∞ − ∞ ∞ − −= Rx(τ2 τ1)ψb1,a1(τ1)dτ1 ψb2,a2(τ2)dτ2
[
]
∫
−∞∞ ∗= (Rx ψb1,a1(τ2) ψb2,a2(τ2)dτ2 (4)
where the symbol “
∗
” indicates the convolution of two functions.Assume that the power spectrumPx(ω)of the signal x(t)exits.From the Parseval’s theorem, which
states that the inner product of two functions is equal to the inner product of the Fourier transforms of
4
conditions the Fourier transform of a convolution is the pointwise product of the Fourier transforms of
the two individual functions, it can then be further derived that
) , ; ,
( 1 2 1 2 ,x b b a a x
ψ
Φ ωψ ωψ ω ω
π
∫
Px b a b a d∞
∞ −
= ( )ˆ , ( )ˆ , ( )
2 1 2 2 1 1 ω ω ψ ω ψ ω
π P a a e ωd
a
a ib b
x
∫
−∞∞ − − = ( ) 2 1 21 ( )ˆ( )ˆ( ) 1 2
2 (5)
This shows that for the wide-sense stationary process x(t) , the wavelet transform correlation
functionΦψx,x(b1,b2;a1,a2), with respect to the locations b1 and b2 at given scales a1anda2, is a
function of b1 and b2only through the difference (b2−b1). Here, for the first time, we have derived,
by means of the Parseval’s theorem and the convolution theorem, the relation between the
time-domain signal and the frequency-time-domain behaviour presented by the spectra of the signal and the
wavelet.
(C) The power-law case
As a special case of the wavelet transform correlation function, the wavelet transform
autocorrelation function (WTAF) of the signalx(t), at scale a, can be calculated from (5) by letting
a a
a1= 2= and b2 =b1=b, that is,
] | ) , ( [| )
(a E Wx b a 2 x
ψ
ψ =
Φ ω ψ ω ω
π P a d
a x
∫
−∞∞ = 2 | ) ( ˆ | ) (2 (6)
Now assume that the dynamics of the process x(t) exhibits a power-law behaviour, that is, the power
spectral density of the process has a power-law dependence in frequency as given below
β
ω ω)∝| |− (
x
P (7)
It can then be obtained from (6) that
) (a x ψ Φ ω ω ω ψ
π
∫
β∞
∞ −
= a a d
2
) ( ˆ
2 ω ω
ω ψ π β β d a
∫
∞ ∞ − = 2 ) ( ˆ 2 β Ca= (8)
where =
∫
<∞∞ ∞ − − ω ω ψ ω π β d
C ˆ( )2
2 1
. Equation (8) suggests that for a power-law signal x(t) that obeys
the power-law given by (7), the wavelet transform autocorrelation function Φψx(a)also obeys a
power-law with respect to the wavelet scale parameter a, and the value of the scaling exponent is exactly the
same as in the original power-law presentation but with an opposite symbol, that is−β in (7) becomes
β
+ in (8). Therefore, the new introduced formulas (8) can be used to estimate the power-law
exponent H, and the fractal dimension D is given byβ =2H +1=5−2D(Voss 1988). For a self-affine
process, 0≤H≤1, 1≤D≤2 and 1< β<3 (Malamud and Turcotte 1999a). For a Brownian
motion,H =0.5, D=1.5 and β=2 (Malamud and Turcotte 1999b).
3. Results for foreign exchange rates
Monthly average dollar exchange rates, taken from the Federal Reserve Bank of St. Louis for a
selection of twenty countries, were considered in this study, and these are shown in Table 1. Monthly
average exchange rates are of more interest than daily exchange rates for at least four groups of
investors (Mulligan 2000): program traders, investors who follow deterministic rules, investors who
[image:7.612.98.519.332.697.2]routinely accept exposure approximately one month or longer, and currency hedgers.
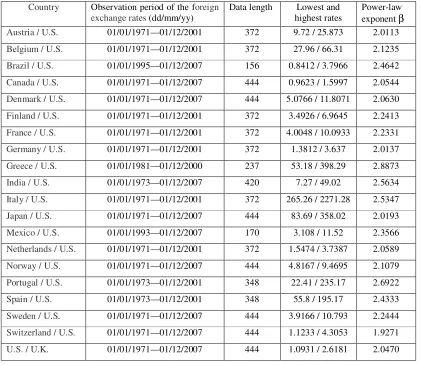
Table 1 The power-law exponents estimated using the wavelet transform correlation function for the monthly average dollar exchange rates of twenty countries. The data came from the Federal Reserve Bank of St. Louis.
Country Observation period of the foreign exchange rates (dd/mm/yy)
Data length Lowest and highest rates
Power-law exponentβ
Austria / U.S. 01/01/1971—01/12/2001 372 9.72 / 25.873 2.0113
Belgium / U.S. 01/01/1971—01/12/2001 372 27.96 / 66.31 2.1235
Brazil / U.S. 01/01/1995—01/12/2007 156 0.8412 / 3.7966 2.4642
Canada / U.S. 01/01/1971—01/12/2007 444 0.9623 / 1.5997 2.0544
Denmark / U.S. 01/01/1971—01/12/2007 444 5.0766 / 11.8071 2.0630
Finland / U.S. 01/01/1971—01/12/2001 372 3.4926 / 6.9645 2.2413
France / U.S. 01/01/1971—01/12/2001 372 4.0048 / 10.0933 2.2331
Germany / U.S. 01/01/1971—01/12/2001 372 1.3812 / 3.637 2.0137
Greece / U.S. 01/01/1981—01/12/2000 237 53.18 / 398.29 2.8873
India / U.S. 01/01/1973—01/12/2007 420 7.27 / 49.02 2.5634
Italy / U.S. 01/01/1971—01/12/2001 372 265.26 / 2271.28 2.5347
Japan / U.S. 01/01/1971—01/12/2007 444 83.69 / 358.02 2.0193
Mexico / U.S. 01/01/1993—01/12/2007 170 3.108 / 11.52 2.3566
Netherlands / U.S. 01/01/1971—01/12/2001 372 1.5474 / 3.7387 2.0589
Norway / U.S. 01/01/1971—01/12/2007 444 4.8167 / 9.4695 2.1079
Portugal / U.S. 01/01/1973—01/12/2001 348 22.41 / 235.17 2.6922
Spain / U.S. 01/01/1973—01/12/2001 348 55.8 / 195.17 2.4333
Sweden / U.S. 01/01/1971—01/12/2007 444 3.9166 / 10.793 2.2444
Switzerland / U.S. 01/01/1971—01/12/2007 444 1.1233 / 4.3053 1.9271
6
The proposed wavelet transform auto correlation function was used to analyze the twenty datasets.
The calculation procedure is as below:
• For each dataset, apply the continuous wavelet transform to calculate the wavelet coefficient
) , (ba
Wxψ , where the Daubechies’ wavelet of order 20 (‘db20’) was used; the scale parameter a
was allowed to vary from 1 to 16, and the shift parameter b was allowed to vary from 1 to N (N is
the data length).
• For each single value of the scale (or resolution level) parameter a, calculate the expectation
] | ) , ( [| )
(a E Wx b a 2
x
ψ ψ =
Φ =var[Wxψ(b,a)] +<Wxψ(b,a)>2, where ‘var’ indicates calculating the
variance and ‘< >’ indicates taking the average of the relevant signal; x(a) ψ
Φ is a function of the
scale parameter a.
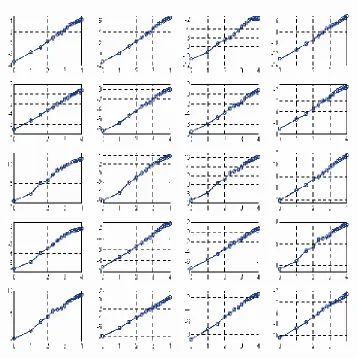
• Plot the graph of log2[ x(a)] ψ
Φ (vertical axis) versus log2(a)(horizontal axis).
• Calculate the slope of the plot formed by log2[Φψx(a)] and log2(a); the value of the slope can be
viewed as an estimate of the power-law exponentβ .
The graphs for the twenty datasets are shown in Figure 1, where graphs are displayed, from left to
right and from top to bottom, in the order that is exactly the same as in Table 1. Values of the
estimated power-law exponentβ are given in Table 1. The above calculation procedure was also
performed over some daily average dollar exchange rates for some countries and it has been observed
that results are very similar to those that were obtained for the associated monthly average cases.
Note that in the above calculation the original datasets were directly used to test and evaluate the
power-law properties of the foreign exchange rates; no data pre-processing procedure has been
performed. Data normalization for example mean-removal might very slightly affect the estimation
results.
4. Conclusions
The proposed wavelet transform correlation analysis method can be used to detect and evaluate the
fractal scaling-law behaviours from observed time series. Compared with existing approaches, the new
method has several advantages, for example, it is not necessary for this method to use a large number
of observations to obtain accurate estimates of the power-law exponent; unlike traditional power
spectral density estimation methods which require data smoothing (windowing) and which are
sensitive to the window ‘shapes’, the new method does not need any windowing techniques. Moreover,
this new non-parametric method can be performed speedily and efficiently using existing tools for
continuous wavelet transform calculation in Matlab. The presented results have shown that the foreign
exchange rates, for the twenty countries considered, exhibit power-laws and thus belong to the class of
Figure 1 Graphs of the wavelet transform correlation function defined by (8) for the twenty datasets of foreign exchange rates listed in Table 1. From left to right and from top to bottom, these are displayed in order that is exactly the same as in Table 1. In these graphs, the vertical axis is log2[ x(a)]
ψ
Φ and the horizontal axis is log2(a).
Acknowledgements
The authors gratefully acknowledge that this work was supported by the Engineering and Physical
Sciences Research Council (EPSRC), U.K.
References
P. Abry and D. Veitch, ‘Wavelet analysis of long-range-dependent traffic’, IEEE Transactions on
Information Theory, 44(1), pp.2-15, 1998.
G. Amara, ‘Introduction to wavelets’, IEEE Computational Science and Engineering, 2 (2), pp. 50-61,
1995.
8
diffusion-limited aggregated and electrodeposition clusters’, Physical Review A, 41(10),
pp.5537-5560, 1990.
A. Arneodo, Y. dAubentonCarafa, E. Bacry, P. V. Graves, J. F. Muzy, and C. Thermes, ‘Wavelet
based fractal analysis of DNA sequences’, Physica D, 96, pp.291-320, 1996.
S. A. Billings and H. L. Wei, ‘A new class of wavelet networks for nonlinear system identification’,
IEEE Transactions on Neural Networks, 16, pp. 862–874, 2005a.
S. A. Billings and H. L. Wei, ‘The wavelet-NARMAX representation: a hybrid model structure
combining polynomial models and multiresolution wavelet decompositions’, International
Journal of Systems Science, 36(3), pp. 137–152, 2005b.
M. M. Dacorogna, C. L. Gauvreau, U. A. Muller, R. B. Olsen and O. V. Pictet, ‘Changing time scale
for short-term forecasting in financial markets’, Journal of Forecasting, 15, pp.203-227, 1996.
I. Daubechies, Ten Lectures on Wavelets. Philaelphia, PA: SIAM, 1992.
P. Flandrin, ‘Wavelet analysis and synthesis of fractional Brownian motions’, IEEE Transactions on
Information Theory, 38(2), pp.910-917, 1992.
R. Gencay, F. Selcuk, and B. Whitcher, ‘Scaling properties of foreign exchange volatility’, Physica A,
289, pp.249-266, 2001.
P. Gopikrishnan, V. Plerou, L. A. N. Amaral, M. Meyer, and H. E. Stanley, ‘Scaling of the distribution
of fluctuations of financial market indices’, Physical Review E, 60, pp.5305-5316, 1999.
D. M. Guillaume1, M. M. Dacorogna, R. R. Dave, U. A. Muller, R. B. Olsen, and O. V. Pictet, ‘From
the bird’s eye to the microscope: A survey of new stylized facts of the intra-daily foreign
exchange markets?’, Finance and Stochastics, 1, pp.95-129, 1997.
J. Jiang, K. Ma, and X. Cai, ‘Scaling and correlations in foreign exchange market’, Physica A, 375,
pp.274-280, 2007.
S. Mallat and W. L. Hwang, ‘Singularity detection and processing with wavelets’, IEEE Transactions
on Information Theory, 38(2), pp.617-643, 1992.
B. D. Malamud and D. L. Turcotte, ‘Self-affine time series I: generation and analyses’, Advances in
Geophysics,40, 1-90, 1999a.
B. D. Malamud and D. L. Turcotte, ‘Self-affine time series: measures of weak and strong
Persistence’, Journal of Statistical Planning and Inference, 80(1-2), 173-196, 1999b.
R. N. Mantegna and H. E. Stanley, ‘Scaling behaviour in the dynamics of an economic index’, Nature,
376, pp.46-49, 1995.
E. Masry, ‘The wavelet transform of stochastic processes with stationary increments and its
applications to fractional Brownian motion’, IEEE Transactions on Information Theory, 39(1),
pp.260-264, 1993.
U. A. Muller, M. M. Dacorogna, R. B. Olsen, O. V. Pictet, M. Schwarz and C. Morgenegg, ‘Statistical
study of foreign exchange rates, empirical evidence of a price change scaling law, and intraday
R. F. Mulligan, ‘A fractal analysis of foreign exchange markets’, International Advances in Economic
Research, 6(1), pp.33-49, 2000.
S. V. Muniandya, S. C. Lima, and R. Muruganb, ‘Inhomogeneous scaling behaviors in Malaysian
foreign currency exchange rates’, Physica A, 301, pp.407-428, 2001.
S. Soltania, P. Simarda, and D. Boichub, ‘Estimation of the self-similarity parameter using the wavelet
transform’, Signal Processing, 84, pp.117-123, 2004.
N. Vandewallea and M. Ausloos, ‘Multi-affine analysis of typical currency exchange rates’, The
European Physical Journal B, 4, pp.257-261, 1998.
R. F. Voss, Fractals in nature : from characterization to simulation. In The Sceince of Fractals
Images edited by H.O. Peitgen and D. Saupe, Springer, New York, 1988.
H. L. Wei and S. A. Billings, ‘A unified wavelet-based modelling framework for nonlinear system
identification: the WANARX model structure’, International Journal of Control, 77(4), pp. 351–
366, 2004a.
H. L. Wei and S. A. Billings, ‘Identification and reconstruction of chaotic systems using ultiresolution
wavelet decompositions’, International Journal of Systems Science, 35(9), 511–526, 2004b.
H. L. Wei, S. A. Billings, and M. Balikhin, ‘Analysis of the geomagnetic activity of the D-st index and
self-affine fractals using wavelet transforms’, Nonlinear Processes in Geophysics, 11, pp. 303–
312, 2004.
H. L. Wei and S. A. Billings, ‘Long term prediction of nonlinear time series using multiresolution
wavelet models’, International Journal of Control, Vol.79, No.6, 569–580, 2006.
H. L. Wei and S. A. Billings, ‘A comparative study of global wavelet and polynomial models for
non-linear regime-switching systems’, International Journal of Modelling, Identification and Control,
2(4), pp. 273–282, 2007.
G. W. Wornell, Signal Processing with Fractals: A Wavelet-based Approach, New Jersey:
Prentice-Hall Inter, 1996.
Z. X. Xu and R. Gencay, ‘Scaling, self-similarity and multifractality in FX markets’, Physica A, 323,