Contents lists available atScienceDirect
Computer-Aided Design
journal homepage:www.elsevier.com/locate/cad
A collaborative platform for integrating and optimising Computational Fluid
Dynamics analysis requests
R.I. Whitfield
a,∗,
A.H.B. Duffy
a,
S. Gatchell
b,
J. Marzi
b,
W. Wang
a,1aLeonardo Centre, University of Strathclyde, Department of Design, Manufacture and Engineering Management, 75 Montrose Street, Glasgow, G11XJ, UK bHSVA Hamburgische Schiffbau-Versuchsanstalt GmbH, Bramfelder Str. 164, D-22305, Hamburg, Germany
a r t i c l e i n f o
Keywords:
Integration Collaboration Co-ordination Optimisation
Computational Fluid Dynamics
a b s t r a c t
A Virtual Integration Platform (VIP) is described which provides support for the integration of Computer-Aided Design (CAD) and Computational Fluid Dynamics (CFD) analysis tools into an environment that supports the use of these tools in a distributed collaborative manner. The VIP has evolved through previous EU research conducted within the VRShips-ROPAX 2000 (VRShips) project and the current version discussed here was developed predominantly within the VIRTUE project but also within the SAFEDOR project. The VIP is described with respect to the support it provides to designers and analysts in co-ordinating and optimising CFD analysis requests. Two case studies are provided that illustrate the application of the VIP within HSVA: the use of a panel code for the evaluation of geometry variations in order to improve propeller efficiency, and the use of a dedicated maritime RANS code (FreSCo) to improve the wake distribution for the VIRTUE tanker. A discussion is included detailing the background, application and results from the use of the VIP within these two case studies as well as how the platform was of benefit during the development and a consideration of how it can benefit HSVA in the future.
©2011 Elsevier Ltd. All rights reserved.
1. Introduction
The European Union, FP6, funded Integrated Project VIRTUE, ‘‘The Virtual Towing Tank Utility in Europe’’, was an initiative involving leading EU marine CFD Centres, consultancies, research organisations, academia, and classification societies to create a virtual tank2 by improving available CFD tools and integrating
them in a comprehensive environment of ship behaviour at sea. It aimed to complement model testing in physical tanks with the provision of enhanced computational hydrodynamic services.
The project concentrated on the development of new, and the improvement of existing, CFD tools to allow an integrated and complete numerical analysis of marine hydrodynamic behaviour in a virtual environment. Dealing with fluid flow simulations in a wide range of pertinent areas of ship design such as resistance, propulsion, sea-keeping, manoeuvring and cavitation prediction, the project enhanced dedicated maritime CFD methods that become accessible through the VIP allowing for a holistic design
∗Corresponding author. Tel.: +44 141 548 4548; fax: +44 141 552 0557.
E-mail addresses:[email protected](R.I. Whitfield), [email protected](A.H.B. Duffy),[email protected](S. Gatchell), [email protected](J. Marzi),[email protected](W. Wang).
1 Current address: Durham University, School of Engineering and Computing Sciences, South Road, Durham, DH1 3LE, UK.
2 A model tank for hydrodynamic testing and analysis.
analysis. Greatly improved quality and accuracy of general purpose as well as specific CFD methods, further enhanced by a flexible and extensible integration platform formed the basis for integrated, holistic (ship) design analysis and optimisation. VIRTUE delivered important advantages to the shipbuilding industry, including reduced errors and manufacturing costs through shorter lead times and improved, more focussed designs and better product quality.
Based on a classical subdivision of ship hydrodynamic analysis, the project integrated services from four different virtual tanks: the virtual cavitation tank/tunnel, the virtual manoeuvring tank, the virtual sea-keeping tank, and the virtual towing tank. The VIP provided the prerequisites for integrating these services with CAD tools in an environment to allow the design and simulation of complete ship behaviour at sea.
A number of challenges are faced when integrating CAD tools with other Computer-Aided Engineering (CAE) tools such as CFD that relate to interoperability between the integrated tools, co-ordination of the Computer-Aided Design process, and collaborative support when the design process is distributed across a group of designers and analysts. A foundation for interoperability in ‘‘next generation product development systems’’ to integrate CAD, CAM and CAE tools was described by Szykman et al. [1]. The authors highlighted the impact on industry of poor interoperability within the CAD/CAM/CAE software as being of the order of ‘‘billions of dollars’’. The impact of managing interoperability was quantified through examples from the aerospace industry suggesting time savings of 75% for certain applications are possible through the use
of the Standard for the Exchange of Product Model Data (STEP). Savings of these orders of magnitude are only possible however if measured with respect to an initially poor level of interoperability. Bakis et al. [2] reviewed research efforts relating to the integration of design applications within product data sharing environments from three levels: conceptual, physical, and data management. The conceptual level related to interoperability achieved through the use of product data standards such as STEP; the physical level was concerned with the technology required to translate product data between representations and transfer the data between tools; and the data management level related to transaction management, access control, change notification and version control. The perspective taken by Bakis et al. is useful since it addresses interoperability from structural and technological perspectives, and also identifies some of the considerations such as access control that are required for co-ordinating the product data within the design process and also require consideration and support for collaborative design. A wide range of technologies were discussed that provide solutions for the conceptual and physical levels including: XML and Web Services for the creation of the product data sharing environments; the Initial Graphical Exchange Specification (IGES) [3] and STEP for the conceptual definition of the product data; EXPRESS [4] and XML [5] for the transfer of product data; and the Common Object Request Brokerage Architecture (CORBA) [6] and Simple Object Access Protocol (SOAP) [7] for Object-Oriented data sharing architectures. However Bakis et al. suggested that platform type support such as PerDiS [8] which consists of a number of these technologies is required for the data management level.
The level and amount of detail contained within the conceptual level represented by technologies such as STEP is a consideration that should be correctly aligned with the requirements of the interoperability problem. For example, Catley [9] stated that a modern commercial vessel may be expected to have an associated product data model of between two and ten gigabytes in size depending upon its complexity. The STEP Application Protocols (APs) were used to create the data models that Catley discussed which provided support for the full lifecycle definition of the product, from conception through to disposal. The implementation of the STEP APs within the shipbuilding industry has tended to be driven by research, and whilst it has had a beneficial impact in the way product data is managed within the industry, research has suggested that it has not achieved the same level of implementation as within the aerospace and automotive industries [10,11], and therefore suggests that similar benefits as those proposed by Szykman et al. [1] are in principal possible within the shipbuilding industry.
Despite now being dated, Bloor and Owen [12] describe product data exchange with respect to IGES and STEP and highlight how each technology has developed as well as highlighting the requirement for conformance testing in the development of product data specifications. One of the problems that Bloor and Owen highlight with respect to IGES related to vendors implementing only a subset of the IGES entities that are considered relevant. An example was used from the US Department of Defence to illustrate how conformance could be achieved using a mandated list of IGES elements. One of the weaknesses of this approach was that it allowed vendors to implement a subset of the mandated list and would result with users ‘‘having to use only the lowest common denominator of entities’’. Bloor and Owen propose that the requirements for conformance testing should therefore include: syntax; semantics; accuracy; and completeness, and that these requirements for conformance should be an integral part of a product data standard. Similar conformance challenges relating to use of a subset of the STEP standard are described by Gischner et al. [13] within the shipbuilding industry. Their
research considered two approaches for the implementation of AP216 (Ship Moulded Forms) and AP218 (Ship Structures): the selection of the elements within specific Conformance Classes of a subset of an AP; or use of the entire AP with the sub-setting of Conformance Classes within implemented translators. The strengths and weaknesses of each approach were considered before it was agreed to implement the entire AP. It is apparent that despite greater emphasis on conformance testing, similar issues exist with respect to selecting appropriate subsets of the product data standard [13] and defining the scope of the data between the integrated tools and the standard [10].
Chao and Wang [14] describe a framework for exchanging CAD/CAM data between heterogeneous tools. The emphasis for their framework was the provision of data exchange mechanisms that would support Concurrent Engineering (CE) within a net-worked environment involving multiple designers and analysts. The framework focussed more on the physical rather than con-ceptual requirements of product data exchange and stated that it should support: cross platform; data browsing; data search; multi-database connections; autoformat recognition; and transla-tion. The framework utilised a server that accepted requests from clients for file-based product data and would search for and trans-late the data into a standard STEP format. The exchange of product data through the translation of AutoCAD files into STEP files was used to demonstrate the framework. However, despite providing a basis for the development of a platform, the framework did not appear to provide any of the data management aspects described by Bakis et al. [2] and it was therefore not clear how is subse-quently provided the co-ordination and collaboration required to support CE.
Abt and Harries described an approach for the integration of CAD and CFD tools that aimed to achieve similar benefits through interoperability: faster turn-around time; increased security of correct operation; and consequently higher confidence in decision making [15]. Tool integration was achieved using a ‘‘plug-in’’ developed specifically for each tool that would translate the integrated tools’ data into objects that would be used by and exchanged within the framework. The support provided by the framework was considered as constituting a step towards Simultaneous or Concurrent Engineering. Abt and Harries describe a classification of geometric modelling techniques as consisting of: conventional—data items that are independent of each other; partially parametric—allowing some aspect of the geometry to be modified parametrically; and fully parametric—the entire geometry can be defined parametrically. This classification allowed a qualitative and subjective comparison of the techniques with respect to cost per variant, efficiency, effectiveness, flexibility and know-how required. The comparison provided a useful indication of the trade-offs between these metrics and suggested that partially parametric models, whilst being situated between conventional and fully parametric models offer benefits with respect to less know-how, relative ease of application, and competitive cost per variant. The framework provided support for various data management functions such as version control and optimisation; however it is not clear how far the support was provided towards the requirements of CE.
specific examples of the types of models that require exchange for these types of products: kinematic, hydraulic, electrical, controller, system, as well as conventional geometrical models. The collaborative design system was demonstrated with the development of an integrated wheel suspension system that allowed co-operation across three geographically distributed sites and involved the integration of a range of CAx systems for the design of mechatronic products. The nature of the collaborative support provided by the system beyond the exchange and integration of parametric product data was however not reported by Kleiner et al. and it is again not clear how the system co-ordinated the distributed design process.
Collaborative design and CE were the goals for increasing in-formation access and availability within a web-based collaborative engineering support system developed by Eynard et al. [17]. The specific application was the sharing of product data between CAD and Finite Element Analysis (FEA) tools and the viewing of the data using the Virtual Reality Modelling Language (VRML). Similar mo-tivations as those reported previously were identified: multi-site distribution of development activities across several project team members as a result of increased needs for reactivity and compet-itiveness of organisations leading to a need for improved project management. The product data exchange between the distributed project team was achieved with the use of neutral data formats within a Computer Supported Co-operative Working (CSCW) envi-ronment. A contrasting claim by Eynard et al. is that the use of a neutral format reduced the volume as well as damaging the qual-ity of the product data. The exchange, access control and sharing of product data appear to be the primary consideration for support-ing collaboration within the Teamproject software with additional consideration of milestone, task and project management.
A set of requirements for the Virtual Integration Platform may be elicited from the literature reviewed. These requirements relate to: the interoperability required to support the integration of heterogeneous CAD and CFD tools [1,2,5]; technology required to transfer product data between different locations, collaborative support, and transaction management, access and version control, and change notification [2,14–17]; and parametric support for optimisation [15,16].
These requirements are further developed within Section2. Section3describes the architecture that was developed for the VIP and how it can be used to co-ordinate CFD projects. The propeller optimisation and hullform design case studies are detailed within Section4, which provides background to each of the case studies, the application of the platform, the results from the case studies, and a summary of the benefits of the use of the VIP. Section5
discusses the findings both in terms of the development of the VIP, and the application to the case studies, and Section6concludes.
2. VIP requirements
[image:3.595.314.561.80.206.2]One of the challenges faced when developing a complex platform such as the VIP is in eliciting opinions regarding the functionality that the platform should provide, mainly due to the novelty of what was being developed and the initial lack of understanding of what was achievable. The development of the VIP was aided with the use of a prototype platform developed within the VRShips project [18] which provided an initial focal point for discussion and the use of the SCRUM methodology as described by Sutherland [19]. Whilst the VIP was driven by user requirements, the VRShips prototype platform was driven by technical requirements with respect to the approach to managing tool integration, translating and exchanging engineering product data, maintaining data consistency and propagating change, and co-ordinating the distributed design process. The development of solutions to these technical requirements played a significant
Table 1
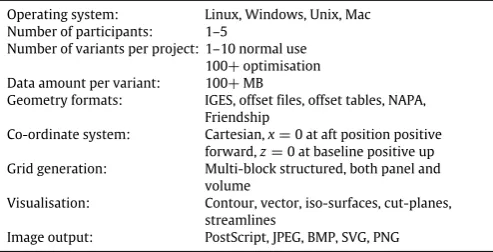
Summary of typical marine CFD analysis request.
Operating system: Linux, Windows, Unix, Mac Number of participants: 1–5
Number of variants per project: 1–10 normal use 100+optimisation Data amount per variant: 100+MB
Geometry formats: IGES, offset files, offset tables, NAPA, Friendship
Co-ordinate system: Cartesian,x=0 at aft position positive forward,z=0 at baseline positive up Grid generation: Multi-block structured, both panel and
volume
Visualisation: Contour, vector, iso-surfaces, cut-planes, streamlines
Image output: PostScript, JPEG, BMP, SVG, PNG
role in conceptualising the architecture at the early stages of development of the VIP and provided some alignment within the three levels of integration within product data management environments as discussed by Bakis et al. [2].
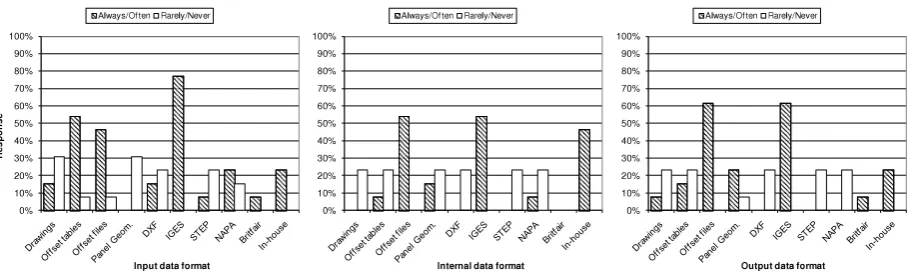
There were however a number of significant differences in the nature of the interoperability problem that are worthwhile highlighting here which necessitated the development and refinement of solutions specifically for the VIP. The conceptual solution for product data management developed within VRShips was aimed at integrating design and simulation tools via a common model to support the through-life design of vessels from initial design through to disposal. The approach differed from that of STEP in that the common model was defined on the basis of the data requirements of tools to be integrated and the data requirements for the through-life design processes [20]. However both the VRShips common model and the STEP APs provide consideration of product lifecycle support. The interoperability within the VIRTUE project specifically focussed on the exchange of geometrical data between CAD and CFD tools within one of the design phases. A data requirements investigation was undertaken early within VIRTUE by the project partners to query the preferred data formats for the integrated tools’ input, internal and output data models. The outcome of this investigation can be seen within Fig. 1which indicates that IGES and offset files were the most commonly used formats. The interoperability between the tools to be integrated was therefore significantly less challenging both in terms of the life phases that the data would be required to support as well as from a translation perspective—the conceptual level could therefore be addressed using existing product data technologies without the need to develop additional translation algorithms.
Fig. 1. Preferred input, internal and output data formats for VIRTUE tools.
was to illustrate how the VIP could resolve this conflict and inconsistency and conduct the design and hydrodynamic analysis in a coherent manner. Co-ordination of the design process for Concurrent Engineering was therefore required to get the right data to the right person at the right time. The emphasis of the VIP is not only on co-ordinating the access and use of the data, but also in co-ordinating the tasks within the design process. This dual layered co-ordination is needed in order to prevent either the access to data, or the actions of the users of the data from being chaotic [21]. The inclusion of optimisation techniques within the VIP allows these various CFD techniques to be used to: improve stability and lower motion; improve energy efficiency through the reduction of resistance; reduce cavitation, vibration and noise through improved propeller design; and improve the accuracy to which manoeuvring could be calculated.
The SCRUM methodology was used within the VIRTUE project to capture requirements that were primarily related to functional-ity and usabilfunctional-ity. Requirements were captured from partners and translated into a rolling prioritised work plan. The methodology proved to work very effectively and meant that the development process was transparent to the users, and ensured that the re-search and implementation that was being undertaken by the plat-form developers was ‘‘user driven’’. The nature of the requirements evolved during this process from being technically oriented, to be-ing user oriented. A summary of the main requirements for the VIP is shown withinTable 2. The coding for the requirements is used later within Section3to illustrate how they have been addressed by support provided by the VIP.
3. VIP architecture
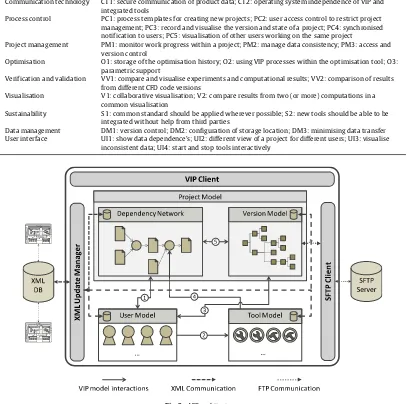
The VIP architecture consists of three types of elements: an XML database that is used to store the state of all project and user related data; a VIP Client for each designer and analyst which represents the interface to the platform; and a number of Secure File Transfer Protocol (SFTP) servers that provide access to file-based product data.Fig. 2provides an illustration of the VIP architecture. These elements may be configured for operation either on a single computer; across computers within an organisation; or across computers and across organisations. The intention when developing the VIP architecture was to attempt to use existing technologies to support the operation and reduce the complexity of the platform. These elements as well as the operation of the platform are described within the following sections.
3.1. VIP Client
The VIP Client represents the user interface to the VIP platform and provides access to the user to allow the creation, enactment, archiving and deletion of CFD projects. To provide
this functionality, the VIP Client manages project information; user information and tool information within three different but interrelated models.
The Project Model manages information related to a typical CFD analysis request and is populated either by the creation of a new analysis request; the selection of an existing project from the database; or the extraction of a previously archived analysis request. The project contains information relating to: project name, category and description; a unique project identity; creation, start and end dates; customer, budget and order number; and details of the project manager. This information would generally be unexpected to change from project creation through to completion, although support is provided within the VIP Client to modify it if required. The Project Model also contains the Dependency Network which defines the CFD process to be undertaken and the Version Model which manages the CAD and CFD data, both of which change dynamically in response to the analysis request being processed.
Previous research within the VRShips-ROPAX 2000 project used a more conventional workflow-based approach to create and enact design processes consisting of interconnected tasks [20]. Whilst VRShips and VIRTUE had a similar aim in supporting collaborative design through the integration of design and analysis tools, the response from some VRShips users suggested that the consideration of other non-functional requirements were required to improve the acceptance of the process management approach. The design process is a creative one and it was suggested by some VRShips users that the workflow-based approach stifled creativity by defining a task a priori. Despite the VRShips process management approach not explicitly dictating how a designer or analyst should undertake a task, additional feedback from the VRShips users highlighted creative flexibility as a non-functional requirement for consideration within the VIP. This creativity should still be co-ordinated to ensure effective process enactment, whilst providing appropriate freedom for the users to use their expertise and intuition to undertake the activities in an order they considered necessary to complete the CFD analysis request.
The Dependency Network within the VIP is structured using data items that are connected with a means of transforming the input data into output data using tools, mathematical relationships or parameter–file–parameter transformations. The data items are defined as either numerical parameters or file-based data. Parametric data was defined using standard data types, i.e. floating point, integer, Boolean, or character strings, as well as having either single values, one or two dimensional arrays of values. These parametric data items contain information relating to the parameter’s name, acronym, description, and units. The Dependency Network can manage any type of file-based data, defined in terms of a name, description and file type.
Table 2
Summary of VIP requirements.
Category VIP requirements
Communication technology CT1: secure communication of product data; CT2: operating system independence of VIP and integrated tools
Process control PC1: process templates for creating new projects; PC2: user access control to restrict project management; PC3: record and visualise the version and state of a project; PC4: synchronised notification to users; PC5: visualisation of other users working on the same project
Project management PM1: monitor work progress within a project; PM2: manage data consistency; PM3: access and version control
Optimisation O1: storage of the optimisation history; O2: using VIP processes within the optimisation tool; O3: parametric support
Verification and validation VV1: compare and visualise experiments and computational results; VV2: comparison of results from different CFD code versions
Visualisation V1: collaborative visualisation; V2: compare results from two (or more) computations in a common visualisation
Sustainability S1: common standard should be applied wherever possible; S2: new tools should be able to be integrated without help from third parties
Data management DM1: version control; DM2: configuration of storage location; DM3: minimising data transfer User interface UI1: show data dependence’s; UI2: different view of a project for different users; UI3: visualise
[image:5.595.100.507.98.502.2]inconsistent data; UI4: start and stop tools interactively
Fig. 2. VIP architecture.
for example take hull geometry data within an IGES file as input to create a mesh as output which would later be used to perform some relevant analysis. These tools were represented as nodes within the Dependency Network.
Where parametric data is included within the Dependency Network, the VIP provides functionality for the creation of mathematical functions that allow the manipulation of the parametric data; as well as the creation of transformations that can either insert or extract parametric data from text-based files. The use of mathematical functions and transformations in this way provides additional functionality that may be used for example to automatically manipulate hullform co-ordinate conventions, as well as providing a basis for parametric optimisation. The use of parametric data also supports the inclusion of goals within the Dependency Network which can be configured using conventional logical tests to check the numerical value of the parameter.
The Dependency Network represents a template for the CAD and CFD work to be undertaken. It does not contain information relating to the physical location on a network of file-based data or the location of tools integrated within a project. These associations between a file represented within the Dependency Network and the physical location of a file are created during
project enactment. The VIP users have the responsibility for specifying their contribution to a project on the basis of the tools that they have the expertise to operate. Each of the data items within the Dependency Network has state information associated with it through a link with the Version Model, for example: the consistency status of all of the data within the network; the physical location of file-based data; when and by whom the data was last modified; whether file or parametric data is locked by other users; and numerical values for parametric data. Once the project is created, the Dependency Network is shared amongst the designers and analysts via interaction between the VIP Client and the XML database. The VIP users therefore get a consistent view of the progress of a project through interactions with other designers and analysts.
state information that is stored within a version for parametric data relates to consistency and lock status, and numerical value; and for file-based data it relates to consistency and lock status, and a Uniform Resource Locator (URL). The URL is used to access the files distributed across the network via the SFTP servers of the VIP platform. Changes made either to the state of the data within a version, or the versions within the Version Model are automatically synchronised with the database to maintain consistency with other users. The details of the user making the changes are associated for tracking purposes.
The VIP Client also manages two other models: the User and Tool Models both of which are associated with the Project Model but are not specific to a particular project. The User Model provides the details of all of the users that have accounts to use the VIP. These users could either be distributed within an organisation, or across organisations. Contact details as well as the project and version users are working on are stored within the users’ profile. The VIP Client displays this information within the user interface to support collaboration on the same project. The user details are synchronised with the database to illustrate when a user changes projects for example.
The Tool Model contains information of all the CAD and CFD tools that have been integrated by an individual user. A CAD or CFD tool is integrated into the VIP by associating details of the tool’s executable with a tool element within the Dependency Network. Since the interoperability between the tools within the VIRTUE project has already been established, the information that is required to integrate a tool relates to its physical location on the user’s computer, directory information relating to where to execute the tool, and store input and output files. The emphasis for data support within the VIP was at the physical level, specifically related to the technology required to transfer data between users; and at the data management level for transaction and consistency management as discussed by Bakis et al. [2]. The tool’s integration information is stored within the Tool Model as well as the user’s profile which is stored within the XML database. Subsequent operation of the VIP Client will automatically populate the Tool Model with the integration information contained within the user profile, and check and make associations where appropriate between the integrated tools and the tool elements within the Dependency Network. Since the users’ profiles are stored in the XML database, the same tools may not necessarily be available to the user if they were to work on a different machine. However the VIP Client attempts to make the tool associations using the information that is available.
Any changes that are made to the models within the VIP Client that need to be propagated to other users are synchronised with the XML database using the XML Update Manager. These changes could for example relate to: the numerical value of a parameter within the Dependency Network; the consistency or lock state of file-based data; the creation of a new version; and changes to a user’s current project. When a change that needs to be synchronised is made, the XML Update Manager generates an XML document defining the state of the object that is changed and sends it to the XML database. The XML Update Manager is also responsible for periodically checking the XML database for changes made by other users working on the same project and version and updating the VIP Client to complete the synchronisation process.
The SFTP Client is responsible for transferring any file-based data that has been created or modified by a user to an SFTP server to make it available to other users. Since all file-based data is stored within an SFTP server and updated within the Version Model for location purposes, the SFTP Client also provides functionality to download any file-based data for input to a tool.
Whilst the various models, the XML Update Manager and the SFTP Client have many different types of interactions, the main ones are illustrated withinFig. 2, and are briefly summarised here:
•
Interaction 1 between the User Model and the DependencyNetwork. The Dependency Network uses information relating to the tools that different users have integrated to alter the way that the network is rendered, graphically indicating to each user the extent of each user’s experience. The user also interacts directly with the Dependency Network in undertaking their design activity, with information relating to the changes that each user makes stored within the Dependency Network.
•
Interaction2 between the User Model and the Tool Model. TheTool Model is initially empty and is populated by a user when tools are integrated into the platform (via the VIP Client). The tool integration information is stored in a user’s profile, so that any user can establish the tools integrated by other users.
•
Interaction3 between the User Model and the Version Model.Users can create, modify (perform design activity on) and delete versions of the data within a project. When a user performs any manipulation of a version, the Version Model associates the changes that have been made with the user that made them. The VIP Client therefore allows users to determine who is responsible for the individual changes that have been made to a version.
•
Interaction 4 between the Tool Model and the DependencyNetwork. When a project is opened, the VIP Client automatically checks the tools that the user has integrated and attempts to associate them to the nodes within the Dependency Network. A user may have many more tools integrated (from different projects for example) than are required by a particular CFD analysis request. When a user attempts to start a tool that is associated with the Dependency Network, the VIP Client will automatically download the associated data and pass it to the mapped tool.
•
Interaction5 between the Version Model and the DependencyNetwork. Any design or analysis activity undertaken is done so with respect to a version of the data. The Dependency Network interacts with the Version Model to determine the location of the data on the network before communicating with the appropriate SFTP server.
3.2. VIP database and SFTP servers
All project related information was stored within an open-source native XML database called dbXML, which provided a hierarchical structure for the storage of XML documents in collections which are synonymous within folders on a file system. The database conformed to the XML:DB Application Programming Interface (API) which defines a common access mechanism to all XML databases. Part of this conformance provides functions to manipulate the database in terms of: querying the contents using XPath (XML Path Language) queries [22]; modifying the contents using XUpdate (XML Update Language) queries; manipulation of collections; and the wrapping of multiple manipulations using transactions.
Most of the interaction with the database was achieved via querying and modifying the contents. Since the performance of dbXML was particularly suited to the management of multiple smaller XML documents of up to 50 kB, the database was con-structed with the following collections containing XML documents no greater than this size:
Fig. 3. Structure for VIP project and version XML documents.
•
Project collection: consisting of sub-collections for each project. Each sub-collection contained an XML document defining project data that included: project name, description, customer etc; project creation, start and end dates; and the dependency network describing the CFD process to follow. Each project sub-collection also contains sub-sub-collections relating to:– Version collection: consisting of sub-collections for each version. The version sub-collection contained individual XML documents for each parameter and file-based data element within the dependency network. These XML documents would for example include: values, state, modification history, and location (of the SFTP server maintaining the data which may be distributed across a network) of all of the design data.
– Graph collection: containing XML documents relating to
the construction of graphs to be shared amongst project participants.
The development of the XML documents within the database was facilitated with the use of the XMLSpy tool which pro-vided support within VIRTUE for modelling, editing, and debug-ging/validation of the database. The tool provided a number of different graphical views of the content within the XML database that aided communication and streamlining the development of the database structure and scope.
Fig. 3 provides an illustration of two of the main types of
information stored within the XML database of the VIP: the project and version XML documents. These documents are represented by a hierarchical tree consisting of complex content which is further broken to simple content. It can be seen fromFig. 3that not all of the information is required in order create a project. The optional information may however be added at a later date.
Fig. 4. VIP network configuration.
within the Dependency Network element has been expanded. The version collection content can be seen within Fig. 3to consist of three different types of documents: a version document that details the specific information for each version; a file document that details the physical location and state of each File Element within the Dependency Network; and a parameter document that details the numerical value and state of each Parameter Element within the Dependency Network. It is the information contained within the File Element and Parameter Element that is modified by the XML Update Manager of the VIP Client when a user operates one of the integrated tools.
The final element of the VIP is the SFTP server that provides distributed file access, transfer and management within a VIP project. The Core mini SFTP server was used for its simplicity and ease of use, however it may be replaced by any SFTP server. The SFTP server would initially be configured with a specific folder created for the storage of all project file-based data. Folders are created by the SFTP server for each individual project, with sub-folders for each version mirroring the collection structure created by the XML database.
3.3. VIP network configuration
The principles of the VRShips client–server architecture were adapted within the VIP, with the server providing the basis for co-ordinating the CAD and CFD activity of the users. However where the VRShips platform had a number of server applications: the process controller; the consistency manager; and the common model, the VIP reduced this to the XML database and at least one SFTP server. The networked structure for the VIP is illustrated within Fig. 4 which indicates how the architecture may be configured across a network with a VIP Client for each designer or analyst; a number of FTP servers and a single XML database.
The VIP Clients are responsible for updating the relevant XML data whenever the user makes a change, for example when the user opens a project, the client modifies the user’s profile data to indicate the current project. The VIP Client are also responsible for downloading the state of all data relevant to a particular project, for example other users working on the same project will be provided with an indication that the user may be working on the same project as they are. All data that is relevant to the state of a project is managed by the VIP Client in this way to ensure that all of the designers and analysts withinFig. 4for example have the same consistent and co-ordinated view of a project.
3.4. Dependency Network operation
As discussed within Section 2 one of the requirements of the VIP was to develop an approach to co-ordinating the CFD analysis request that would make sure the correct designer or analyst was undertaking the correct task with the correct data at the correct time, i.e. achieving timeliness and appropriateness. Past experiences within VRShips for example indicated that an approach structured around a process model had a lack of flexibility that forced the designers into a reactive mode of operation rather than a proactive one. The co-ordination approach should allow the designers and analysts to conduct their work in an ad hoc manner, guided by their intuition, whilst providing a clear indication of the effort that was outstanding in order to complete the design process.
The Dependency Network represented withinFig. 5indicates the data and tools that have been configured for the propeller de-sign project in the second case study described within Section4.2. In this case the flow of action is from left to right, however the net-work could be constructed and modified in any manner with re-spect to flow. Both parametric data (chordFactor0) and file data (baseline propeller description) are used within the network, as well as the use of both tools (modify blade geometry) and trans-formations for the extraction of parametric data from files (in-dicated by the triangle contained within the circular node). The sequence of operations is indicated by the direction of the arrows linking the tools and transformations, starting with the selection of relevant values for the parameters ‘‘chordFactor0’’ through to ‘‘fFactor1’’ and finishing with the creation of the ‘‘summarize.py’’ file.
Each of the parametric and file-based data items has state information relating to: whether it has any data associated with it (for files this means associating a physical file located somewhere on an organisation’s network with the appropriate file within the Dependency Network); whether it is consistent with any design changes that have been made; and whether the data is locked. The parametric and file data is rendered according to the state of the data. For example, with respect to consistency each data item has a red (inconsistent) or green (consistent) bar that provides an intuitive indication of the activity that is required in order to make the entire network consistent.
Fig. 5. Dependency Network structure for propeller design.
user if any the data that they are attempting to use is inconsistent, or if it has been locked. In either case, the user is still allowed to operate the tool, however any changes that are made would not be uploaded or would result in changes to consistency. The Dependency Network provides an explicit indication of the effort that is required in order to generate a complete consistent set of data for the version that is being operated on.
The tools and transformations can be executed by simply double clicking the relevant node within the Dependency Network. The state of the input data is checked and if the state is appropriate, the data is passed directly to the tool. Since the VIP manages all of the file-based data via storage on SFTP servers, whenever a tool is started the VIP Client checks to see where the input file is physically located and transfers the data from that SFTP server. Through the relationships defined within the Dependency Network, the VIP Client is aware of both the data that the tool is expected to create, and where to look for this data being created. This allows the VIP Client to automatically check for the required output data. When the user has finished with the tool, the client performs a final check to automatically gather the output data, prompting the user when it cannot be found. The output data is then uploaded to the FTP server. These mechanisms relating to automatically passing the required input data to the tool, automatically locating the generated output data, and managing all file-based data via SFTP servers, provides two important benefits when the network is properly configured: the designer can concentrate on design work rather than data administration work; and it ensures that the designer gets the correct information at the correct time, ensuring data consistency throughout the network and eliminating rework as a result of using incorrect data.
Although not included withinFig. 5, the Dependency Network can also include goals to give a visual indication to the user of how close the data within the network comes to meeting the objectives. These goals are associated with parametric data and use logical relationships to check whether they have been satisfied. If the goal has not been satisfied, the user can query the goal to see how far away they are from satisfying it.
3.5. Co-ordinating CFD analysis requests
Given the complexity of the ship design and CFD analysis activities, it is unlikely that one person would possess all of the necessary expertise. The CFD analysis request is generally a distributed activity that requires different types of expertise to be correctly co-ordinated in order to efficiently and effectively
complete the process. This expertise in the form of designers and analysts may be either distributed within an organisation at one site, within an organisation at multiple sites, or across organisations at multiple sites. Since the design and analysis typically involves the use of computers, the designers and analysts are distributed across a network similar to that indicated within
Fig. 4.
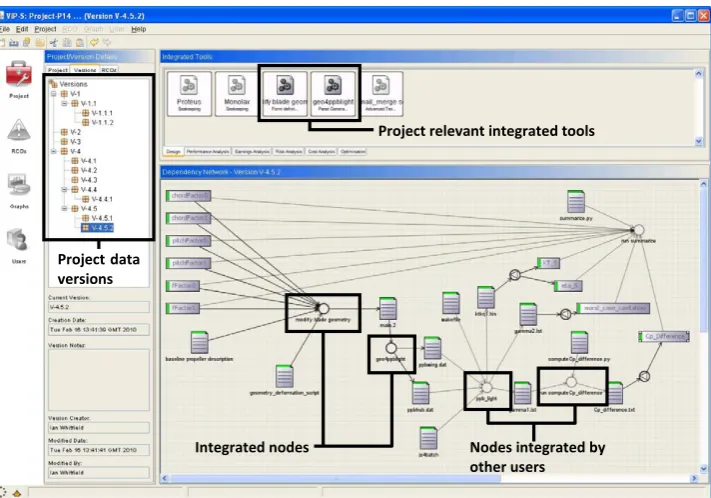
Projects requiring multi-user expertise can be created using Dependency Networks that incorporate these users’ tools. Each user would therefore be responsible for performing a subset of the overall CFD analysis request represented within the network. The VIP Client indicates the tools that have been integrated and where they are associated to nodes within the Dependency Network of a particular project. This can be seen withinFig. 6with the tools that have been integrated within the Dependency Network and Tool Model being highlighted.
As mentioned within Section 3.1 the Dependency Network maintains the consistency status of all of the data within the project and synchronises changes made with the XML database. An example of the synchronisation provided is when a user attempts to start a tool that has been integrated into the network. Before the tool is started, the VIP Client performs a check of the state of the input and output data for the tool with respect to availability, consistency and locked state. If the data passes these checks, the client locks all of this input and output data within the network and uploads this updated locked state to the XML database. Other users working on the same version within the same project will see the state of the data change automatically within their Dependency Networks to indicate that it has been locked. The VIP Client synchronises all data state changes with the database in this way to ensure that all users receive a real-time view of the consistency state of the data within a project. When a number of users are collaborating on the same project, the interaction between the VIP Clients and the XML database allows each user to get a regularly updated view of the activity that is being undertaken. The users of the VIP are subsequently responsible for proactively co-ordinating their own activity in reaction to the changing state of the Dependency Network—the VIP does not dictate how and when users should undertake their work.
Fig. 6. VIP Client interface.
working on providing notification to relevant users to indicate how they could collaborate when working on the same version. The mechanism for managing and synchronising changes to the versions contained within a project is similar to that used for managing the consistency state within a network. The VIP undertakes a check prior to the removal of a version to see whether any other users are currently working on the version, preventing the removal if this were to be the case.
A range of different types of graphs can be produced and shared within the VIP using the parametric data contained within the Version Model. Any modifications to the versions are automatically updated on the graphs. These modifications could for example include new versions being created or deleted, or changes to the parametric data resulting from design changes that are propagated that would result with the points moving around on the graph. The VIP Client provides useful functionality with respect to displaying Pareto fronts, showing the relationships between variants and indicating the strength of correlation between the parametric data that can support the designer in achieving the goals of the project.
3.6. Optimisation using the Dependency Network
The Dependency Network illustrated within Fig. 5 shows the relationship between parametric input data (chord and pitch factors) and parametric output data (thrust and pressure coefficients). If the tools that have been integrated within the network can run automatically (without manual interaction) the entire network can be operated automatically through the sequential execution of the integrated tools within the VIP to evaluate the effect of a change to the input parameters. The VIP Client has a Multi-Criteria Genetic Algorithm (MCGA) for optimisation purposes. Using the propeller design project within
Fig. 5as an example, the VIP Client provides guidance to the user with respect to constructing the optimisation problem:
•
Selection of the optimisation variables. The VIP Client checks the dependency network and provides the user with a list of independent parameters (chordFactor0, chordFactor1, pitchFactor0, pitchFactor1, fFactor0, fFactor1) for consideration as optimisation variables. The user can choose which of thesevariables will be used as the basis for the optimisation which will involve the selection of upper and lower bounds for the variable.
•
Selection of the tools. The VIP Client automatically assumes that all of the tools and transformations will be included within the optimisation and orders them according to the sequence within the Dependency Network (modify blade geometry, geo4ppblight, ppblight, run computeCp_difference, run summarise). The user can however select any logical subset of the tools and transformations within the Dependency Network.•
Selection of the optimisation objectives. The dependent param-eters within the Dependency Network are used as a basis for the optimisation objectives (KT_s,
eta_s, worst_case_cavitation,Cp_Difference). The user can again choose which of these pa-rameters will be used for optimisation and will involve the as-sociation of an objective (maximise, minimise, target value).
•
Selection of the MCGA structure. The user is finally required todefine: the number of generations; the size of the optimisation pool; the crossover algorithm and probability; and the mutation algorithm and probability.
The user can configure the MCGA to create a new version for each concept generated, or optimise a specific version. If a new version is created for each concept, the user can additionally choose to automatically remove the evaluated versions that are not on the Pareto front. During optimisation, a binary encoded gene is generated and decoded into the values for the optimisation variables. The Dependency Network is enacted (through the sequential execution of the integrated tools) and the objectives evaluated. This information for the evaluated concept is used in a conventional manner by the MCGA to evolve a solution towards achieving the objectives. The VIP Client allows the construction of complex optimisation problems consisting of: different types of objectives (minimise, maximise and target value); both hard or soft constraints; and different disciplines simultaneously.
Table 3 provides an indication of the mapping between the
Table 3
Summary of mapping between VIP requirements and functionality.
Rqrmnt VIP support Rqrmnt VIP support
CT1 SFTP for product data communication VV1 Graphical visualisation of Version Model CT2 Java and XML for OS independence VV2 Graphical visualisation of Version Model PC1 Use of Dependency Network templates V1 Sharing of synchronised graphs PC2 Project manager user profiles V2 Creation of multiple graphs within UI PC3 Version Model consistency management S1 Use of XML, XML:DB, SFTP, Java PC4 XML Update Manager and XML database S2 Development free tool integration PC5 User Model and UI visualisation DM1 Version Model controls versions PM1 Dependency Network change propagation DM2 Full control of data storage location PM2 Dependency Network change propagation DM3 SFTP used for efficient data transfer PM3 Version creation, enactment and deletion UI1 Visualisation of Dependency Network O1 Creation of versions during optimisation UI2 User dependent visualisation O2 Optimisation using Dependency Networks UI3 Data consistency status visualised O3 Parametric data in Dependency Networks UI4 Interactive tool control through UI
4. Case studies
The VIP served as a framework for the tools and files within the following case studies. For both case studies, the geometries, tools and processes were based on practical examples. However, since these test cases were proofs-of-concept, the optimisation parameters and the goal functions were simplified. Practical applications would be prepared in the same manner, but with greater attention to complexity and completeness.
First is a hull design, modifying the aft body to improve propulsion performance of a tanker. Three performance criteria were monitored for a given speed: the viscosity-based and gravity-based bare hull resistance coefficients, and the wake quality, a statistical evaluation of flow through the propeller plane. The hull design performances were computed using HSVA’s potential-based panel code,
ν
-Shallo [23], and the RANSE solver FreSCo [24], a joint development of HSVA and the Technical University Hamburg Harburg. The VIP Client provides an interface for an external optimiser engine to be plugged in which used a tangential search to drive hull modifications in order to improve the weighted goal function of the three performance criteria.The second case study was an optimisation of a propeller operating behind a ship using the MCGA integrated into the platform. A six-parameter geometry deformation was applied to a baseline propeller to improve overall efficiency, while still delivering a prescribed thrust as well as avoiding cavitation development. The propeller designs were computed by HSVA using an in-house panel code, ppb. In addition to providing the framework for tools, the VIP also served as the optimiser engine. For this a genetic algorithm was used for the parameter variations.
4.1. Hull design
As in every other aspect of modern life, reducing fuel cost is a significant factor for ship design and operation. The overall hull resistance affects power requirements, and consequently, fuel cost. In a simplified system, reducing hull resistance for a given operating condition will reduce fuel costs. In more complex systems, the hull form also influences the inflow conditions for the propulsion device (e.g., propeller). Improving the inflow to the propeller through small changes to the hull often leads to improved propulsion efficiency, and indirectly lower fuel cost. These hydrodynamic interdependencies can be analysed using advanced CFD codes within a sequence of processes including pre- and post-processing tools. A full blown optimisation further requires CAD based geometry definition and modification as well as an optimisation engine supplied with dedicated objective functions.
[image:11.595.312.563.241.311.2]Often the geometry definition, mesh generation, computation, and post-processing are disparate tools. Some amount of human
Table 4
Main characteristics and test conditions for VIRTUE tanker.
Main characteristics
VIRTUE tanker: Lpp=320.0 (m)
T=21.0 (m)
Speed: Vs=15.5 (kts)
Fn=0.142
Propeller diameter: Dp=9.86 (m)
Mesh size, RANSE: 2.4M cells, double-body
interaction is needed, usually at the mesh generation stage. In order to create a fully automated RANSE optimisation loop, a method was needed to transfer the geometry changes to the computational mesh without any human interaction. In this case study the deformations to the baseline geometry were applied directly to the baseline volume mesh, in an isolated region to minimise distortions and to ensure that the resulting mesh remained topologically identical throughout the optimisation.
Once the new mesh was prepared, the RANSE computation was easily automated; the optimiser generated geometry changes, and the VIP submitted each computation to the job queue on the computing cluster. Another simple batch script integrated within the VIP gathered the necessary computational results.
The VIP provided the interface between the existing process and formal optimisation methods. The input parameters were passed along from the optimiser into the VIP interface, and the results were passed back through the interface to the optimiser to decide the next step. The Dependency Network for the hull design case is illustrated withinFig. 7which illustrates the manual CAD and mesh generation activities followed by the automated hydrodynamic analyses and finally the extraction of the viscous and wave resistance parametric data. The hull design case demonstrates the use of a subsection of the Dependency Network for optimisation, once the manual tasks have been completed. It also illustrates parallel tasks with the networked operation of the RANSE code FreSCo on a dedicated CFD cluster, and the panel code
ν
-Shallo operating on the same machine as the VIP Client. In this case study, the computational power of the CFD cluster is exploited by the VIP. More complex Dependency Networks with greater parallelism could further leverage the benefits of distributed computation and reduce CFD analysis request times.4.1.1. Application
The ship in this case study is a generic tanker used for testing and validation in the VIRTUE project.Table 4indicates the main characteristics and test conditions.
Fig. 7. Hull design Dependency Network.
Fig. 8. VIRTUE tanker illustrating modified region of hull form.
aft shift makes the ship fuller, with a blunter transition. At both extremes of the modified region, the shift amount was tapered to zero, in order to blend more evenly with the surrounding geometry.
For this optimisation exercise, three criteria were evaluated, combining them into a single, weighted goal function. For the first two criteria, the resistance coefficients were measured in two components: the viscous components of resistance,Cv, computed by the RANSE double-body computation in FreSCo, and the wave resistance,Cw, computed by the panel code
ν
-Shallo. The inflow to the propeller was the third criterion. This may be quantitatively measured by computing a wake quality value. The wake quality is a statistical evaluation of flow through propeller plane, computed by integrating the axial component of velocity, which has been normalised by the free-stream flow speed. The mean value, standard deviation, and minimum and maximum are evaluated over a constant radius. Several radii are integrated over the propeller area to a single value, ranging from 0 (impossibly poor) to 1.0 (perfectly uniform flow distribution). [image:12.595.309.548.244.360.2]The baseline hull form was computed first manually. The values of the three performance criteria for all subsequent computations were stored as the percent change compared to the baseline hull form values. The goal function for this case study was the summation of these percent changes; each of these three components was given equal weighting. The selection of optimisation criteria and their respective weights in the goal function are part of an ongoing discussion among experts. These criteria and weights are different, depending on the type of ship (tanker, container ship, etc.) and their respective characteristics (manoeuvring, resistance, sea-keeping). A tangential search method was used to minimise the weighted goal function for the three criteria described above. Once the optimisation concluded, the wake distributions at the propeller plane of the initial and final designs were compared through visual inspection. These, of course, could not be included in the formal optimisation, as they are qualitative assessments.
[image:12.595.300.556.409.434.2]Fig. 9. Optimisation results from RANSE computation.
Table 5
Changes from initial to final design.
Viscous resistance Wave resistance (1-Wake quality)
Final design +2.9% −2.0% −16.3%
4.1.2. Results
During this optimisation, 39 designs were computed over a ten day period, averaging four designs per day—Fig. 9. After ten days, the optimisation was manually stopped, and the results reviewed among the CFD department staff at HSVA.
Fig. 9 shows the individual criteria and goal function as
percentage change over the baseline design. In this, positive values show an increased resistance. The expected values for a typical wake quality (wq), according the methods used at HSVA, would be 0.0
=
worst, 1.0=
best. For consistency among the criteria, the wake quality was measured as 1.0-wq (0.0=
best, 1.0=
worst). For all criteria, negative values equate to reduced fuel cost.At the end of the optimisation, the initial and final designs were compared, to determine how much the design improved. The first few designs in the optimisation showed poorer total performance despite slight improvements to the viscous component of resis-tance (Cv). As the optimisation progressed, the tangential search found a combination that improved total performance. Table 5
shows the changes among the individual quantitative computa-tional values.
Although the viscous resistance increased, these were offset by the reduced wave resistance and the improvement to the wake quality for an overall improvement.
Fig. 10. Initial and final wake distribution plots.
Fig. 11. Baseline section (left), many sections define a blade (right).
4.2. Propeller design
In addition to lower fuel cost, such performance characteristics as cavitation inception, blade stresses, and vibration responses are considered very important for propeller design. The propeller must deliver the necessary thrust efficiently, while also avoiding exces-sive blade loading, cavitation, or noise via pressure interaction with the ship hull.
Many characteristics describe the propeller geometry. Among other characteristics, the propeller pitch, chord, thickness, rake, skew, and camber are defined at specific radii, from hub to tip for a single propeller blade. The blade surface is generated by interpolating smoothly in-between.Fig. 11shows a blade section (left) and many sections along one propeller blade (right).
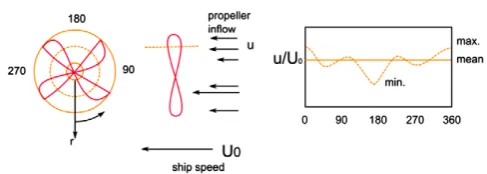
The operating conditions are also vital. A propeller performs differently in open-water conditions than when combined with a given ship (in-behind conditions). Additionally, the ship itself, similarly to that described in the previous test case, can also affect propeller performance; seeFig. 12. All of these factors need to be considered when designing a propeller.
For evaluating a given propeller design, or set of designs, panel codes are extremely fast compared to RANSE methods, and deliver satisfactory results. Besides the computational speed, the geometry definition and subsequent panel mesh generation are also greatly simplified compared to those needed for RANSE computations. In the methods employed by HSVA, the entire propeller may be defined in a small text file. The design properties – pitch, camber, thickness, etc. – are described in a structured and compact format. This compact format facilitates rapid, automated design variations, excellent for formal optimisation methods.
The Dependency Network for the propeller design case is illustrated within Fig. 5. Parametric data for chord, pitch, and camber represent the input to the network, followed by four
Fig. 12. Propeller inflow analysis description.
design and analysis tools that operate sequentially, generating file-based output which subsequently has parametric data extracted (required thrust, efficiency). Since the tools integrated within this Dependency Network provide a rapid evaluation, the sequential execution of the tools is undertaken on the same machine as the VIP Client with little benefit to be gained from distributing the tools across the network. In addition, the optimisation would be undertaken for the propeller design case using the entire network within Fig. 5, with the optimiser generating values for the chord, pitch and camber parameters, executing the network, and evaluating the objectives of the required thrust and efficiency parameters.
The only significant difference between this case study and a typical design exercise based on a plain panel code approach is simply how the geometry changes are defined. Instead of the typical manually defined changes, the geometry definitions are parametrically controlled via a python script. This python script accepts 6 variables as input, two for each of the three design parameters (pitch, chord and camber) in this optimisation. For each of these design parameters, a constant shift and a linear component are used to modify the baseline distribution values. The equation for this modification is centred about the 0.7 radius. Here the linear component pivots about this point.Figs. 13–15illustrate the individual and combined effects these two components have over the camber, pitch and chord length distributions.
The VIP provided the framework for optimisation, based on the same process chain for single, manually driven evaluations. The VIP served as the optimisation engine, employing the integrated MCGA method for varying the input parameters for each design candidate.
4.2.1. Application
A generic propeller was selected for this case study. The wake distribution, caused by the presence of the ship, was provided as an input file. The velocity components are provided over a constant radius, through an entire rotation cycle. This information was provided by a RANSE computation, similar to the method from the previous case study. Alternatively, the wake distribution from model testing may also be used, if available.
The propeller was evaluated using HSVA’s in-house panel code, ppb, to generate a target thrust (KT
=
0.
1868) and to maximise the overall efficiency (eta) for the given flow conditions:•
Advance coefficient,J=
0.
83.•
Rotation speed,n=
1.
7(
1/
s)
.•
Diameter,D=
8.
95 (m). [image:13.595.60.280.60.312.2]Fig. 13. Effect of constant shift on distributions: camber (left), pitch (centre), chord (right).
Fig. 14. Effect of linear shift on distributions: camber (left), pitch (centre), chord (right).
Fig. 15. Effect of combined shift on distributions: camber (left), pitch (centre), chord (right).
Fig. 16. Graph of thrust against efficiency for evaluated designs.
4.2.2. Results
The entire set of 500 designs in this optimisation was completed in one overnight session. The plots withinFig. 16show the designs, arranged by efficiency (eta_s) and the thrust coefficient (KT_s), with the target thrust value of 0.1868 indicated with a horizontal, red bar. The green box indicates the extents of the zoomed view of the design points. The symbols in the zoomed view indicate the initial design, and an ‘‘Expert’s Choice’’.
These two values, eta_s and KT_s, alone would not suffice for a final design, but do provide an initial selection for more intensive studies regarding the correlation between geometry parameters and performance. The pressure distributions on the pressure and suction sides of the blades, for example, indicate possible cavitation. Other aspects would also be examined, such as thickness, camber, rake, skew, etc.
In the end, the propeller expert at HSVA consented to the above indicated design. This improved design (‘‘Expert’s Choice’’) provided the desired thrust with an efficiency increase of approximately 5.5% for the given condition.
5. Discussion
[image:14.595.75.512.318.421.2] [image:14.595.114.474.448.559.2]