1 ETRP PROGRESS REPORT
Address to:
Director, Environment Technology Office National Environment Agency
40 Scotts Road, #11-00, Environment Building Singapore 228231
Attn: ETRP Secretariat
National Environment Agency Environment Technology Office
40 Scotts Road, #11-00, Environment Building Singapore 228231
Attn: Project Officer, Ms Teresa Cheong
GUIDELINES FOR ETRP PROGRESS/FINAL REPORT
Project Reference No.: ETRP 1201 105 Project Completion Date: 12/2014
Project Title: Developing Novel Biorefineries using Food Waste as Substrate
Organization: Nanyang Technological University, NEWRI, AEBC
Officer-in-charge: A/P Yu Liu
Project Period (Please tick the appropriate box)
2 Part A
1. PROJECT MANAGEMENT AND EXECUTION
The project is progressing smoothly on schedule as shown below. The projected milestones and deliverables have all been achieved as detailed in Section “Results and Discussion”. As of
December 2013, we have completed the optimization of in-situ glucoamylase production from cake waste. Meanwhile, the saccharification level of mixed type food wastes (from cafeteria) was investigated using in-situ produced enzyme solution, and the optimization studies were started. The two bioreactors with essential control software now are ready for the next phase of experiments. The waste volume reduction after enzymatic saccharification was also evaluated.
Milestones and Deliverables
Implementation Schedule
Year 1 Year 2 Remarks
Q1 Q2 Q3 Q4 Q1 Q2 Q3 Q4
Literature Review
1: Characterisation of KW
2: Construction of 2 HRs (2-5L)
3: Liquid state fermentation of FW by Aspergillus: characterization of enzymes
Actual Implementation
4: Solid State fermentation of FW by Aspergillus characterization of enzymes
5: Optimization of in-house enzymes production
6: Enzymatic hydrolysis of KW using in-house enzymes cocktail produced by Aspergillus
3 2. RESULTS & DISCUSSION
2.1. Optimization of in-situ enzyme production
The influence of different food waste such as bread, cake, savory, vegetable, fruit, potato and mixed type food waste (MFW) from a cafeteria on glucoamylase production by Aspergillus awamori was tested previously (Figure 1). The incubation time is governed by characteristics of the culture and is based on growth rate and enzyme production. Maximum glucoamylase production normally occurs after 2-5 days of incubation as reported by other researchers working with solid state cultures involving bacteria and fungi (Melikoglu et al., 2013b; Soni et al., 2003). The maximum activity of glucoamylase was obtained using waste cakes on the 4th day of fermentation. Due to a more balanced composition of cake waste with high reducing sugar and protein content, a better fungal growth and higher glucoamylase activity was obtained. As the highest glucoamylase activity was obtained using cake wastes (85.1±6.8 U/gds), following experiment sets were conducted using it.
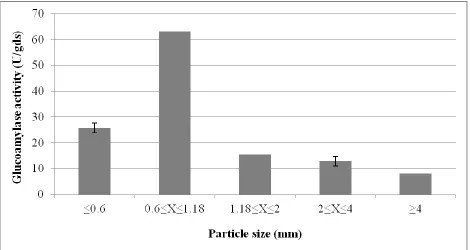
2.1.1. Effects of particle size
4 Figure 1. The effect of cake particle size on glucoamylase production using moisture content of 70% (wb), inoculum loading of 106/g substrate at neutral initial pH and 30oC for 4 days.
2.1.2. Optimization of glucoamylase production by response surface methodology
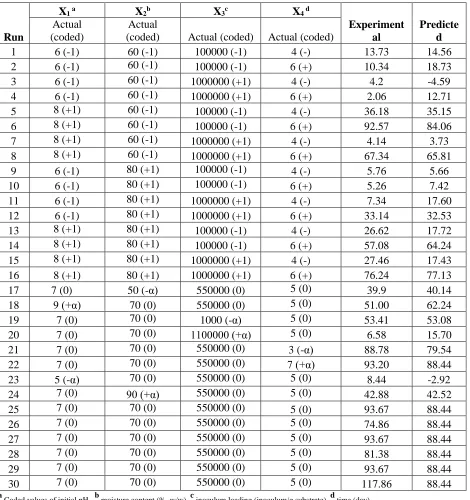
5 Table 1. Central composite design with observed and predicted responses of glucoamylase activities. Each row corresponds to a single experiment.
Run
X1 a X2b X3c X4 d
Experiment al Predicte d Actual (coded) Actual
(coded) Actual (coded) Actual (coded)
1 6 (-1) 60 (-1) 100000 (-1) 4 (-) 13.73 14.56
2 6 (-1) 60 (-1) 100000 (-1) 6 (+) 10.34 18.73
3 6 (-1) 60 (-1) 1000000 (+1) 4 (-) 4.2 -4.59
4 6 (-1) 60 (-1) 1000000 (+1) 6 (+) 2.06 12.71
5 8 (+1) 60 (-1) 100000 (-1) 4 (-) 36.18 35.15
6 8 (+1) 60 (-1) 100000 (-1) 6 (+) 92.57 84.06
7 8 (+1) 60 (-1) 1000000 (+1) 4 (-) 4.14 3.73
8 8 (+1) 60 (-1) 1000000 (+1) 6 (+) 67.34 65.81
9 6 (-1) 80 (+1) 100000 (-1) 4 (-) 5.76 5.66
10 6 (-1) 80 (+1) 100000 (-1) 6 (+) 5.26 7.42
11 6 (-1) 80 (+1) 1000000 (+1) 4 (-) 7.34 17.60
12 6 (-1) 80 (+1) 1000000 (+1) 6 (+) 33.14 32.53
13 8 (+1) 80 (+1) 100000 (-1) 4 (-) 26.62 17.72
14 8 (+1) 80 (+1) 100000 (-1) 6 (+) 57.08 64.24
15 8 (+1) 80 (+1) 1000000 (+1) 4 (-) 27.46 17.43
16 8 (+1) 80 (+1) 1000000 (+1) 6 (+) 76.24 77.13
17 7 (0) 50 (-α) 550000 (0) 5 (0) 39.9 40.14
18 9 (+α) 70 (0) 550000 (0) 5 (0) 51.00 62.24
19 7 (0) 70 (0) 1000 (-α) 5 (0) 53.41 53.08
20 7 (0) 70 (0) 1100000 (+α) 5 (0) 6.58 15.70
21 7 (0) 70 (0) 550000 (0) 3 (-α) 88.78 79.54
22 7 (0) 70 (0) 550000 (0) 7 (+α) 93.20 88.44
23 5 (-α) 70 (0) 550000 (0) 5 (0) 8.44 -2.92
24 7 (0) 90 (+α) 550000 (0) 5 (0) 42.88 42.52
25 7 (0) 70 (0) 550000 (0) 5 (0) 93.67 88.44
26 7 (0) 70 (0) 550000 (0) 5 (0) 74.86 88.44
27 7 (0) 70 (0) 550000 (0) 5 (0) 93.67 88.44
28 7 (0) 70 (0) 550000 (0) 5 (0) 81.38 88.44
29 7 (0) 70 (0) 550000 (0) 5 (0) 93.67 88.44
30 7 (0) 70 (0) 550000 (0) 5 (0) 117.86 88.44
a
Coded values of initial pH, b moisture content (%, w/w), cinoculum loading (inoculum/g substrate), d time (day).
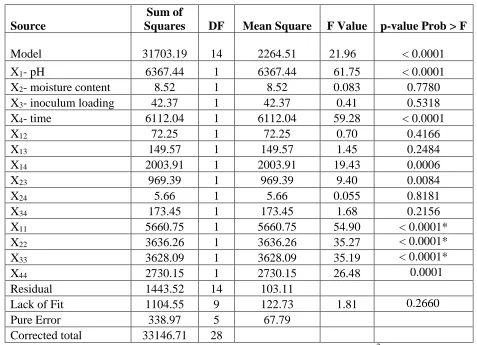
[image:5.612.74.544.111.611.2]6 F is large enough to indicate statistical significance. If P-value is lower than 0.05, it indicates that the model is statistically significant. The ANOVA result for the glucoamylase production system shows the model F-value of 21.96 indicating that the model is significant (Table 2). There is only a 0.01% chance that a “Model F-Value’’ this large could occur due to noise. The P-values less
7 Table 2. ANOVA for glucoamylase production as a function of initial pH (X1), moisture content (X2), inoculum loading (X3) and time (X4).
Source
Sum of
Squares DF Mean Square F Value p-value Prob > F
Model 31703.19 31703.19 14 2264.51 21.96 < 0.0001
X1- pH 6367.44 1 6367.44 61.75 < 0.0001
X2- moisture content 8.52 1 8.52 0.083 0.7780 X3- inoculum loading 42.37 1 42.37 0.41 0.5318 X4- time 6112.04 1 6112.04 59.28 < 0.0001
X12 72.25 1 72.25 0.70 0.4166
X13 149.57 1 149.57 1.45 0.2484
X14 2003.91 1 2003.91 19.43 0.0006
X23 969.39 1 969.39 9.40 0.0084
X24 5.66 1 5.66 0.055 0.8181
X34 173.45 1 173.45 1.68 0.2156
X11 5660.75 1 5660.75 54.90 < 0.0001*
X22 3636.26 1 3636.26 35.27 < 0.0001*
X33 3628.09 1 3628.09 35.19 < 0.0001*
X44 2730.15 1 2730.15 26.48 0.0001
Residual 1443.52 14 103.11
Lack of Fit 1104.55 9 122.73 1.81 0.2660
Pure Error 338.97 5 67.79
Corrected total 33146.71 28
*Significant variable; DF, degree of freedom; determination coefficient (R2), 0.9565; adjusted determination coefficient (R2adj), 0.9129; coefficient of variation (CV), 22.81; adequate precision ratio, 12.74.
The equation in terms of actual factors (confidence level above 95%) as determined by Design of expert software is given below:
GA Activity (U/gds) = -1366.16 + 184.69*X1 + 17.38 * X2 + 8.02*10-6 *X3 + 39.82*X4 - 0.21* X1*X2 - 6.79*10-6*X1*X3 + 11.19*X1*X4 + 1.73*10-6* X2*X3- 0.06*X2*X4 + 7.32*10-6*X3*X4 -
14.7* X1 2
- 0.12*X2 2
- 1.11*10-10*X 3
2
- 10.21*X4
2
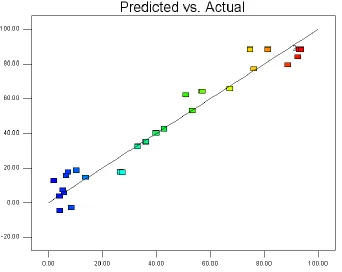
8 X33 and X44 demonstrate the existence of quadratic and linear interaction effects that decrease the response quantity, while the positive coefficients for X14, X23 and X34 expose the existence of quadratic interaction effects that enhance the activity of glucoamylase. Figure 2 shows the correlation between the experimental and predicted values of the response. The points close to the line indicate a good fit between the experimental and predicted data.
Figure 2. The observed (X axis) versus the predicted (Y axis) glucoamylase activities under the experimental conditions.
9 production by A. awamori using SSF is adjusted to neutral pHs as the fungus grows well at such pHs. Since the maximum activity of 92.92 U/gds was determined at pH 7.5 using initial moisture content of 69.6%, these conditions were kept constant in the subsequent studies to find the optimum inoculum loading and incubation time.
10 4A3A
11 4C3C
[image:11.612.93.500.69.659.2]4D3D
12 loading and pH using initial moisture content of 69.6% for 6 days (4C3C); initial pH and moisture content using inoculum loading of 5.2*105/g substrate for 6 days (4D3D) on glucoamylase activity from cake waste.
2.1.3. Validation of the response model
To evaluate the accuracy of quadratic polynomial model, a verification experiment was conducted under the predicted optimal conditions and the result was 108.47 U/gds which is 1.37% higher than the predicted value. This is higher than values reported by (Wang et al., 2009) for the same fungus using wheat flour and similar to those reported by (Melikoglu et al., 2013b) on bread pieces. This high degree of accuracy obtained confirms the validity of the model with minor discrepancy due to the slight variation in experimental conditions. The activity obtained is (1.4 fold) higher than the yield obtained by cake wastes at 6th day of the fermentation without optimization suggesting the important role of RSM for rapid screening of important process variables in the optimization studies.
2.2. Saccharification of FWs with In-situ Produced Enzyme
In order to gauge enzymatic saccharification degree of the mixed food waste, in-situ produced enzyme solution (obtained from cake waste) was used. The optimal pH temperature for the saccharification using glucoamylase from Aspergillus awamori was reported as 60oC (Melikoglu et al., 2013a). To maximize glucose yield, the effects of different operational conditions such as substrate loading, glucoamylase loading and pretreatment duration were studied.
2.2.1. The effects of substrate loading
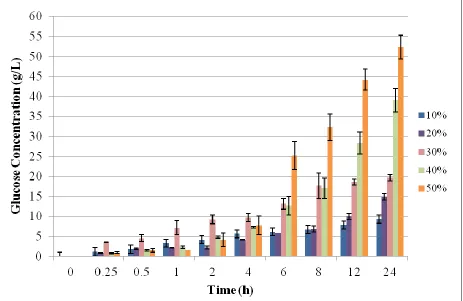
Enzymatic pretreatments were conducted in 100 mL Duran bottles placed in a water bath. The suspensions were prepared by mixing the desired amounts of food waste, 100 mM phosphate buffer (pH 7) and the enzyme solution. Glucoamylase treatment was conducted using 10, 20, 30, 40 and 50% (w/v) food waste loadings with 2, 5 and 10U/g FW enzyme loadings for 24 hours. Higher than 50% waste concentrations were not studied as the suspension became very viscous, which certainly would inhibit enzyme’s action. The hydrolysis conducted for 24h and samples
13 until t=4h and increased dramatically after t=4h. This might be related to elongated starch gelatinization process.
At t=24 hour, maximum glucose concentration of 9.3±0.9, 14.8±0.77, 19.7±0.77 and 39.1±2.93 and 52.3±2.97 g/L was obtained using 10, 20, 30, 40 and 50% (w/v) food waste loadings, respectively. Moreover, the saccharification degree at t=24h was 99.8% for 50% substrate loading. These results demonstrate that there is no substrate inhibition so food waste can be used without much dilution, which in turn decrease the waste water generation. Even at t=12h, the saccharification degree was in the range of 55-88% depending on the waste concentration. Still, the production of maximum glucose concentration is the main target in this study. Thereby, the effects of higher enzyme loadings needed to be evaluated to obtain high glucose concentration in shorter hydrolysis time.
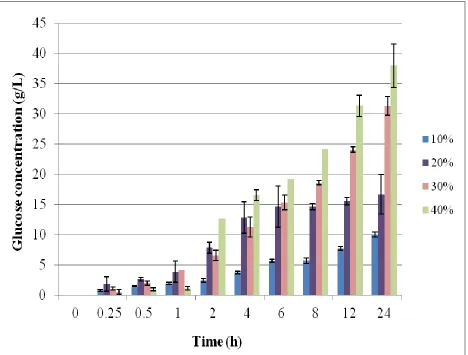
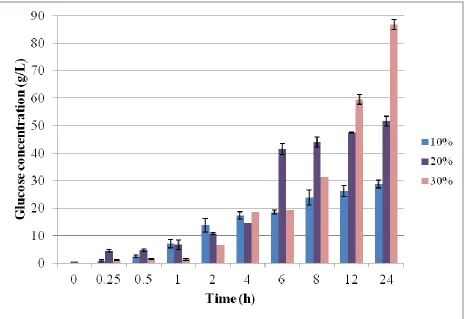
[image:13.612.77.540.342.643.2]14 2.2.2. The effects of glucoamylase loading
The enzyme loading is another important parameter to improve the hydrolysis and speed up the reaction rate up. To determine its effects, experiments were set up using glucoamylase loadings of 5 and 10U/g FW.
15 Figure 5. The effect of substrate loading on saccharification. The food waste loadings studied were 10, 20, 30, 40 and 50% (w/v) using glucoamylase loading of 5U/g substrate for 24 hours at 60oC for 24 hours.
[image:15.612.75.543.71.426.2]16 Figure 6. The effect of substrate loading on saccharification. The food waste loadings studied were 10, 20, 30, 40 and 50% (w/v) using glucoamylase loading of 10U/g substrate for 24 hours at 60oC for 24 hours.
2.2.3. Volume reduction of food waste after enzymatic hydrolysis
In this part of the study, the effect of in-situ produced enzyme solution on the solubility i.e. volume reduction of solid food waste was investigated and evaluated. For this, Total Suspended Solids (TSS) and Volatile Suspended Solids (VSS) analyses were conducted at the end of the 24 hour-enzymatic hydrolysis. Non-hydrolyzed food waste suspension normally contained 49.35±1.75 g/L TSS with a 49.08±1.68 g/L VSS, while the pretreated food waste suspensions contained less than half of these values (Table 3). In other words, 51.1 to 62.4% of the solid residue was solubilized after the hydrolysis. By using in-situ produced enzyme solution not only the efficient hydrolysis of the starch polymer but also the food waste’s volume reduction was
[image:16.612.76.540.91.410.2]17 Table 3. The effect of enzymatic hydrolysis on VSS & TSS contents and VSS reduction (%)
Conditions VSS (g/L) TSS (g/L) VSS reduction (%)
FW (no hydrolysis) 49.08±1.68 49.35±1.75
10% FW suspension with 2U/g FW GA 24.00±0.60 24.33±0.58 51.10±1.22 10% FW suspension with 5U/g FW GA 21.48±3.33 22.08±3.58 56.24±6.78 10% FW suspension with 10U/g FW GA 20.10±5.70 22.78±3.33 59.04±11.62 20% FW suspension with 2U/g FW GA 19.30±0.80 19.63±0.93 60.67±1.63 20% FW suspension with 5U/g FW GA 18.48±0.43 26.10±2.85 62.35±0.87
2. Plans for the Next 6 and 12 Months Period
Next 6 Months:
The optimization of food waste saccharification will be completed. For this, the enzyme
loading, solid loading, temperature, pH and hydrolysis time will be optimized in two hydrolytic bioreactors.
The effect of different pretreatments, such as heat, alkaline, microwave and ultrasonication on food waste, will be investigated to improve enzyme production and saccharification.
The immobilization of in-situ produced enzyme solution will be studied to improve its
stability and shelf life.
Next 12 Months:
Besides Aspergillus awamori, microbial strains producing other saccharification enzymes such as α-amylase, cellulase, β-glucosidase and pullulanase, will be cultured and/or co-cultured
with Aspergillus awamori to produce an enzyme cocktail in order to improve the saccharification yield further and solids destruction.
The produced enzyme cocktails will be used to saccharify mixed type food wastes. For this,
the enzyme loading, solid loading, temperature, pH and hydrolysis time will be optimized in hydrolytic bioreactors.
The residues will be used to produce biogas using anaerobic digestion.
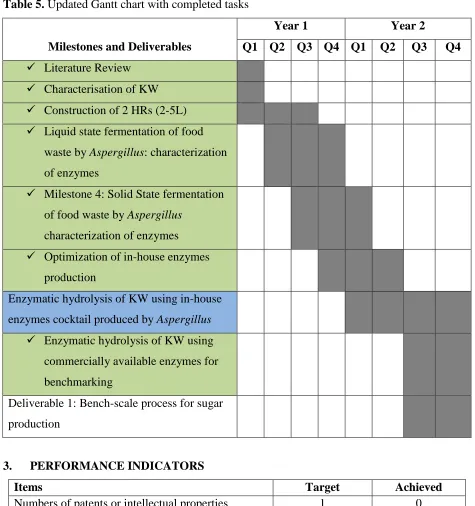
18 The proposed milestones and deliverables are summarized in Table 5. Green colored milestones shows the completed tasks while the blue ones are related to the tasks in progress.
Table 5. Updated Gantt chart with completed tasks
Milestones and Deliverables
Year 1 Year 2
Q1 Q2 Q3 Q4 Q1 Q2 Q3 Q4
Literature Review
Characterisation of KW Construction of 2 HRs (2-5L) Liquid state fermentation of food
waste by Aspergillus: characterization of enzymes
Milestone 4: Solid State fermentation
of food waste by Aspergillus characterization of enzymes Optimization of in-house enzymes
production
Enzymatic hydrolysis of KW using in-house enzymes cocktail produced by Aspergillus
Enzymatic hydrolysis of KW using
commercially available enzymes for benchmarking
Deliverable 1: Bench-scale process for sugar production
3. PERFORMANCE INDICATORS
Items Target Achieved
Numbers of patents or intellectual properties 1 0
Numbers of researchers* 1 1
Numbers of research man-months* 24 12
19 In the project proposal it was proposed to produce 1 IP and 2 to 3 article during the project. We have already submitted three articles:
-One comprehensive review article on food waste valorization using biological treatment strategies.
-One research article on the optimization of enzymatic glucose production from cafeteria food waste using response surface methodology.
-One research article on the optimization of enzymatic glucose production from cafeteria food waste using response surface methodology.
We have also submitted one Technical Disclosure on enzyme production from food waste for sludge and wastewater treatment.
20 References
Khuri, A.I., Cornell, J.A. 1987. Response Surfaces: Design and Analysis. Marcel Dekker, New York.
Melikoglu, M., Lin, C.S.K., Webb, C. 2013a. Kinetic studies on the multi-enzyme solution produced via solid state fermentation of waste bread by Aspergillus awamori. Biochemical Engineering Journal, 80, 76-82.
Melikoglu, M., Lin, C.S.K., Webb, C. 2013b. Stepwise optimisation of enzyme production in solid state fermentation of waste bread pieces. Food and Bioproducts Processing.
Muthukumar, M., Mohan, D., Rajendran, M. 2003. Optimization of mix proportions of mineral aggregates using Box Behnken design of experiments. Cem. Concr. Compos. , 25, 751-758.
Ruiz, H.A., Rodriguez-Jasso, R.M., Rodriguez, R., Contreras-Esquivel, J.C., Aguilar, C.N. 2012. Pectinase production from lemon peel pomace as support and carbon source in solid state fermentation column-tray bioreactor. Biochemical Engineering Journal, 65, 90-95
Soni, S.K., Kaur, A., Gupta, J.K. 2003. A solid-state fermentation based bacterial alpha-amylase, fungal glucoamylase system, its suitability for hydrolysis of wheat starch. Process Biochem., 39, 158-192.
Wang, R., Godoy, L.C., Shaarani, S.M., Melikoglu, M., Koutinas, A., Webb, C. 2009. Improving wheat flour hydrolysis by an enzyme mixture from solid state fungal fermentation. Enzyme Microb. Technol. , 44(4), 223-228.
21 Declaration
I declare that the information of the Development Project as described in the above report is true and to the best of my knowledge.
Associate Prof Liu Yu
Principle investigator Signature
Principle Investigator
Date
Technology Transfer office (or equivalent)
Signature
Technology Transfer office (or equivalent)
Date
Name
Research Director
Signature
Research Director
Date
Research Director
Organization Stamp: ______________________________________________ <Organization’s name>