force
.
White Rose Research Online URL for this paper:
http://eprints.whiterose.ac.uk/81029/
Version: Publishers draft (with formatting)
Article:
Zafar, U, Hare, C, Hassanpour, A et al. (1 more author) (2014) Drop test: A new method to
measure the particle adhesion force. Powder Technology, 264. 236 - 241. ISSN 1873-328X
https://doi.org/10.1016/j.powtec.2014.04.022
[email protected]
https://eprints.whiterose.ac.uk/
Reuse
Unless indicated otherwise, fulltext items are protected by copyright with all rights reserved. The copyright
exception in section 29 of the Copyright, Designs and Patents Act 1988 allows the making of a single copy
solely for the purpose of non-commercial research or private study within the limits of fair dealing. The
publisher or other rights-holder may allow further reproduction and re-use of this version - refer to the White
Rose Research Online record for this item. Where records identify the publisher as the copyright holder,
users can verify any specific terms of use on the publisher’s website.
Takedown
If you consider content in White Rose Research Online to be in breach of UK law, please notify us by
U. Zafar, C. Hare, A. Hassanpour, M. Ghadiri
⁎
Institute of Particle Science and Engineering, School of Process, Environmental and Materials Engineering, University of Leeds, Leeds LS2 9JT, UK
a b s t r a c t
a r t i c l e
i n f o
Article history:
Received 1 November 2012
Received in revised form 14 March 2014 Accepted 5 April 2014
Available online 18 April 2014
Keywords: Interface energy Particle adhesion Pull off force Adhesion measurement
Measurement of the adhesive force is of great interest in a large number of applications, such as powder coating and processing of cohesive powders. Established measurement methods such as Atomic Force Microscopy (AFM) and the centrifugal method are costly and time consuming. For engineering applications there is a need to develop a quick test method. The drop test method has been designed and developed for this purpose. In this test method particles that are adhered to a substrate are mounted on and are subjected to a tensile force by impacting the stub against a stopper ring by dropping it from a set height. From the balance of the detachment force and adhesive force for a critical particles size, above which particles are detached and below which they remain on the substrate, the interfacial specific energy is calculated. A model of adhesion is required to estimate the adhesive force between the particles and the surface, and in this work we use the JKR theory. The detachment force is estimated by Newton's second law of motion, using an estimated particle mass, based on its size and density and calculated particle acceleration. A number of materials such as silanised glass beads, Avicel,α -lactose monohydrate and starch have been tested and the adhesive force and energy between the particle and the substrate surface have been quantified. Consistent values of the interface energy with a narrow error band are obtained, independent of the impact velocity. As the latter is varied, different particle sizes detach; neverthe-less similar values of the interface energy are obtained, an indication that the technique is robust, as it is in fact based on microscopic observations of many particles. The trends of the results obtained with the drop test method are similar to those shown in studies by other researchers using established methods like the AFM and the centrifuge method.
© 2014 The Authors. Published by Elsevier B.V. This is an open access article under the CC BY license (http://creativecommons.org/licenses/by/3.0/).
1. Introduction
Adhesion offine particles is a topic of great interest in process engineering as it can cause undesirable effects, such as erratic or unreli-ableflow and blockages, leading to reduced production efficiency. Adhesion commonly arises from various forces such as van der Waals, Fvdw(dominant infine powders), electrostatic,Fes, (significant in the
case of highly charged particles) and capillary,Fc(at high humidity
levels). Details of these forces are covered by[1–3].
There are several techniques available for measurement of the adhesive forces, including Atomic Force Microscopy (AFM)[4], centrifu-gal method[5], electricfield detachment method[6], aerodynamic detachment[7], and vibration method[8]. Each technique produces a different measure of adhesion due to the mechanism involved in the given method as particle deposition, surface contact measurement, strain rate, etc., will be different for each technique[9]. Furthermore particle shape and surface topography affect the force measurement even for the same particles due to variations in contact geometry[10]. Therefore, a sufficient number of measurements are required to
produce reliable data, and hence measurement of adhesive forces is considered difficult, especially for irregular shapes and in the cases where the effects of temperature and moisture are involved[11]. Adhesion measurement techniques such as AFM and the centrifugal method are well developed, but unfortunately the equipment is expensive and the measurement is time consuming. A major limitation of the AFM technique from an engineering view point is that it only characterises single particle adhesion and many measurements need to be taken for irregular particles to have reliable data, making it unrealistically time consuming. Furthermore, a wide spread of values usually prevail for a given material due to variations of contact geome-tries and local properties. In the centrifugal detachment method the adhesion between particles and substrate is estimated by balance of centrifugal force generated from rapidly rotating the surface. The speci-men is subjected to several rotational speeds following which particle detachment is examined. Electrostatic detachment method characterises particle adhesion by using electricfields to remove particle from the surface, but the limitation of this technique is that it can measure adhesion of only conducting particles. The aerodynamic method mea-sures the adhesive force between particles and a substrate by application of a gas stream across the surface. However, particle–particle collisions may occur and the drag force may be influenced by the close proximity
⁎ Corresponding author. Tel.: +44 113 343 2406; fax: +44 113 343 2405. E-mail address:[email protected](M. Ghadiri).
http://dx.doi.org/10.1016/j.powtec.2014.04.022
of the particles, as such breakage wide scatter in the measurement is probable. Similarly, the hydrodynamic technique exhibits the same problems, and can only be applied for particles and surfaces which are insoluble, thus limiting its use. The vibration method provides a sinusoi-dally alternating stress to detach particles. However, this can cause an intensification of the adhesion force due toflattening of the asperities
[12].
Another method based on detachment of particles via vibration was introduced by Saeedi et al.[13]. The technique uses resonance frequency to bring about the rocking motion on the surface where particle has been adhered. This motion is excited by a short acoustic pulse normally generated either by air acoustic transducer or ultrasonic transducer which is connected with theflat surface acoustic transducer or ultrasonic transducer which is connected with theflat surface. With the use offibre optic vibrometer, transient response of particles can be determined and resonance frequency of the motion can be extracted in the waveform. Similar technique was recently applied by Wanka et al.[14]using Hop-kinson bar. In this techniquefine pharmaceutical powders (3–13μm) are subjected to acceleration of 500,000gand their detachment is detect-ed by optical microscopy. However, due to the dynamics involvdetect-ed in test method, these techniques are limited to narrow particle size range which
can be tested typically from 3–20μm. Furthermore the vibrational nature of this approach, the detachment arises from progressive partial slip of the contacts, rather than from a single event. One more disadvantage of these techniques is that possible plastic deformation can occur and cause damage to surface and particles at high vibration force.
A number of models have been developed to describe the contact mechanics of cohesive particles. The most widely used are the theories of Johnson et al.[15]and Derjaguin et al.[16](DMT). The theory of Johnson (JKR) is based on the Hertz analysis, with the addition of adhesion energy modifying the contact area and requiring a pull-off force to detach the contacting particles. This pull-off force is related to the surface energy of the contact. The JKR theory assumes that the pressure distribution at the contact is such that all short range contact forces exist within the contact area. An alternative theory of adhesion is the DMT model, which considers non-contact forces of molecular attraction acting outside the contact area. Both these models are appli-cable under different adhesion limits. The JRK model is more appropri-ate for soft mappropri-aterials with significant adhesive forces, whilst the DMT model describes weaker attraction between stiff materials. The details on single and multiple contact mechanism are outside the scope of this study and are not covered here. Comprehensive reviews on the fundamentals of contact mechanics can be found in[17].
In this paper we report our evaluation of the performance of the drop test method. The measurement approach is similar to that proposed by Ermis et al.[18]. However, the two methods have been developed independently and hence have different designs and analysis method. The experimental methodology is based on the concept of particle detachment by the momentum of the particles on the deceleration of the substrate. A model of adhesion is required to estimate the specific adhesive energy between the particles and the surface, and in this work the analysis of JKR is used. The detachment force is estimated by Newton's second law of motion, using an estimated particle mass, based on its size,
a
b
[image:3.595.143.463.55.372.2]c
d
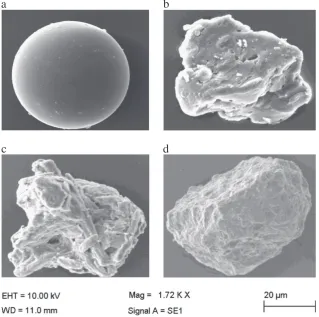
Fig. 1.Sample materials (a) silanised glass beads, (b) starch, (c) Avicel, and (d)α-lactose monohydrate.
Table 1
Volumetric size distribution of tested materials using laser diffraction method.
Sample d10(μm) d50(μm) d90(μm)
Glass beads 60 91 120
Starch 52 82 121
Avicel 45 79 138
Lactohale 100 55 28 207
Lactohale 200 10 74 140
[image:3.595.42.293.674.744.2]density and calculated estimate of particle acceleration. The observation of whether a particle detached or not is done by microscopy and image analysis of the samples before and after impact.
2. Experimental setup & methodology
In this study, spherical glass beads are used as a model material to enable the comparison of the measurement with established techniques. A number of irregular shape pharmaceutical excipients (Avicel,α-lactose monohydrate, and starch) in the size range of 20–125μm have also been used.Fig. 1shows scanning electron micrographs of the test materials. The volumetric size distributions of the sample materials tested in this
study were measured by Malvern Mastersizer 2000 using wet dispersion, and are shown inTable 1.
Glass beads were made cohesive by applying a commercially available silane coating, known as Sigmacote® supplied by Sigma-Aldrich®. Sigmacote has the chemical 1,7-dichloro-1,1,3,3,5,5,7,7-octamethyltetrasiloxane with heptane. The sample particles were then dispersed on a silanised glass slide of 7 mm diameter shown inFig. 2(a). The glass slide was glued to an aluminium stub. The dispersion was carried out in the dispersion unit of the Malvern Morphologi G3® and particles on the substrate can be scanned with the Malvern G3, before the test and after the test. The sample quantity, the dispersion pressure and the injection time are set to ensure uniform dispersion and to avoid agglomeration on the slide.
After the test
100 µm [image:4.595.87.497.55.324.2]a
b
Fig. 2.(a) Particle dispersion on a 7 mm glass slide (light spots are due to the super-glue, which was used to attach glass slide with aluminium stub) and (b) Malvern G3 image analysis before and after the test.
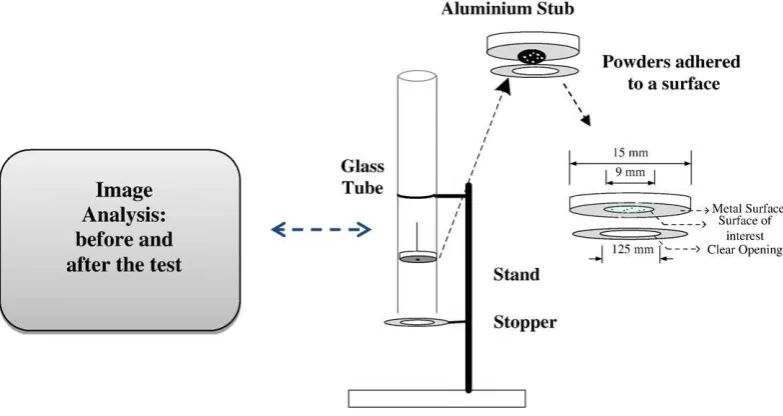
[image:4.595.97.489.519.727.2]The experimental setup of the drop test method is shown inFig. 3. After particle dispersion on the glass slide, the images of particles are recorded and then the particles are subjected to the test by dropping the aluminium stub from different heights inside a glass tube. The stub accelerates and impacts against a stopper. On impact, the particles experience a tensile force, which may cause detachment depending on the balance between the tensile force and the adhesion. The process of impact and rebound of the metal stub with the stopper is recorded using a high speed video camera (Photron Fastcam SA5) which has a feature of providing resolution of up to one million frames per second, in order to calculate the impact velocity of the stub and the contact time between the stub and stopper.
The JKR theory[15]and Newton's second law of motion are used to calculate the adhesion and detachment forces. According to the JKR theory, the adhesion force (pull off force) between two bodies is obtained from Eq.(1),
Fad¼
3
2πRΓ ð1Þ
whereFadis the JKR adhesive force,Γis the interface energy andRis the
reduced particle radius. The detachment force of a particle due to the momentum is obtained by,
Fdet¼
mΔv
Δt ð2Þ
whereFdetis the detachment force,mis the mass of the particle,∆tis half
of the contact time between the stub and stopper andvis the impact velocity. The impact causes the stub to decelerate, developing a tensile force between the particle and surface before rebounding. Two images recorded by the high speed camera at 75,000 frames per second are shown inFig. 4.
IfFdetis greater thanFadthen particles will be detached from the
glass surface, whereas they will remain attached ifFdetis less thanFad.
Therefore, a critical particle size exists above which the particles are
detached and below which they remain attached for a given impact velocity. This is illustrated schematically as an example inFig. 5showing a number of particles before impact inFig. 5(a), and those that remain after impact inFig. 5(b).
Particles 3 and 5 are not detached as in their caseFadNFdet. In practice
this is identified for many particles using microscope before and after the drop test and automatic image analysis. In order to obtain the mass of the particle for Eq.(2), the critical size that results in detachment is taken to be the average of the smallest particle amongst all the detached particles and the largest particle amongst all the particles which have not been detached, see particle (1) inFig. 5(a) and particle (5) inFig. 5(b), respec-tively as illustrative example. This may be simply taken as the arithmetic number mean or arithmetic volume mean. As the critical particle size is very narrow, the difference in the critical diameter between the two techniques is very narrow.
Critical diameter¼Particle diameter 1ð Þ þParticle diameter 5ð Þ
2 ð3Þ
The calculation of particle mass is based on the projected area diame-ter of the particle and the envelop density. The drop test technique is dependent on pre-test and post-test image analyses of the sample for the evaluation of the critical diameter. In this work, the Malvern Morphologi G3 was used. The instrument provides detailed information about the projected particle shape and various sizes, from which the projected area equivalent circle diameter (CE) is determined.
The interface energy can then be estimated from Eq.(4), where the detachment force is equated to the adhesion force.
Fdet
Fad
¼ mv
Δt
=3
[image:5.595.147.463.53.193.2]2πRΓ¼1: ð4Þ
Fig. 4.High speed video records of stub movement and impact.
b
a
1
2
4 3 5
6
[image:5.595.315.554.531.717.2]3 5
Fig. 5.Example of particle detachment (a) before the test and (b) after the test.
0 5 10 15 20 25 30 35
5 days 20 days 30 days 45 days 60 days
Interface energy (mJ/m
2)
Time elapsed
[image:5.595.55.280.612.726.2]The critical size depends obviously on the impact velocity, so it will change with different heights of fall, but it is expected that for a given material, unique specific interface energy is obtained.
3. Results and discussion
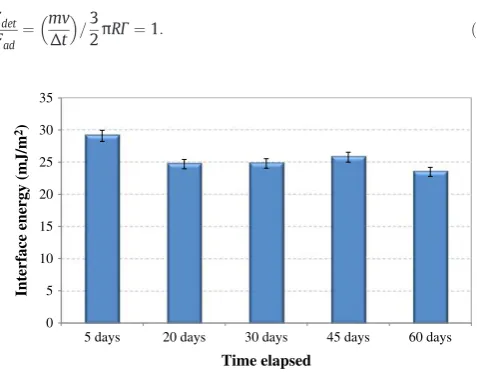
The experimental tests were carried out under ambient conditions of 20–25 °C temperature and the relative humidity of 45–60%. Initially the effect of ageing of the coating on particle adhesion was investigated in the case of silanised glass beads that had been coated and stored for 5, 20, 30, 45 and 60 days. The results are shown inFig. 6. Ageing of the coating (alkoxy functional group) does not have a significant effect on particle adhesion. It means that the process of degradation of the silane coat under normal storage condition is very slow. Hence within the period of experimental work which usually takes less than a day, these should not be any notable change in the interface energy.
Experiments were then carried out on silanised glass beads using different tube heights in order to change the impact velocity (Fig. 7). The critical particle sizes detached at different impact velocities are given inTable 2. It can be seen that with the increase of impact velocity, the critical size of detached particles decreases. A similar trend has been observed by Salazar-Banda et al.[5]. They investigated the magnitude of force needed to detach particles from surfaces, using the centrifugal method and found that the ratio of van der Waals to gravitational forces was higher in the case of smaller size particles as expected.
The interface energy of the silanised glass beads was calculated using Eq.(4), and the values for different impact velocities are shown inFig. 8. The interface energy is within a narrow range, particularly for small tube (thefirst three data points). Switching to the taller tube giving velocities above 4 m/s causes the spreading of the data, but nevertheless the range of interface energy remains narrow at 24–30 mJ/m2 for different impact velocities tested.
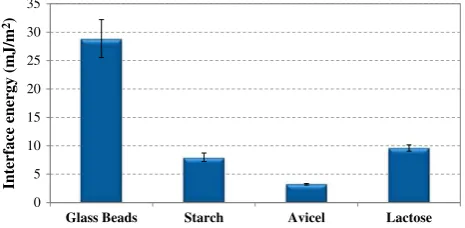
Similar tests were carried out for the other test materials, i.e. Avicel, lactose and starch and the results are shown inFig. 9, together with those of silanised glass ballotini for comparison. The tests here relate to a drop height of 0.45 m (impact velocity of 3.1 m/s). For each test material,five tests were carried out. The minimum and maximum interface energy values for each material are indicated by the error bars. A remarkably good repeatability can be seen for all sample materials. Particularly low values of the interface energy estimated for
Avicel, lactose and starch are mainly due to the irregular particle shape, for which contact between the two bodies is through asperities. This leads to an overestimation of the of the contact area, and thus are under estimation of the adhesion energy, as the contact is actually through the surface protuberances. The contact area calculation is based on the adhesive contact of a sphere having a diameter equivalent to the projected area diameter of the particle; hence the interface energy is underestimated and should be regarded as‘apparent interface energy’. Nevertheless, despite the irregular shape a remarkably narrow spread in the interface energy is obtained, presumably because the data are based on the detachment behaviour of many particles.
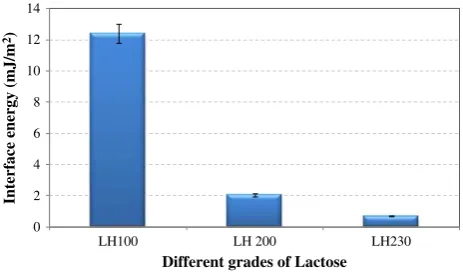
To observe the effect of particle size on the interface energy, the work was extended to different grades ofα-lactose monohydrate (Lactohale 100, Lactohale 200 and Lactohale 230) supplied by DMV-Fonterra®. These particles are manufactured in different size ranges with d50of 128μm, 74μm and 8.2μm, respectively, determined by
laser diffraction on a volumetric basis using Malvern Mastersizer 2000. Lactohale 100 (LH 100) is crystallineα-lactose monohydrate prepared by sieving, whereas Lactohale 200 (LH 200) is produced by gentle milling of crystallineα-lactose monohydrate and blended withfine
α-lactose monohydrate powder resulting in irregular shaped particles. Lactohale 230 (LH 230) is veryfine and produced by micronisation of
α-lactose monohydrate usingfluid energy milling. In these experiments the lactose samples were spread on aluminium stubs using the disper-sion unit of Malvern G3 and then subjected to impact testing. The results are shown inFig. 10. Surprisingly the interface energy decreases with the decrease in size of the lactose particles. This behaviour may be due to different manufacturing techniques which give rise to different surfaces and require further investigation. This can give a significant change of van der Waals forces of attraction between the surface and the attached particles. In fact it is well-known that crystalline
α-lactose monohydrate has some high energy spots on its surfaces and to reduce this somefine lactose powders are added in dry powder inhalation formulations[19]. Similar trend was observed by Pilcer et al.[20]who also investigated the characteristics of lactose.
Impact velocity (m/s)
[image:6.595.44.277.53.201.2]Fig. 7.Change of critical diameter with impact velocity of silanised glass beads in contact with silanised glass slide.
Table 2
Critical size as a function of impact velocity for silanised glass beads adhering to silanised glass surface.
[image:6.595.312.544.54.175.2]Impact velocity m/s 1.8 2.3 3.0 4.1 4.8 5.4 6.0 Critical diameter (μm) 66.4 63.8 59.8 53 47.5 42.3 37.3 Detachment force (μN) 3.81 4.3 3.6 3.9 3.5 3.0 2.7
Fig. 8.Interface energy of silanised glass beads in contact with silanised glass slide for dif-ferent impact velocities resulting from the use of difdif-ferent tube heights.
0 5 10 15 20 25 30 35
Glass Beads Starch Avicel Lactose
Inte
rface energy
(m
J/m
2)
[image:6.595.312.545.604.718.2]4. Conclusions
The drop test method has been used successfully to measure the interface energy between particles and a surface based on a balance between adhesive and tensile forces. The test particles used were glass beads made cohesive by the silanisation process, starch, Avicel and several grades ofα-lactose monohydrate. It was found that the silane coat on the glass surface did not age much and that interface energy remained constant for the entire test period of 60 days. Increasing the impact velocity causesfiner particles to detach, but the interface energy shows negligible variation with the impact velocity, as intrusively expected. This indirectly confirms the robustness of the method. The specific adhesion energy of silanised glass beads in contact with aflat silanised glass surface (interface energy) was measured to be about 25 mJ/m−2. The variations of particle morphology and surface
character-istics have a significant effect on the adhesion force, as indicated by differ-ences in the interface energy various grades ofα-lactose monohydrate. Thus, the drop test method is a suitable cheap and easy technique for measuring particle adhesion.
References
[1] H. Krupp, Particle adhesion theory and experiment, Adv. Colloid Interf. Sci. 1 (1967) 211–239.
[2] J. Tomas, S. Kleinschmidt, Improvement offlowability offine cohesive powders by
flow additives, Chem. Eng. Technol. 32 (2009) 1470–1483.
[3] H.J. Butt, M. Kappl, Normal capillary forces, Adv. Colloid Interf. Sci. 146 (1–2) (2009) 48–60.
[4] K.L. Mittal, L.P. Demejo, Fundamental of Adhesion and Interfaces, VSP Press, 1995. 95–108.
[5] G.R. Salazar-Banda, J.A. Gonclaves, M.L. Aguiar, Determination of the adhesion force between particles and aflat surface, using the centrifuge technique, Powder Technol. 173 (2007) 107–117.
[6] M. Takeuchi, Adhesion forces of charged particles, Chem. Eng. Sci. 61 (2005) 2279–2289.
[7] S. Nimisha, H. Kimberly, Effect of relative particle size on large particle detachment from a microchannel, Microfluid. Nanofluid. 6 (2009) 521–527.
[8] S. Otles, A. Chamayou, L. Galet, O. Lecoq, J. Dodds, Adhesive forces and surface modification in dry particle coating, Proc: Particulate Systems Analysis, 2008. (Warwickshire, UK.).
[9] S. Hu, H.T. Kim, A.A. Bunsanina, Effect of different deposition mediums on the adhesion and removal of particles, J. Electrochem. Soc. 157 (6) (2010) H662–H665.
[10] D.E. Packham, Surface energy, surface topography and adhesion, Int. J. Adhes. (2003) 23–37.
[11] F.J. LaMarche, T. Muzzio, Y. Shinbrot, J.G. Benjamin, Granular flow and dielectrophoresis: the effect of electrostatic forces on adhesion andflow of dielectric granular materials, Powder Technol. 199 (2010) 180–188.
[12] S. Ripperger, K. Hein, Measurement of adhesion forces in air with the vibration method, China Particuology 3 (1–2) (2005) 3–9.
[13]A. Saeedi, S. Azizi, C. Cetinkaya, Nonlinear dynamics of adhesive micro-spherical particles on vibrating substrates, J. Adhes. Sci. Technol. 27 (15) (2012) 1712–1726.
[14] S. Wanka, M. Kappl, M. Wolkenhauer, H.-J. Butt, Measuring adhesion forces in powder collectives by inertial detachment, Langmuir 29 (52) (2013) 16075–16083.
[15] K. Johnson, A. Kendall, Surface energy and the contact of elastic solids, Proc. R. Soc. Lond. Series A, Math. Phys. Sci. 324 (1971) 301–313.
[16] V.B. Derjaguin, V.M. Muller, P.U. Toporov, Effect of contact deformations on the adhesion of particles, J. Colloid Interface Sci. 53 (1975) 314–326.
[17] Guanqing Liu, Shuiqing Li, Qiang Yao, A JKR-based dynamic model for the impact of micro-particle with aflat surface, Powder Technol. 207 (2011) 215–223.
[18] E. Ermis, R.J. Farnish, R.J. Berry, M.S.A. Bradley, Direct measurement of powderflavor adhesion onto crisp surface using a novel adhesion tester, Part. Sci. Tech-nol. 27 (2009) 362–372.
[19]R. Price, P.M. Young, S. Edge, J.N. Staniforth, The influence of relative humidity on particulate interactions in carrier-based dry powder inhaler formulations, Int. J. Pharm. 246 (2002) 47–59.
[20] G. Pilcer, N. Wauthoz, K. Amighi, Lactose characteristics and the generation of aerosol, Adv. Drug Deliv. Rev. (2011) 116–137.
0 2 4 6 8 10 12 14
LH100 LH 200 LH230
Interface energy (mJ/m
2)
[image:7.595.53.285.52.188.2]Different grades of Lactose