Modeling and Design for Future
Wireless Cellular Networks:
Coverage, Rate, and Security
He Wang
B.E. (Beijing Jiaotong University, Beijing)
M.E. (Beijing Univ. of Posts and Telecomm., Beijing)
July 2013
A Thesis Submitted for the Degree of Doctor of Philosophy
of The Australian National University
Research School of Engineering
Declaration
The contents of this thesis are the results of original research and have not been submitted for a higher degree to any other university or institution.
Much of the work in this thesis has been published or has been submitted for publication as journal papers or conference proceedings.
The research work presented in this thesis has been performed jointly with Dr. Mark C. Reed (UNSW Canberra and The Australian National University), Dr. Xiangyun Zhou (The Australian National University), and Dr. Ming Zhao (Aus-tralian Communication and Media Authority). The substantial majority of this work was my own.
Acknowledgements
This thesis and the work it embodies would not have been possible without the continual support of a number of individuals and organizations. I would like to take this opportunity to express my gratitude to everyone who has contributed to the production of this thesis.
I want to gratefully acknowledge and express my sincere thanks to my super-visors and friends, Dr. Mark C. Reed, Dr. Xiangyun (Sean) Zhou, and Dr. Leif Hanlen, for their invaluable support, guidance, and encouragement throughout my PhD studies. They are always willing to give very generously their time for my research - their doors were always open. Their wisdom, academic insight, sharp focus, and on-going belief were constant sources of motivation for me to achieve the outcome included in this thesis. I am truly privileged to have had them as mentors.
I would like to thank Prof. John M. Cioffi from Stanford University and Prof. Jeffrey G. Andrews from the University of Texas at Austin for kindly welcoming me to visit their research groups. The discussions with John and Jeffrey stimulated many interesting ideas in my research area of wireless networks.
I must give my thanks to Dr. Ming Zhao (Australian Communications and Media Authority), Dr. Zhenning Shi (National ICT Australia), and Dr. Bathiya Senanayake (The Australian National University) for their collaboration on some of the work produced during my PhD study. The discussions with Dr. Parastoo Sadeghi (The Australian National University), Dr. David Smith (National ICT Australia), and Dr. Wayes Tushar (The Australian National University) also inspired me.
Thanks must go to The Australian National University and National ICT Australia (NICTA) for providing the PhD scholarship, along with a wealth of other support. Special thanks to Mark for his help in arranging my scholar-ship. I would also like to thank Australian Research Council Communications
Research Network (ACoRN) Travel Grant, ANU Vice-Chancellor Travel Grant, and NICTA Networks Research Group for supporting my conference attendances and university visits.
It is my great pleasure to carry out my post-graduate study and research in Canberra Research Laboratory (CRL) at NICTA and Applied Signal Process-ing (ASP) group at Research School of EngineerProcess-ing, The Australian National University. I would like to thank everyone for making them friendly and desir-able environments for research and study. Special thanks should be given to Ms. Elspeth Davies, the department administrator for all her assistance.
Abstract
Accompanied by the wide penetration of smartphones and other personal mobile devices in recent years, the foremost demand for cellular communications has been transformed from offering subscribers a way to communicate through low data rate voice call connections initially, into providing connectivity with good coverage, high data rate, as well as strong security for sensitive data transmission.
To satisfy the demands for improved coverage and data rate, the cellular network is undergoing a significant transition from conventional macrocell-only deployment to heterogeneous network (HetNet), in which a multitude of radio ac-cess technologies can be co-deployed intelligently and flexibly. However, the small cells newly introduced in HetNet, such as picocells and femtocells, have compli-cated the network topology and the interference environment, thus presenting new challenges in network modeling and design.
In recent studies, performance analyses were carried out accurately and tracta-bly with the help of Poisson point process (PPP)-based base station (BS) model. This PPP-based model is extended in this work with the impact of directional antennas taken into account. The significance of this extension is emphasized by the wide usage of directional antennas in sectorized macrocell cells. Moreover, studies showed that little coverage improvement can be achieved if small cells are randomly deployed in a uniform-distributed way. This fact inspires us to explore the effect of the non-uniform BS deployment. We propose a non-uniform femtocell deployment scheme, in which femtocell BSs are not utilized if they are located close to any macrocell BSs. Based upon our analytical framework, this scheme can provide remarkable improvements on both coverage and data rate, thus stressing the importance of selectively deploying femtocell BSs by consider-ing their relative locations with macrocell BSs.
To alleviate the severe interference problem, the uplink attenuation technique is frequently employed in femtocell receivers to reduce the impact of interference
from unattached terminals such that femtocell communication can take place. In order to analyze and optimize the femtocell system performance with this technique, we propose an analytical framework and demonstrate the performance tradeoff resulted from higher and lower uplink attenuation levels. Furthermore, we provide two improved uplink attenuation algorithms, which adaptively adjust to the information of the scheduled traffic, data rate requirement, and interference condition.
List of Publication
Journal Articles
J1. He Wang, Xiangyun Zhou, and Mark C. Reed, “Physical layer security in cel-lular networks: A stochastic geometry approach”,IEEE Trans. on Wireless Commun., vol. 12, no. 6, pp. 2776-2787, Jun. 2013.
J2. He Wang, Xiangyun Zhou, and Mark C. Reed, “Coverage and Throughput Analysis with a Non-uniform Femtocell Deployment”, submitted to IEEE Transactions on Wireless Communications.
Conference Papers
C1. He Wang, Ming Zhao, and Mark C. Reed, “Outage analysis for WCDMA
femtocell with uplink attenuation”, in Proc. IEEE 1st Int’l Workshop on Femtocell Networks (GLOBECOM’10 Wkshps), Miami, USA, Dec. 2010, pp. 664-668.
C2. He Wang, Ming Zhao, and Mark C. Reed, “Optimal adaptive uplink attenu-ation algorithms for WCDMA femtocell”, in Proc. IEEE Global Commun. Conf. (GLOBECOM’11), Houston, USA, Dec. 2011, pp. 1-5.
C3. He Wang and Mark C. Reed, “A novel tractable framework to analyse het-erogeneous cellular networks”, in Proc. 6th IEEE Int’l Workshop on Het-erogeneous, Multi-Hop, Wireless, and Mobile Networks (GLOBECOM’11 Wkshps), Houston, USA, Dec. 2011, pp. 287-292.
Theory Workshop (AusCTW’12), Wellington, New Zealand, Jan./Feb. 2012, pp. 61-65.
C5. He Wang, Xiangyun Zhou, and Mark C. Reed, “On the physical layer securi-ty in large scale cellular networks”’, inProc. 2013 IEEE Wireless Commun. and Networking Conf. (WCNC’13), Shanghai, China, Apr. 2013, pp. 2503-2508.
C6. He Wang, Xiangyun Zhou, and Mark C. Reed, “Analytical evaluation of coverage-oriented femtocell network deployment”, inProc. IEEE Int’l Conf. on Commun. (ICC’13), Budapest, Hungary, June 2013, pp. 4567-4572.
The following publications are also the results from my Ph.D. study but not included in this thesis:
C7. Zhenning Shi, Ming Zhao, Mark C. Reed, and He Wang, “Uplink interference scenarios in two-tier networks”, in Proc. 44th Annual Asilomar Conf. on Signals, Systems, and Computers (Asilomar’10), Pacific Grove, USA, Nov. 2010, pp. 1-5.
C8. Zhenning Shi, He Wang, Ming Zhao, and Mark C. Reed, “An uplink analyt-ical model for two-tiered 3G femtocell networks”, in Proc. 8th Int’l Symp. on Modeling and Optimization in Mobile, Ad Hoc, and Wireless Networks (WiOpt’10), Avignon, France, May. 2010, pp. 367-372.
C9. Zhenning Shi, Ming Zhao, Mark C. Reed, and He Wang, “On the uplink coverage and capacity of UMTS femtocells in enterprise environment”, in
Proc. 2nd Int’l Workshop on Femtocells (CWiND’10), Luton, UK, Jun. 2010, pp. 1-3.
Acronyms
3GPP Third Generation Partner Project
ABSF almost blank subframe
ADC analog-to-digital convertor
AULA adaptive uplink attenuation algorithm
BS base station
CCDF complementary cumulative distribution function
CDF cumulative distribution function
CDMA code-division multiple access
CoMP coordinated multipoint
CPICH common pilot channel
CSG closed subscriber group
DAS distributed antenna system
DSL digital subscriber line
eICIC enhanced inter-cell interference coordination
FAP femtocell access point
FER frame error rate
HNB home NodeB
HetNet heterogeneous network
HSPA High Speed Packet Access
IEEE Institute of Electrical and Electronics Engineers
ITU International Telecommunication Union
LLN law of large numbers
LTE Long Term Evolution
MAC medium access control
OFDM orthogonal frequency-division multiplexing
PDF probability density function
PGFL probability generating functional
PMF probability mass function
PPP Poisson point process
QoS quality of service
RAT radio access technology
RRH remote radio head
SINR signal-to-interference-and-noise ratio
SNR signal-to-noise ratio
SON self-organizing network
WCDMA Wideband CDMA
WiMAX Worldwide Interoperability for Microwave Access
Notation
≈ approximately equal to
, defined as equal to (a,b:a is defined as b)
∗ convolution operator
arg maxxf(x) value ofx that maximizes the function f(x)
arg minxf(x) value ofx that minimizes the function f(x)
kxk absolute value (amplitude) ofx
∠x argument ofx
xdB value ofx expressed in decibel unit
logx(y) the log, basex, of y
γ Euler-Mascheroni constant
R field of all real numbers
α path loss exponent
L0 path loss constant at the reference distance r0 = 1m
b, q constants to approximate the distribution of Voronoi cell area
1(A) indicator function, equal to 1 if EventAis true and 0 otherwise
Γ(x) Gamma function
E1(x) exponential integral
LX(x) Laplace transform of random variableX
Q(x) Gaussian Q-function
fX(x) probability density function of random variable X
FX(x) cumulative distribution function of random variable X
¯
FX(x) complementary cumulative distribution function of random
variable X
P[A] probability of event A
E[·] expectation operator
EX[·] expectation operator over random variable X
E[· | ·] conditional expectation operator
X ∼pX random variable X with distribution pX
X ∼exp(µ) exponential distributed random variableX with mean valueµ
N(µ, σ2) normal distribution with mean µand variance σ2
{x:C} set containing all x that satisfy condition C B(p, r) closed ball centered at p and of radius r
A(X) area measure of the region X
Λ(X) a point process’s intensity measure for the region X
C0(λ) area measure of a randomly chosen Voronoi cell formed by a
homogeneous PPP with the density λ
Prx(x, y) received power at the receiver at the location of x, from the
Contents
Declaration iii
Acknowledgements v
Abstract vii
List of Publication ix
Acronyms xi
Notation xiii
List of Figures xxiii
List of Tables xxv
1 Introduction 1
1.1 HetNets: The Solution for Coverage and Rate . . . 1
1.1.1 Homogeneous Macrocell-Only Networks . . . 2
1.1.2 Heterogeneous Networks . . . 3
1.1.3 Technical Challenges of HetNet Deployment . . . 7
1.2 Security Enhancement in Future Cellular Networks . . . 14
1.2.1 Physical Layer Security . . . 15
1.3 Modeling of Cellular Networks . . . 16
1.3.1 Grid Model and System-Level Simulation . . . 16
1.3.2 Wyner Model . . . 17
1.3.3 Stochastic Geometry Model . . . 17
1.4 Thesis Outline and Contributions . . . 19
2 Tractable Model for HetNets with Directional Antennas 27
2.1 Introduction . . . 27
2.2 The PPP-based HetNet Model and Coverage Performance . . . . 28
2.2.1 Cell Association Model . . . 29
2.2.2 Tractable Framework on Coverage Probability . . . 30
2.3 Extended Model with Directional Antennas . . . 35
2.3.1 Cell Association Model . . . 36
2.4 Analysis on the Impact of Directional Antenna . . . 36
2.4.1 Maximum Long-Term Received Power . . . 37
2.4.2 Coverage Probability . . . 37
2.5 Numerical Results . . . 39
2.6 Summary of Contributions . . . 44
3 Analytical Evaluation of a Non-uniform Femtocell Deployment 47 3.1 Introduction . . . 47
3.2 Non-uniform Femtocell Deployment . . . 48
3.3 System Model . . . 49
3.3.1 Two-Tier Cellular Network Model . . . 49
3.3.2 Cell Association and Resource Allocation Model . . . 51
3.3.3 Received SINR for Data Channels . . . 51
3.3.4 Analysis on Uniform Femtocell Deployment . . . 52
3.4 Analysis on Non-uniform Femtocell Deployment . . . 55
3.4.1 Inner and Outer Regions . . . 55
3.4.2 The Distribution of the Distance from Serving BS . . . 56
3.4.3 The Density of Loaded BSs . . . 58
3.4.4 Coverage Probability . . . 60
3.4.5 Single User Throughput . . . 62
3.5 Numerical Results . . . 63
3.5.1 Coverage Performance . . . 64
3.5.2 Throughput Performance . . . 67
3.6 Summary of Contributions . . . 69
4 Analysis on Femtocell Uplink Attenuation Algorithms 73 4.1 Introduction . . . 73
4.2 System Model . . . 75
Contents xvii
4.2.2 Uplink Attenuation . . . 77
4.3 Analysis on Fixed Uplink Attenuation Performance . . . 80
4.3.1 Power Control and Uplink Attenuation Feasibility . . . 80
4.3.2 Probability to Reach Transmit Power Cap . . . 82
4.4 Adaptive Uplink Attenuation Algorithms . . . 86
4.4.1 Adaptive Uplink Attenuation Algorithm I (AULA-I) . . . 87
4.4.2 Adaptive Uplink Attenuation Algorithm II (AULA-II) . . 88
4.5 Numerical Results . . . 89
4.5.1 Fixed Uplink Attenuation Performance . . . 89
4.5.2 Adaptive Uplink Attenuation Performance . . . 91
4.6 Summary of Contributions . . . 94
5 Physical Layer Security in Large-Scale Cellular Networks 99 5.1 Introduction . . . 99
5.2 System Model . . . 102
5.2.1 Signal Propagation Model . . . 102
5.2.2 Achievable Secrecy Rate . . . 102
5.3 Secrecy Performance Analysis . . . 105
5.3.1 Scenario-I: Full Location Information; Nearest BS to Serve 106 5.3.2 Scenario-II: Full Location Information; Optimal BS to Serve 107 5.3.3 Scenario-III: Limited Location Information; Nearest BS to Serve . . . 112
5.4 Numerical Results . . . 116
5.4.1 Numerical Results of Scenario-I . . . 116
5.4.2 Numerical Results of Scenario-II . . . 117
5.4.3 Numerical Results of Scenario-III . . . 119
5.5 Summary of Contributions . . . 123
6 Conclusions and Future Research Directions 127 6.1 Conclusions . . . 127
6.2 Future Research Directions . . . 129
A Appendix A 131 A.1 Proof of Lemma 2.1 . . . 131
B Appendix B 135
B.1 Proof of Lemma 3.2 . . . 135
B.2 Proof of Lemma 3.3 . . . 136
B.3 Proof of Lemma 3.6 . . . 138
B.4 Proof of Theorem 3.7 . . . 139
B.5 Proof of Theorem 3.8 . . . 140
B.6 Proof of Theorem 3.10 . . . 142
B.7 Proof of Theorem 3.11 . . . 143
C Appendix C 145 C.1 Proof of Theorem 5.1 . . . 145
C.2 Proof of Theorem 5.3 . . . 146
C.3 Proof of Corollary 5.5 . . . 147
C.4 Proof of Theorem 5.6 . . . 148
C.5 Proof of Theorem 5.8 . . . 149
C.6 Proof of Corollary 5.9 . . . 150
List of Figures
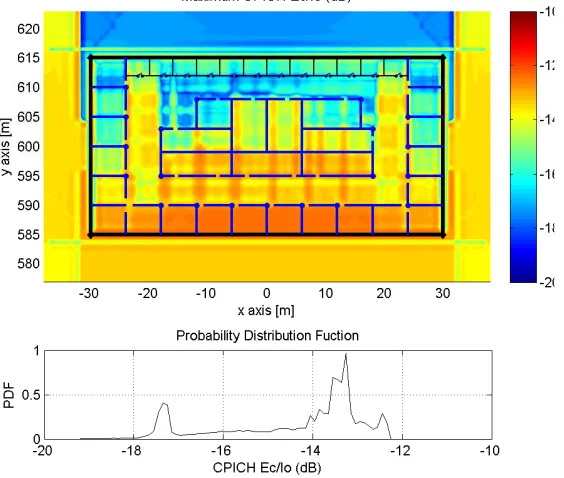
1.1 Illustration of a cellular network consisting of macrocell, picocell, femtocell BSs, and relay nodes. This evolved network topology is referred to as the heterogeneous network. . . 4 1.2 Illustration of cellular coverage for an enterprise scenario, without
or with 4 HSPA-based femtocell BSs deployed indoor. The heat maps and PDFs of maximum pilot channel (CPICH) Ec/Io are
demonstrated. . . 8
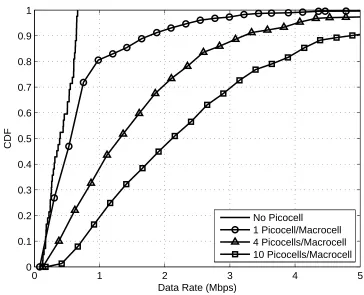
1.3 Illustration of the improvement on single user data rate by of-floading users to picocells. The CDF curves are demonstrated for different scenarios, where 1, 4, and 10 HSPA-based picocells are deployed in the region originally covered by one macrocell. . . 9
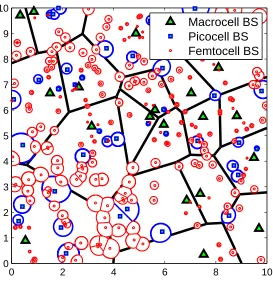
2.1 Cell association regions in a three-tier cellular network (macrocell, picocell and femtocell tiers), with density ratio λ3 = 4λ2 = 20λ1.
Transmit power levels have the relationship of P1,tx/P2,tx = 11dB
and P1,tx/P3,tx = 26dB. . . 30
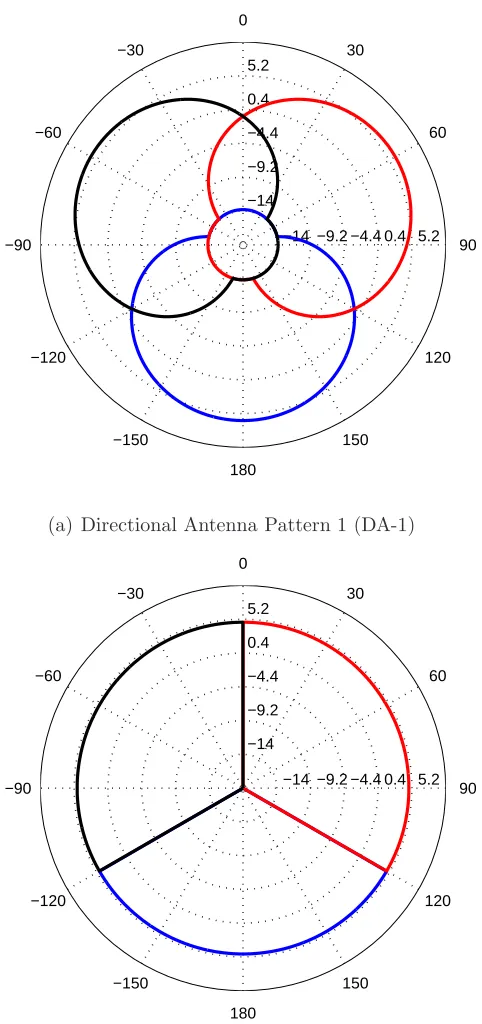
2.2 Illustration of Directional antenna patterns for DA-1 and DA-2, in which different colors represent the gain patterns in decibel unit for different sectors. . . 41
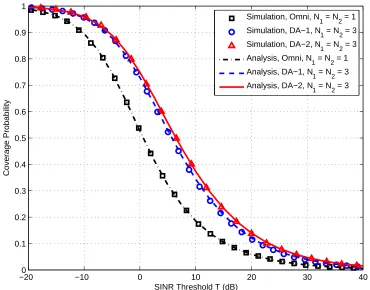
2.3 Probability of coverage for a two-tier HetNet with frequency reuse factors of both tiers equal to 1 and 3. For frequency reuse scenario with N1 = N2 = 3, macrocell BSs are equipped with DA-1 or
DA-2 directional antennas; for the scenario frequency reuse factor
N1 = N2 = 1, macrocell BSs are equipped with omni-directional
antennas. For both scenarios, femtocell BSs with omni-directional antennas (PTX,2 = 20 dBm) are co-deployed with the density of
λ2 = 10. . . 43
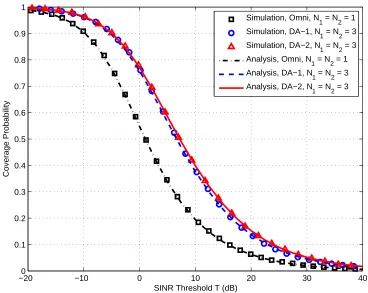
2.4 Probability of coverage for a two-tier HetNet with frequency reuse factors of both tiers equal to 1 and 3. For frequency reuse scenario with N1 = N2 = 3, macrocell BSs are equipped with DA-1 or
DA-2 directional antennas; for the scenario frequency reuse factor
N1 = N2 = 1, macrocell BSs are equipped with omni-directional
antennas. For both scenarios, picocell BSs with omni-directional antennas (PTX,2 = 30 dBm) are co-deployed with the density of
λ2 = 10. . . 44
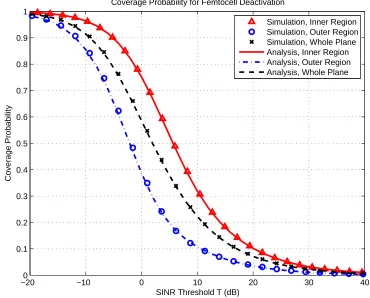
3.1 Illustration of cell association regions for a two-tier network with femtocell deactivation and smart femtocell deployment implement-ed, based on the cell association model provided in 2.2.1. Macro-cell BSs (triangles) and femtoMacro-cell BSs (squares) are randomly scat-tered. In the inner region (shadow areas), the deactivated femtocell BSs are marked as red-filled squares in Fig. 3.1(a), which are rein-stalled at the new locations in the outer region for the smart femto-cell deployment, and marked as blue-filled squares in Fig. 3.1(b). The remaining femtocell BSs are always active, and marked as blue non-filled squares. . . 50 3.2 Coverage probability (or equivalently, the CCDF of received SINR)
for femtocell deactivation, D= 500 m and λ2/λ1 = 10. . . 64
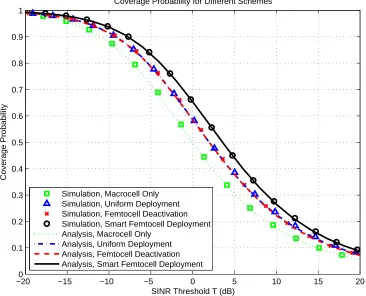
3.3 Coverage probability (or equivalently, the CCDF of received SINR) for different schemes, D= 500 m and λ2/λ1 = 10. . . 65
3.4 Coverage probability (or equivalently, the CCDF of received SINR) for different schemes, with the tier density ratio λ2/λ1 = 10. The
SINR thresholds are set to be T =−5 dB and T = 10 dB. . . 66 3.5 Coverage probability (or equivalently, the CCDF of received SINR)
for different schemes, with the tier density ratio λ2/λ1 = 5. The
SINR thresholds are set to be T =−5 dB and T = 10 dB. . . 67 3.6 Single user throughput distribution (CCDF curves) for inner and
outer regions, D= 500 m and λ2/λ1 = 10. . . 68
3.7 Single user throughput distribution (CCDF curves) for different schemes, D= 500 m andλ2/λ1 = 10. . . 69
3.8 P[R > ρ] over D for different schemes, with the tier density ratio
λ2/λ1 = 10. The rate thresholds are set to be ρ = 0.02 bps and
List of Figures xxi
3.9 P[R > ρ] over D for different schemes, with the tier density ratio
λ2/λ1 = 5. The rate thresholds are set to be ρ = 0.02 bps and
ρ= 1 bps. . . 71
4.1 The diagram of uplink attenuation for femtocell BS receiver. . . . 74
4.2 The probability of EventAoutversus the uplink attenuation factor
η, where the fixed level of uplink attenuation is applied and the interference level at the femtocell receiver is IdB =−75 dBm. . . . 91
4.3 The probability of EventBoutunder the condition that Event Aout
do not happen, i.e., P[Bout | Acout], versus the uplink attenuation
factor η, where the fixed level of uplink attenuation is applied and the interference level at the femtocell receiver is IdB =−75 dBm. 92
4.4 The overall outage probability versus the uplink attenuation factor
η, where the fixed level of uplink attenuation is applied and the interference level at the femtocell receiver is IdB =−75 dBm. . . . 93
4.5 The overall outage probability versus the uplink attenuation factor
η, where the fixed level of uplink attenuation is applied and the interference level at the femtocell receiver is IdB =−85 dBm. . . . 94
4.6 Simulation result for the empirical CDF of the adaptive uplink attenuation factor ηadaptive,dB in AULA-I, where the interference
level at the femtocell receiver isIdB =−75 dBm. . . 95
4.7 Simulation result for the outage probability versus the interference level at the femtocell receiver IdB, where the number of active
femtocell users isM = 2. . . 96
4.8 Simulation result for the outage probability versus the interference level at the femtocell receiver IdB, where the number of active
femtocell users isM = 3. . . 97
5.1 Illustration of PPP-distributed BSs’ cell boundaries. Each user is associated with the nearest BS, and BSs (represented by green squares) are distributed according to PPP. Dmin is defined as BS’s
5.2 Illustration of the relationship betweenP (the union of all points at which BS can provide the typical user a secrecy rate ˆRs>log2(β),
whereβ = 1.25, represented as the red region) andC (the Voronoi cell generated by the process Φe ∪ {0}), as defined in the proof
of Proposition 5.4. The typical user denoted by a star is located at the origin. A realization of eavesdroppers are scattered and denoted as circles. . . 109
5.3 An example where the BS providing maximum achievable secrecy rate is not the nearest BS. The typical user’s nearest BS is BS-A, which however cannot provide a positive secrecy rate due to its excellent link to the eavesdropper. BS-B, on the other hand, can provide a secrecy connection since there is no eavesdroppers nearby.112
5.4 The average secrecy rate achievable versus the eavesdropper densi-tyλe for Scenario-I (full location information; nearest BS to serve).
Simulation and analytical results are shown for different path loss exponents α. . . 117
5.5 The average secrecy rate achievable versus the eavesdropper densi-tyλe for Scenario-I (full location information; nearest BS to serve).
Simulation results are shown for different SNR. . . 118
5.6 The secure coverage probability versus the eavesdropper density
λe for Scenario-II (full location information; optimal BS to serve).
Simulation and analytical results are shown for different thresholds
R0 = 0 or 5 to claim outage. (It should be noticed that the
ap-proximation provided by Theorem 5.4 becomes the exact coverage probability for the special case of R0 = 0.) Path loss exponent is
α= 4. . . 119
5.7 The secure coverage probability versus the eavesdropper density
λe for Scenario-II (full location information; optimal BS to serve).
Simulation and analytical results are shown for different thresholds
R0 = 0 or 5 to claim outage. (It should be noticed that the
ap-proximation provided by Theorem 5.4 becomes the exact coverage probability for the special case of R0 = 0.) Path loss exponent is
List of Figures xxiii
5.8 The average secrecy rate achievable versus the eavesdropper den-sity λe for Scenario-II (full location information; optimal BS to
serve). Simulation and analytical results are shown for path loss exponent α= 4. . . 121 5.9 The average secrecy rate achievable versus the eavesdropper
den-sity λe for Scenario-II (full location information; optimal BS to
serve). Simulation and analytical results are shown for path loss exponent α= 2.5. . . 122 5.10 The average secrecy rate achievable versus the eavesdropper
densi-tyλefor Scenario-III(1) (no location information exchange; nearest
BS to serve). Simulation results and lower bounds are shown for different path loss exponents α. . . 123 5.11 The average secrecy rate achievable versus the detection radiusD0
for Scenario-III(2) (location information for users with distances less than D0; nearest BS to serve). Simulation and analytical
results are shown for different eavesdropper densities λe and path
loss exponent α= 4. . . 124 5.12 The average secrecy rate achievable versus the detection radiusD0
for Scenario-III(2) (location information for users with distances less than D0; nearest BS to serve). Simulation and analytical
results are shown for different eavesdropper densities λe and path
loss exponent α= 2.5. . . 125
List of Tables
1.1 Major characteristics of different BS in HetNet. . . 5
2.1 Directional antenna models for the macrocell tier . . . 40
4.1 Relationship between min
η {P[Aout]} and Event Cout. The
param-eter values for this example are W = 5 MHz, RoT∗
dB = 12 dB,
mγdB = 7 dB andσγdB = 2.5 dB. . . 85 4.2 System parameter values for numerical results . . . 90
Chapter 1
Introduction
During the past decades, we have witnessed the commercial success of mobile cellular communications in both developed and emerging markets. By providing reliable and inexpensive mobile voice services to a majority of the world’s popu-lation, the mobile cellular communications industry has become an indispensable part of our daily life. In recent years, the proliferation of media-hungry smart-phones and plethora of other Internet-connected mobile devices having powerful multimedia capabilities made the industry enter the mobile broadband era.
As the cellular technologies evolve, there are many metrics that should be optimized during the network design process. Among all these metrics, coverage, data rate, and security are highly concerned by the cellular service providers, thus becoming the central topics to be discussed in this thesis.
1.1
Heterogeneous Networks:
The Solution for Coverage and Rate
Providing satisfactory and ubiquitous cellular coverage has become a prerequisite for the success of a cellular communications networks. Although it can be an intimidating task to satisfy not only the outdoor mobile subscribers but also the indoor ones, reliable in-building coverage is widely regarded as a criterion to differentiate the service quality, especially considering the fact that most of voice and data services are initiated from indoor environments [1].
On the other hand, the increasing demand for mobile broadband data services presents new challenges for cellular service operators and the whole industry. As global mobile-broadband penetration is still substantially lower than the
tional cellular subscriptions reported by International Telecommunication Union (ITU) [2], a huge reserve of potential users are expected to embrace the mobile data services in the near future. Furthermore, the recent tremendous develop-ment of cloud-based applications is pushing the mobile data traffic requiredevelop-ment even higher [3]. Predicted by the industry report [4] updated by Cisco Systems this year, the global mobile data traffic will experience a 13-fold increase from 2012 to 2017. Similar growth is forecast in another independent report completed by Ericsson [5].
Nevertheless, the wireless link efficiency is approaching its fundamental lim-its. Over the last decade, new cellular standards including Third Generation Partnership Project (3GPP)-based High Speed Packet Access (HSPA) [6] and Long Term Evolution (LTE) [7, 8], and Institute of Electrical and Electronics Engineers (IEEE) 802.16-based Worldwide Interoperability for Microwave Ac-cess (WiMAX) [9] have been newly developed and deployed worldwide. These new technologies allow operators to efficiently exploit wider spectrums with high-er data rates and improved quality of ushigh-er exphigh-erience. Nevhigh-ertheless, radio link performance is fast approaching the theoretical limitation and from a pure link-budget viewpoint, a relatively high signal-to-noise ratio (SNR) is required to achieve the high data rates [10, 11], which is unavailable in most cases. On the other hand, spectrum available to operators has been, is, and will continue to be limited and expensive [12]. Considering this fact, extending the transmission bandwidth incrementally or even aggregating multiple component spectrums [13] are both unsustainable to meet this mobile data traffic explosion [14]. As the traffic volumes are likely to increase faster than the rise in spectral efficiency as well as the amount of spectrum being made available, the capacity and data rates offered by the existing network with enhanced radio access will no longer be sufficient [15]. There is a need for a new approach to improve the data rates and the approach of choice is by further reducing the cell size and thus enhancing spatial reuse of spectrum. Over the begone decades, it has been shown that it is the most effective manner to increase the area spectral efficiency, and provides a scalable solution to the forecasted mobile broadband demand in the future.
1.1.1
Homogeneous Macrocell-Only Networks
1.1 HetNets: The Solution for Coverage and Rate 3
system comprises a collection of user terminals and a network of high-power tower-mounted base stations (also called macrocell BSs) in a planned layout. In this planned layout, all the BSs have similar characteristics, such as similar transmit power levels, antenna configurations (numbers, heights, and antenna sectoriza-tion), receiver noise levels, and similar backhaul connectivity to the core network. Additionally, all BSs provide unrestricted access to all the mobile subscribers in the network with comparable quality of service (QoS), and every BS serves a similar number of user terminals. Through the macrocell-oriented planning and optimization, the locations of the BSs are carefully chosen, and the settings of BS parameters are further optimized to achieve the desirable performances, that is, the maximized cellular coverage and minimized interference between BSs [16]. To cope with the growth in traffic demand mentioned earlier, the system spectral efficiency can be further enhanced by the densification of the traditional macrocells, which can include the technique of cell splitting and sectorization [17]. In dense urban areas, the inter-site distance between two neighboring macrocell BSs can be down to 100-200 m, thus enhancing the spectral efficiency significantly [18]. Furthermore, increasing the density of BSs has proved to be the only scalable method to provide the necessary capacity [15, 19].
1.1.2
Heterogeneous Networks
Continuing on the trend of reducing the cell size to cope with the data throughput requirement, more BSs are required to achieving higher frequency reuse. How-ever, implementing more macrocell BSs sometimes involves the high capital and operating expense, and a lack of available sites in a practical deployment [11, 20]. Moreover, additional data traffic capacity is required in some particular scenar-ios, such as indoor/outdoor hot spot locations, and therefore the traffic demand is non-uniform over the whole deployment area [21]. All these factors combine to conclude that a more flexible deployment model is desired for operators to improve broadband user experience in a cost-effective manner [17].
Macro
Pico Femto
Pico Pico
Relay Femto
Femto
Figure 1.1: Illustration of a cellular network consisting of macrocell, picocell, femtocell BSs, and relay nodes. This evolved network topology is referred to as the heterogeneous network.
(RRHs) in distributed antenna systems (DASs) [1, 27]. As shown in Fig. 1.1, these techniques can be more scalable and economical to cater to the huge traffic demand forecasted and enable infrastructure resources to be located close to places with high coverage and data demands. Generally speaking, there are two major options to realize the heterogeneous cellular deployment: small cells co-channel deployed operators’ licensed spectrum and wireless local area network (WLAN) access points in unlicensed spectrum [28]. In this thesis, the focus is primarily on the co-channel option.
Accordingly, the networks become significantly more heterogeneous in terms of transmit powers (and thus coverage ranges), antenna configurations, supported frequency bands, transmission bandwidths, access control policies, communica-tion protocols, and backhaul connectivity. Taking transmit powers for instance, the macrocell BSs at high power level (around 46 dBm) are underlaid with other tiers, which are formed by picocell BSs, femtocell BSs, and relays transmitting at substantially lower power levels and contributing to completely diverse cellu-lar coverage. In our discussion, the term “tier” is used to describe the network comprising a single class of BSs. Currently, this more complex evolved network topology with diverse radio technologies and overlapping geographical coverage, also referred to as heterogeneous networks (HetNets), has attracted significant attention from both industrial and academic communities [14, 29–33].
under-1.1 HetNets: The Solution for Coverage and Rate 5
Table 1.1: Major characteristics of different BS in HetNet [1, 37].
Type Tx power Coverage Capacity Backhaul
Macrocell BS 46 dBm Few km <1000 users Dedicated wired
Picocell BS 23-30 dBm <300 m 10−50 users Dedicated wired
Femtocell BS 10-23 dBm <30 m <5 users Wired Internet access
Relay 23-30 dBm <300 m 10−50 users Wireless
RRH 46 dBm Few km <1000 users Optical fiber
neath macrocells were investigated analytically in [34]. Some of the most critical problems in HetNets were identified by Lagrange in his pioneering study [35], and the networks with multiple access techniques proved superior to macrocell-only networks in terms of system cost [36].
Different from the careful network planning for macrocell-only networks, the placement of small cell BSs may be more or less ad hoc, and even the operator-deployed picocell is only based upon a rudimental knowledge of coverage issues and data traffic distribution (e.g. hot spots) in the network. Because of their lower transmit power levels and smaller physical sizes, picocell, femtocell, and relay BSs can offer flexible site acquisitions [11]. Thanks to the advanced inter-ference management and self-organizing network (SON) techniques, the overall throughput provided by the HetNets can be increased as the number of deployed small cells grows [33].
The major characteristics of different BSs are summarized in Table 1.1 and detailed descriptions are provided as follow.
Picocell
can be released, which is beneficial to macrocell terminals as well.
Femtocell
Being an important part of HetNet, femtocell access point (FAP), otherwise called femtocell BS or home NodeBs (HNBs) in the 3GPP standard, is usually defined as a low-power device operating in the licensed spectrum [38, 39]. Backhauled onto the operator’s network via the wired Internet connection, such as digital subscriber line (DSL), cable broadband access, or fiber, femtocells are designed to provide voice and high data-rate sustained services for indoor environments, where a majority of user traffic comes from. As a result of off-loading indoor traffic from the macrocells to femtocells and employing smaller cell sizes, femtocells bring a multitude of benefits, including more efficient spatial reuse of spectrum, enhanced coverage and capacity for indoor applications, reduced capital costs and operational costs, better user experiences, and lower churn of subscribers [24,40]. Aiming to cover a range less 30 m, the femtocell BS is operated with a transmit power less than 23 dBm.
Relay
With the similar transmit power and coverage range as picocell, relay is gener-ally defined as operator-deployed access point that decodes the data sent from the donor BS or from the user terminal, re-encodes and forwards to the desti-nation. By boosting the signal strength and improving the cellular coverage for the existing networks, e.g., in cell edge areas, relays play an indispensable role in the future HetNet. As Relay is able to be installed where wired backhaul is unavailable, it is able to provide extra flexibility for cellular deployment [25, 26].
RRH
1.1 HetNets: The Solution for Coverage and Rate 7
In HetNet deployment, cellular networks are brought close to the end users to offer better coverage and data rate. Unlike the macrocell BSs, which frequently involve the high expenditure and long installation cycle, the small cells in HetNet can be intelligently utilized, depending on the coverage and rate demands.
For instance, multiple HSPA-based femtocell BSs can be deployed in an enter-prise deployment scenario, which significantly contributes to an improved indoor coverage, as illustrated in Fig. 1.2. Through a system-level simulation, we demon-strate the heat maps and probability density functions (PDFs) of the core metric for cellular coverage performance, that is, Ec/Io of the best pilot channel1 from
all candidate BSs, where Ec/Io is defined as the ratio between the bit energy of
the pilot channel and the density of total interference power [41]. The simulation is conducted under the conditions where no femtocell BS and 4 femtocell BSs with 20dBm transmit power are deployed for the particular indoor environment. On the other hand, offloading mobile users from heavily loaded macrocells (where most of their resources are occupied for users’ traffic demand) to other lightly loaded small cell infrastructures can be beneficial to the network per-formance. As demonstrated in the Fig. 1.3, different numbers of HSPA-based picocells are simulated to be co-channel deployed with a traditional macrocell network. We demonstrate the cumulative distribution functions (CDFs) of indi-vidual user’s data rate (averaging over macrocell- and picocell-connected users) for different conditions. It indicates that all the users, both served by macrocell and picocell BSs, benefit from the data-offloading from macrocells to picocells. Specifically, 70% of the users with 10 picocells deployed per macrocell, the data rate increases from less than 500 kbps to more than 3 Mbps, an increase of 6 times.
1.1.3
Technical Challenges of HetNet Deployment
In a typical HetNet topology, enhanced small cells should be able to be flexibly de-ployed with or without macrocell coverage, in outdoor and indoor environments, by using both ideal and non-ideal backhaul connections [42]. Consequently, the cellular network topology will be fundamentally changed and some long-standing modeling, design, and optimization principles well known in the macrocell-only age will need to be adjusted extensively. This in turn introduces new techni-cal challenges [20]. In this section, the most important aspects on the cellular
(a) Without Femtocell BS deployed indoor
[image:34.595.139.421.129.368.2](b) With 4 Femtocell BS deployed indoor
1.1 HetNets: The Solution for Coverage and Rate 9
0 1 2 3 4 5
0 0.1 0.2 0.3 0.4 0.5 0.6 0.7 0.8 0.9 1
Data Rate (Mbps)
CDF
No Picocell
[image:35.595.134.498.130.425.2]1 Picocell/Macrocell 4 Picocells/Macrocell 10 Picocells/Macrocell
Figure 1.3: Illustration of the improvement on single user data rate by offloading users to picocells. The CDF curves are demonstrated for different scenarios, where 1, 4, and 10 HSPA-based picocells are deployed in the region originally covered by one macrocell.
network theory and implementation will be presented.
The Impact of Cell Load
In traditional macrocell-only network, macrocell BSs generally cover relative-ly large regions and support a large number of users. Thanks to the law of large numbers (LLN), a strong correlation between downlink received signal-to-interference-plus-noise (SINR) and achieved data rate at each user can be observed [20]. Because of the presence of this correlation, the received SINR dis-tribution can be representative enough to characterize the achievable single user data throughput [43].
number of users), and the correlation between received SINR and achievable data rate becomes weak as LLN is not applicable any more: The data traffic through-put performance will significantly vary from lightly-loaded cells to heavily-loaded cells [20, 44, 45]. The impact of cell load should be taken into consideration when the analysis of HetNets is conducted [46].
Cell Association Policy
In a homogeneous macrocell-only network, mobile users are typically assumed to connect to the BSs with the strongest signal strength, that is, the BS provid-ing maximum long-term downlink received power, whereas the unwanted signals received from other BSs are treated as interference usually to be minimized ac-cordingly. However, to decide the cell association policy in a HetNet deployment, it is necessary to take into account the newly introduced factors, such as uplink-downlink imbalance, cell load disparity, and the femtocell user association settings such as closed subscriber group (CSG) mode.
As mentioned in the previous section, the coverage areas of macrocells and small cells can be quite different owing to the large transmit power disparities. However, similar conclusions cannot be extended to the uplink scenario, where the strength of the received signal mostly depends on the terminal transmit power, which is the same for all classes of BSs. If the cell association policy is opti-mized for uplink only, that is, to enable users access the BSs providing the best uplink transmissions, the cell boundaries will be determined by the uplink path losses to each BS, which is extremely different from the downlink scenario [47]. This uplink-downlink imbalance creates difficulties in choosing an optimal cell association policy for both uplink and downlink at the same time, unlike the macrocell-only network scenario where uplink and downlink boundaries are close-ly matched [11]. Routing the uplink and downlink traffics into different BSs may be a possible solution, but it also generates more system design problems difficult to solve in the near future [20].
macro-1.1 HetNets: The Solution for Coverage and Rate 11
cells and small cells [44].
To deal with the above-mentioned imbalances of uplink-downlink and cell loads, an approach to incorporate a positive cell association bias for picocells, namely cell range expansion, has been widely studied [49–51]. By associating the mobile users with a picocell BS, although the downlink received power from the closest macrocell BS is higher, the cell range expansion expands the picocell cov-erage to mitigate the uplink-downlink imbalance [11]. Furthermore, by increasing the accessibility of picocell BSs to offload more users toward them, the cell range expansion enables a more equitable distribution of radio resources among all the users [44].
Unlike picocells, femtocell BSs may selectively serve users, namely operat-ing in CSG mode in 3GPP terminology, in which cell access is not permissible to all users. In other words, only those users included in the femtocell’s access control list, namely femtocell subscribers, are allowed to access the femtocell re-sources [30,52]. Such femtocells in CSG mode are commonly referred to asclosed femtocells. As the nonsubscribers are not guaranteed to connect with the nearest BS, they probably experience and also generate significantly increased intercell interference which is generally undesired [53–55]. The closed femtocell can be regarded as an extreme opposite case of cell range expansion for the nonsub-scribers, in which the femtocell coverage is shrunk to zero. Though generating a number of near-far interference issues and being not optimized for nonsub-scribers [52, 53, 56, 57], CSG mode is still frequently preferred by the customers because of their demand for dedicated and secure femtocell environments [58,59].
Interference Management
Recent studies have already proven that increasing the density of co-channel BSs (even with different transmit power levels) will not deteriorate the received SINR distribution for a randomly chosen user terminal [60–62], given the condition that all the BSs are randomly placed and the user can access the strongest BS in the downlink. The main cause of this phenomenon is that the increased interference level from denser neighboring BSs is counterbalanced by the better serving signal from the closer serving BS [20, 61].
Both techniques force some mobile users not to access the BSs with the strongest downlink signals and the best received SINR, which in turn prevents them from establishing and maintaining reliable communications with their serving cells and poses further difficulties on interference management:
• Cell Range Expanded Picocell: In the uplink, intercell interference can be significantly mitigated as the cell boundaries are pushed away from picocells. In the downlink, more interference from the macrocell BS can be received by the picocell users located in the expanded regions, which leads to degraded downlink signal quality [49, 63].
• Closed Femtocell: In the uplink, the power control scheme implemented in nonsubscriber terminal increases the transmit power level to compensate for the path losses to its far serving macrocell, jamming the uplink of the nearby closed femtocell(s). In the downlink, the closed femtocell BSs gen-erate dead zones (otherwise known as coverage holes) for nonsubscribers that are effectively jammed by signals from close-by femtocell BSs [64, 65]. Considering the unplanned nature of femtocell deployment, the interference conditions can be severe in some particular locations.
If extra spectrum is available, multiple-carrier deployment will substantially simplify interference management in both the above-mentioned scenarios [66–69]. For instance, by operating macrocells and the cell range expanded picocells on dedicated frequency carriers, we can guarantee the transmit power levels, and biasing characteristics are the same for all the BSs on each of the component carriers, which makes each frequency layer homogeneous [30]. Similarly, in a het-erogeneous deployment, if orthogonal spectrum bands are assigned to macrocells and closed femtocells, a nonsubscriber can avoid coverage holes by simply staying at the macrocell-dedicated carrier [59]. Although multiple-carrier deployment ef-fectively mitigates the potential interference problem, this method is inefficient in terms of spectrum reuse [54] and sometimes infeasible because of the lack of multiple frequency bands for HetNet deployment [17]. Although far more compli-cated from the technical perspective, operators are more interested in the efficient co-channel HetNet deployment, in which the following interference management techniques can be further considered:
1.1 HetNets: The Solution for Coverage and Rate 13
this challenge, time-domain enhanced inter-cell interference coordination (eICIC) technique was proposed [37, 70]. In the eICIC scheme adopted in LTE release 10, the dominant interfering macrocell BS blanks specific subframes so that an interference-free communication tunnel can be estab-lished between the mobile user in the cell-expanded region and the serving picocell. The blanked subframes are referred to as almost blank subframes
(ABSFs) in 3GPP terminology, indicating that some basic physical chan-nels, for example, pilot, synchronization, and broadcast chanchan-nels, may still be transmitted, so as to support backward compatibility with legacy LTE release 8 terminals [71, 72]. The eICIC scheme based on ABSF is proved to be effective in mitigating downlink intercell interference for range expanded picocells [37], and there were extensive studies to propose and evaluate new scheduling algorithms in optimizing eICIC’s resource allocation [63, 73–75].
• Uplink Attenuation in CDMA Femtocell: For the code division mul-tiple access (CDMA)-based femtocell BSs co-channel operated with existing macrocell network, significant uplink interference from the nearby uncon-trolled nonsubscribers can be experienced. As mentioned earlier, this uplink interference problem can be much severer for closed femtocells, especially when we consider the fact that the minimum coupling loss between termi-nals and femtocell BSs can be as low as 30-40 dB [65,76]. Furthermore, the out-of-band radiation from femtocell BSs operating in adjacent bands also contributes to the uplink interference particularly in dense deployments [24]. The technique, uplink attenuation, can be utilized to mitigate the interfer-ence of this case [65, 77]. Specifically, in the presinterfer-ence of high out-of-cell interference, attenuation is applied at the femtocell uplink receiver to bring the level of out-of-cell interference down to be comparable to the thermal noise level [77], which is performed by an analog attenuator prior to analog-to-digital convertor (ADC). The aim for this uplink attenuation is to ensure that the noise rise of the resultant signals remains below a system-defined threshold such that the femtocell signal acquisition unit can function nor-mally.
highly related to its relative location with neighboring macrocell BSs, a self-calibration algorithm with minimal network intervention can be employed to adapt femtocell transmit downlink powers depending upon received macro-cell signal levels [65]. By adaptively adjusting the transmit power level, the femtocell can minimize the interference onto nonsubscribers while main-taining satisfactory coverage for femtocell subscribers [78, 79].
Mobility Management
In cellular networks, one of the most important aspects in mobility management is handover, which involves the effort to maintain QoS in connected mode when transferring a user terminal’s active connection from its serving cell to a target cell [80, 81]. In conventional macrocell-only network, the same set of handover-related parameters, such as handover hysteresis and time to trigger [82], is usually configured throughout the network. However, because of the heterogeneous char-acteristics for different kinds of access techniques and particular cell association requirements, cell-specific handover parameters should be optimized individual-ly [83–85]. For example, when high-mobility terminals pass through the small cell coverage areas, unnecessary handovers (otherwise known as called ping-pongs) are performed if the handovers are easy to be triggered. Provided, on the other hand, the users intrude deep into small cell regions before handover occurs and thus experience handover failures when the serving signals from macrocell BSs are degraded quickly, this is also not a good outcome. To balance the tradeoff between ping-pongs and handover failures, mobility-based solutions are needed and were proposed [86].
1.2
Security Enhancement in Future
Cellular Networks
1.2 Security Enhancement in Future Cellular Networks 15
an unauthorized receiver located within the transmission range and capable of eavesdropping the unicast transmissions toward legitimate users, and this factor will not change in the near future.
Traditionally, most security techniques in modern cellular standards, such as Wideband CDMA (WCDMA) and LTE, involve means of encryption algorithms in the upper layers of the protocol stacks, e.g., medium access control (MAC) and other layers above physical layer [87,88]. Based on a hard mathematical problem, these cryptographic techniques provide computational-based security. It ignores the message transmission phase and only aims to prevent the malicious users to extract the secret information from the received bit sequence. Typically, the security is guaranteed if the malicious users do not have sufficient computational capacity to solve some mathematical problem. For such techniques, although the expenditure of interception may be very high, providing robust encryption algorithms is becoming ever more challenging, due to the continuing development of computing devices.
1.2.1
Physical Layer Security
As the data security is so critically significant, it is desirable to seek for additional protection that can complement cryptography. One promising concept is achiev-ing information-theoretic security in the physical layer of wireless networks, that is, physical layer security, which protects the message transmission phase by ex-ploiting the physical properties of the wireless channel, such as noise, interference, and fading.
The foundation of physical layer security is laid by Wyner. In his pioneer-ing study, the wiretap channel model for point-to-point communication was pro-posed [89], which was extended to broadcast channels with confidential messages by Csisz´ar and K¨orner [90]. Based on these initial results, a positive secrecy capacity, defined as the maximum transmission rate at which the eavesdropper is unable to obtain any information, can be achieved if the intended receiver en-joys a better channel than the potential eavesdropper. Compared with classical computational security, the main advantage of physical layer security is perfect secrecy achievable, but with no computational restrictions required to be placed on the eavesdroppers.
as ad hoc networks), there are unique characteristics owned by cellular networks. For instance, cellular networks own the carrier-operated high-speed backhaul net-works connecting individual BSs and the core-network infrastructures, which pro-vide us potential means of BS cooperation, such as associating mobile users to the optimal BS with secrecy considerations and exchanging information to guarantee better secure links. Considering the fact that the cellular service area is divided into cells, each BS is able to know the circumstances within its own cell (e.g., the location as well as the identity of each user, that is, whether the user is a potential eavesdropper or not). The identity and location information of mobile users in the other cells can be obtained by information exchange between BSs via the backhaul networks.
1.3
Modeling of Cellular Networks
From both industrial and academic viewpoints, one of the most important topics is to model cellular networks in an appropriate way, thus evaluating related net-work metrics, such as cellular coverage, achievable rate, and secrecy performance. As the cellular network is undergoing the transformation from macrocell-only to heterogeneous deployment, the increased topology complexity proposes new chal-lenges in network modeling [20, 91].
1.3.1
Grid Model and System-Level Simulation
For macrocell-only networks where BSs are usually set apart evenly, placing the BSs on a two-dimensional grid (e.g., a square lattice or a more widely used hexag-onal lattice according to the idealized cellular structure) with mobile users either randomly or deterministically located is commonly accepted for network model-ing [8]. Although analytical results can be obtained for particular user-locations in the simplified grid model considering only limited number of interferers [18], analytical expressions of the received SINR and other useful performance metrics are unavailable for more general cases, such as a randomly located typical mobile user. System-level simulations based on this grid model have been extensively employed in both research and industry evaluations [8, 92].
val-1.3 Modeling of Cellular Networks 17
idate other organizations’ scenarios and interpret the results. More importantly, because of its intractability, it is impossible to efficiently identify the key de-sign parameters and their corresponding impacts on system performance through the grid-model-based simulations [43]. It should be noted that the grid model only represents a highly idealized scenario with regularly placed cells, different from real deployments, where the cell areas noticeably vary because of the prac-tical considerations, such as the availability of certain site locations, parameters specifically tuned for each BS, and so on.
1.3.2
Wyner Model
The Wyner model is another widely accepted model to capture the cellular in-teractions among multiple BSs [93]. As a more tractable model compared with the above-mentioned grid model, the Wyner model typically simplifies the inter-ference environment to one dimension, in which equal channel gains from limited number of neighboring interfering BSs are assumed [93–95]. This oversimplified model is accurate when the roughly constant interference exists due to a large number of simultaneous interferers over the space, thus making this model ideal for the scenario of a loaded CDMA uplink [96]. Nevertheless, for future cellular networks (e.g., LTE and WiMAX) with orthogonal multiple access such as the orthogonal frequency-division multiplexing (OFDM) systems, the Wyner mod-el’s assumptions become particularly inaccurate because the performance highly depends on the user locations [97]. To investigate the network-wise performance metrics for OFDM-based future cellular networks, we need a network model that can precisely characterize the performance impact of users’ relative locations.
1.3.3
Stochastic Geometry Model
Currently, stochastic geometry [98] is proved to be a helpful mathematic tool in analyzing large-scale wireless networks [99]. By assuming wireless communica-tion nodes scattered according to certain spatial random distribucommunica-tion, the network model based upon stochastic geometry allows us to study the probabilistic net-work behaviors and corresponding performance metrics [100–102].
be defined by the requirement that the random variables (defined as the counts of the number of points inside each of a number of non-overlapping finite sub-regions ofR2) should each have a Poisson distribution and should be independent of each other [98]. Different from the regular grid-based model, scattering wire-less nodes according to spatial PPP introduces total randomness for the node deployment, and only the node density variable is required to characterize this stochastic process. Counter-intuitively, the randomness introduced by the PPP-based model helps it to be more tractable in performance analysis, because it has closed-form results on interference and SINR distributions for certain signal attenuation laws [103, 104]. By accepting the PPP-based topology for random wireless networks, important results on connectivity, coverage, and throughput have been successfully derived [105–111].
The PPP-based model for cellular networks have been in use for more than 10 years [112,113]. In both the pioneering studies, the locations of macrocell BSs were considered as realizations of a stochastic point process, but the important key metrics related to practical engineering were still untouched. Brown et al.
also adopted the PPP-based model and incorporated practical cellular factors (e.g., frequency reuse, shadowing fading) into their analysis [114, 115]. However, these studies did not compare the performance results obtained from this PPP-based model with practical cellular networks. Without necessary validation, it is difficult to persuade other researchers to accept and adopt this new model in their own studies.
identi-1.4 Thesis Outline and Contributions 19
cal to an equivalent PPP-based model [118]. Furthermore, the PPP-based model was proved to be effective in evaluating particular cellular techniques, such as fractional frequency reuse [119, 120] and multi-cell cooperation [121, 122]. Differ-ent from the downlink scenarios mDiffer-entioned earlier, the uplink can also be studied by the PPP-based network model, even considering the more complex intercell interference conditions with power control algorithms [123].
Stepping into the era of HetNets, the complexity of system-level simulations substantially grows with the increased number of BSs. For instance, several pico-cell BSs and dozens of femtopico-cell BSs can be installed under a single macropico-cell BS coverage umbrella, which presents new challenges for traditional simulations based upon Monte Carlo experiments. Furthermore, the newly introduced small cells are prone to be irregularly spaced or even randomly scattered, which re-quires the network modeling to be robust to spatial randomness [124, 125]. To understand the impact of many important network parameters (e.g., cell associa-tion biasing) and to explore the depth insights on the diverse radio characteristics in HetNets, new tractable spatial modeling methodology is increasingly required. Considering flexible cell association, the received downlink SINR has been charac-terized by using the multi-tier version PPP-based models [57,60,61,126]. Because of the random deployment of femtocell BSs, the PPP-based model can also help to understand the co-channel-deployed femtocell network performance [69,127,128].
Moreover, this alteration of the impact of the cell load on throughput perfor-mance also requires us to focus more on “user perceived throughput distribution” in a HetNet (which considers data offloading to small cells and resource sharing between intracell users), rather than the general SINR received at the user termi-nal [20]. By studying the probabilistic characterization of the number of intracell users in different tiers [129], the resource sharing was well investigated to show the benefits brought by the small cell traffic offloading [46, 130].
1.4
Thesis Outline and Contributions
Chapter 2 - Tractable Model for Heterogeneous Networks with Direc-tional Antennas
In Chapter 2, an introductory description to the stochastic-geometry-based Het-Net model is provided, and this model is also used as the basic methodology in the following Chapter 3 and Chapter 5.
Furthermore, as directional antennas are widely used to sectorize the macrocell cells in practical cellular systems, it is of importance to model and investigate the impact of directional antennas. The main contributions of this chapter are summarized as follows:
1. We extend the original HetNet model to the one which takes the impact of directional antennas into consideration. Furthermore, the coverage perfor-mance obtained from this extended model is still tractable even considering a complex directional antenna gain function.
2. Based upon the analysis in this chapter, we demonstrate the impact of directional antenna patterns on the coverage performance, which helps us to identify the performance gap between a practical directional antenna model and an ideal one.
The results in this chapter have been presented in the following publications which are listed again for ease of reference:
C3. He Wang and Mark C. Reed, “A novel tractable framework to analyse het-erogeneous cellular networks”, in Proc. 6th IEEE Int’l Workshop on Het-erogeneous, Multi-Hop, Wireless and Mobile Networks (GLOBECOM’11 Wkshps), Houston, USA, Dec. 2011, pp. 287-292.
C4. He Wang and Mark C. Reed, “Tractable model for heterogeneous cellular networks with directional antennas”, in Proc. 2012 Australian Commun. Theory Workshop (AusCTW’12), Wellington, New Zealand, Jan./Feb. 2012, pp. 61-65.
Chapter 3 - Analytical Evaluation on a Non-uniform Femtocell Deploy-ment
1.4 Thesis Outline and Contributions 21
not give any remarkable improvement in coverage probability [60–62]. The main cause of this phenomenon is the increased network interference from having more small cell BSs in the areas with satisfactory macrocell coverage, when the small cell BSs are uniformly deployed at random. This fact inspires us to raise one interesting question, that is,
Q. Whether or not we can improve both coverage and throughput performances by not using the small cell BSs (e.g., femtocell BSs) at undesirable locations, in other words, utilizing them non-uniformly?
To answer this question, Chapter 3 proposes and evaluates an intuitive way to non-uniformly deploy femtocell, based upon which the significance of selectively deploying the femtocell BSs is explored.
The proposed non-uniform femtocell deployment scheme is not complicated to realize: By defining the inner region as the union of locations within a prescribed distance from any macrocell BSs, and the outer region as the union of locations outside the inner region, the non-uniform femtocell deployment scheme simply avoids using femtocell BSs within the inner region. There are two ways to imple-ment this non-uniform deployimple-ment scheme in practical, i.e., femtocell deactivation
and smart femtocell deployment. In femtocell deactivation, the femtocell BSs lo-cated within the inner region are deactivated, which helps to reduce unnecessary operating expense from the decreased femtocell BS energy consumption. To im-plement smart femtocell deployment, femtocell BSs are deployed in the outer region only. The main contributions of this chapter are summarized as follows:
1. We propose the above mentioned non-uniform femtocell deployment scheme. In this scheme, femtocell BSs are not utilized in the region within a certain distance away from any macrocell BSs. Through two ways of implemen-tations, namely, femtocell deactivation and smart femtocell deployment, we can guarantee that most of the active femtocell BSs are located in the relatively poor macrocell coverage areas.
3. For femtocell deactivation, we demonstrate that the same cellular cover-age performance as the uniform femtocell deployment can be maintained if the size of the inner region is appropriately chosen. Our numerical result demonstrates that more than 50% of femtocell BSs can be turned off to save the femtocell BS energy consumption and thus operating expense, without compromising on the coverage performance.
4. For smart femtocell deployment, we show that both the coverage and sin-gle user throughput can be significantly improved over the uniform femto-cell deployment. This finding demonstrates the performance improvements achievable by implementing a simple non-uniform femtocell deployment, which highlights the significance of selectively deploying the femtocell BSs, taking their relative locations with macrocell BSs into account.
The results in Chapter 3 have been presented in the following publications which are listed again for ease of reference:
J2. He Wang, Xiangyun Zhou, and Mark C. Reed, “Coverage and Throughput Analysis with a Non-uniform Femtocell Deployment”, submitted to IEEE Transactions on Wireless Communications.
C6. He Wang, Xiangyun Zhou, and Mark C. Reed, “Analytical evaluation of coverage-oriented femtocell network deployment”, inProc. IEEE Int’l Conf. on Commun. (ICC’13), Budapest, Hungary, June 2013, pp. 4567-4572.
Chapter 4 - Analysis on Femtocell Uplink Attenuation Algorithms
By implementing uplink attenuation in CDMA-based femtocell receivers, the intercell interference caused by nearby uncontrolled users can be mitigated signif-icantly and the noise rise of the resultant signals staying below a system-defined threshold such that the femtocell signal acquisition unit can function normally.
1.4 Thesis Outline and Contributions 23
uplink attenuation might increase the chance of outage events at the edge of the femtocell, if certain SINR levels at the receiver need to be maintained.
In order to balance the interference mitigation effect and increased femtocell user transmit power, Chapter 4 focuses on analyzing the impact of uplink attenu-ation algorithms on the system performance. Specifically, the main contributions of this chapter are summarized as follows:
1. We analyze femtocell’s uplink environment where the uplink attenuation technique is implemented, and derive an analytical result of the outage probability under certain fixed level of uplink attenuation.
2. We demonstrate the tradeoff between higher level uplink attenuation re-sulting in a higher probability to reach the maximum power cap and lower level attenuation with less interference mitigation. Based on this tradeoff given by the analytical result, the fixed optimal uplink attenuation factor which minimizes the outage probability is determined, which is beneficial to practical system design.
3. In this chapter, we propose two adaptive uplink attenuation algorithms, both of which aim to minimize the outage probability by adaptively ad-justing the uplink attenuation factor based upon the information of the scheduled traffic, SINR requirements for each femtocell user, and the cur-rent interference power at femtocell receiver. Simulation Results show that both adaptive schemes are able to achieve better performance improvement over the traditional algorithm.
The results in this chapter have been presented in the following publications which are listed again for ease of reference:
C1. He Wang, Ming Zhao, and Mark C. Reed, “Outage analysis for WCDMA
femtocell with uplink attenuation”, in Proc. IEEE 1st Int’l Workshop on Femtocell Networks (GLOBECOM’10 Wkshps), Miami, USA, Dec. 2010, pp. 664-668.
Chapter 5 - Physical Layer Security in Large-Scale Cellular Networks
In Chapter 5, we focus on investigating the secrecy performance in large-scale cellular networks. As mentioned in Section 1.2, achieving information-theoretic security by protecting the physical layer of wireless networks is an promising way to guarantee secrecy communications for future cellular networks; however, most of the previous studies on security communications in large-scale networks were concentrated on ad hoc networks.
Chapter 5 provides the analytical results to quantify the secrecy rate perfor-mance. Specifically, the following secure communication links are under inves-tigation: Confidential messages are prepared to be conveyed to a mobile user, while certain other mobile users should not have the access to the messages and hence are treated as potential eavesdroppers. The serving BS should ensure the messages delivered to the intended user successfully while keeping perfect secrecy against all potential eavesdroppers.
Several attention-grabbing questions about achieving information-theoretic security in large-scale cellular networks can be raised as follows:
Q1. If BS information exchange via the backhaul networks is ideal, i.e., the serv-ing BS fully acquires potential eavesdroppers’ location information, what is the secrecy rate achievable at a randomly located mobile user?
Q2. Comparing with connecting to nearest BS, how much performance improve-ment can be obtained by optimally choosing the serving BS?
Q3. How will the performance be degraded if the information exchange between BSs no longer exists?
Q4. To achieve a certain level of secrecy performance, how many nearby BSs should participate in the information exchange between BSs?
Aiming to answer the above questions, we provide analysis on the probability distribution of the secrecy rate and hence the average secrecy rate achievable for a randomly located mobile user in a large-scale cellular network, in which different assumptions are made on the cell association and location information exchange between BSs. The major contributions of this chapter are summarized as follows:

![Table 4.1: Relationship between minη {P[Aout]} and Event Cout. The parametervalues for this example are W = 5 MHz, RoT ∗dB = 12 dB, mγdB = 7 dB andσγdB = 2.5 dB.](https://thumb-us.123doks.com/thumbv2/123dok_us/1874454.144645/111.595.184.453.177.479/table-relationship-minh-event-parametervalues-example-mgdb-andsgdb.webp)