promoting access to White Rose research papers
White Rose Research Online
[email protected]
Universities of Leeds, Sheffield and York
http://eprints.whiterose.ac.uk/
White Rose Research Online URL for this paper:
http://eprints.whiterose.ac.uk/9294/
Published conference paper
A spatial accuracy assessment of an alternative circular scan method for
Kulldorff’s spatial scan statistic
Simon Read
1, Peter Bath
1, Peter Willett
1, Ravi Maheswaran
21
Department of Information Studies, University of Sheffield, Regent Court, 211 Portobello Street, Sheffield S1 4DP, UK
Tel. 0044(0)114 2222630 Fax 0044(0)114 2780300
2
School of Health and Related Research, University of Sheffield, Regent Court, 30 Regent Street, Sheffield, S1 4DA, UK
KEYWORDS: epidemiology, ‘spatial scan statistic’, ‘point process’, ‘case-control study’, SaTScan
1. Introduction
This paper concerns the Bernoulli version of Kulldorff’s spatial scan statistic, and how accurately it identifies the exact centre of approximately circular regions of increased spatial density in point data. We present an alternative method of selecting circular regions that appears to give greater accuracy. Performance is tested in an epidemiological context using manifold synthetic case-control datasets. A small, but statistically significant, improvement is reported. The power of the alternative method is yet to be assessed.
2. Research Background
The spatial scan statistic (Kulldorff 1997), implemented via SaTScan (www.satscan.org), has been used extensively by epidemiologists as a tool for cluster detection. The Bernoulli version of the spatial scan statistic aims to detect localised clusters in binary labelled spatial point data, ideal for use with case-control studies. Each point is a ‘case’ (incident of disease) or ‘control’ (random sample of the non-diseased population) (Rothman 2008).
Kulldorff (1997) proved that if one wishes to locate a specific region where each data-point has a higher (or lower) probability of a being a case than a data-point outside, then the spatial scan statistic (Section 2.1) is the most powerful test. However, no universally accepted optimum method for finding candidate regions exists. Some propose scanning for arbitrarily shaped regions, which is flexible but computationally expensive: see Tango & Takahashi (2005) for an example, and citations of others. SaTScan offers a computationally efficient circular scan (Section 2.2), similar in ways to Openshaw’s GAM (1987), and we examine an alternative to this. (Section 3).
2.1. Kulldorff’s Spatial Scan Statistic (Bernoulli Version)
Consider a study of N points across a region A. C are cases, the remainder controls. Let Z be any sub region of A, containing n points, c of which are cases. Let Ac be all A outside Z. Let p be the
probability (risk) that any point in Z is a case. Let q be the probability that any point in Ac is a case. Null hypothesis H0 is p=q; alternative hypothesis HA is p>q. Given N, the likelihood of any particular
Z occurring under HA is
:
)
(
)
1
(
)
(
)
1
(
)
(
)
(
( ) ( )n
N
c
C
n
c
I
n
N
c
C
n
N
c
C
n
c
n
c
Z
L
A c n c C c N n C c−
−
>
−
−
−
−
−
−
=
− − − − − (1)Under H0 the likelihood is uniform for all Z:
C N C
o
N
C
N
N
C
L
=
(
)
(
−
)
−(2)
For any Z, the spatial scan statistic (a.k.a. likelihood ratio) is defined as:
o A
L
Z
L
Z
LR
(
)
=
(
)
(3)
Let Z’ be the Z with highest LR(Z). Z’ is the most likely disease cluster. Statistical inference for Z’
(rejection of H0) is obtained by Monte Carlo testing, but isn’t necessary in this investigation: Z’ is always the most significant location of increased risk, and we place only one location of increased risk in our model (Section 4).
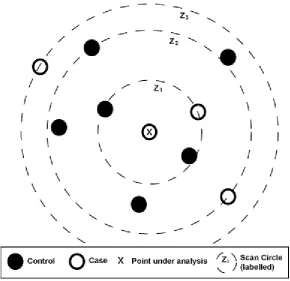
2.2. Original (SaTScan) Method of Finding Circular Candidates for Z’
SaTScan identifies circular or elliptical candidates for Z’ (most likely cluster). We considering
[image:3.595.152.443.374.655.2]circular. For each point in A, concentric circles are drawn with radii just large enough to reach a case, as Figure 1. Circle in A with the highest likelihood ratio is declared Z’.
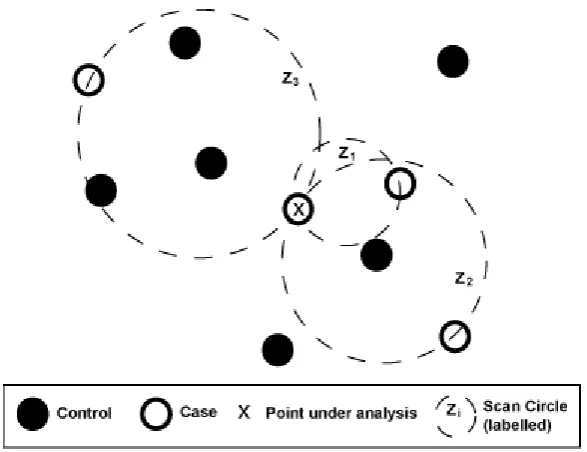
3. Our Alternative Method of Finding Circular Candidates for Z’
For each point in A, circles are drawn whose rim intersects the point and a case, diameter being
exactly equal to distance between them, as Figure 2. Circle in A with the highest likelihood ratio is declared Z’ (most likely cluster).
[image:4.595.151.445.169.395.2]
Figure 2.
Example of Alternative Circular Scan Method
Both methods generate C(N-1) circles. The alternative method screens out C(C-1)/2 duplicates.
Circles of the alternative method are smaller than the original, so usually contain fewer points (smaller n). This is important: circles where n is a large proportion of N may be too big to be useful clusters. SaTScan, by default, screens out circles where n > N/2. So, although the original method generates more circles, more are also screened out. A larger number of smaller circles clearly facilitates a more detailed analysis, possible leading to more accurate locating of disease sources.
4. Accuracy Testing Methodology
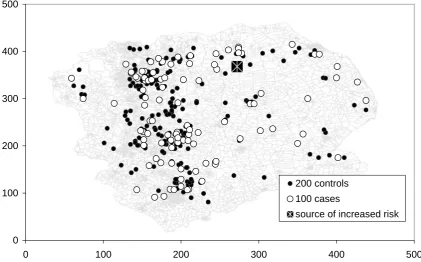
Original and alternative methods are competitively tested on synthetic case-control datasets. The stochastic nature of disease distribution means one must compare methods on manifold datasets to draw a meaningful conclusion. Synthetic data provides this multiplicity. To add realism, the underlying intensity of the control distribution is matched to the 2001 population density of Trent, a UK region containing urban and rural areas, and features like coastal towns and ribbon developments. The same intensity is used to generate cases, with the injection of a single randomly located (and oriented) hypothetical source of multiplicative increased risk. Figure 3 shows an example randomization, based on a 500x500 grid for computational convenience. The risk source takes one of two distributions, both Gaussian, see Figure 4. The non-symmetric type could represent a wind-blown pathogen. The peak of each distribution is aligned with the location of the source. The height of the
peak symbolises the source’s maximum relative risk (MRR). For instance, MRR=5 means a
0 100 200 300 400 500
0 100 200 300 400 500
200 controls 100 cases
[image:5.595.78.500.85.347.2]source of increased risk
[image:5.595.200.396.390.468.2]Figure 3.
Example of Randomised Synthetic Case-Control Distribution
Figure 4.
Examples of Symmetric (left) and Non-Sy
m
metric (right)
Sources of Increased Risk
The alternative method is coded in C++ as a self-contained object, passed only the case-control locations. The original method is the batch version of SaTScan, downloaded from www.satscan.org. Relative performance is discussed below.
5. Test Results.
For each dataset, the centre of the most likely circle produced by each method is recorded as its ‘guess’ at the position of the source. The calling program records the distance (in grid units) between guess and actual source location, as the Estimation Error (EE). For m datasets, based on a grid of
width units across, MeanEstimation Error Difference is defined:
∑
=
−
−
−
=
mi
original i e alternativ i
width
EE
EE
m
MEED
1
)
(
1
(4)Eight runs of m=5000 datasets (width=500, N=300, C=100) were used to test four MRR values for
symmetric and non-symmetric sources, results in Table 1. Note MEED is expressed as a percentage,
negativity indicating the alternative method is more successful. p-values are based on rejection of the
[image:6.595.84.485.164.231.2]null hypothesis MEED=0.
Table 1.
Comparative Mean Estimation Error Difference (MEED).
Disease source shape Indicator MRR=1.5 MRR=3 MRR=5 MRR=10
Symmetric MEED -0.89% -1.02% -1.05% -0.55%
p-value <0.00001 <0.00001 <0.00001 0.0001
Non-symmetric MEED -0.76% -0.72% -0.76% -0.31%
p-value <0.00001 <0.00001 <0.00001 0.0162
6. Discussion and Future Research
Table 1 shows that, in every run, the alternative method’s ‘guesses’ tend to be slightly, but significantly, closer to the actual source than those of the original. Although small in terms of the grid units, this could equate to several kilometres in real studies. This supports the argument in Section 3, that a greater number of smaller circles promotes greater spatial accuracy. Interestingly, the alternative method appears to perform better (relative to the original) at lower MRR levels. In our model at least, lower MRR leads to a smaller cluster area, which is naturally detected more accurately by a smaller circle. This property may be useful, as the relative risk of real disease causal factors is typically small (Rothman 2008).
One important omission here is power analysis. Increased computing resources are required, as the Monte Carlo testing required to obtain cluster significance causes a x1000 runtime increase. We will address this in the near future.
We propose investigating a similar alternative to the elliptical version of SaTScan, and also applying the concept to temporal dimensions.
7. Acknowledgements
We thank the Medical Research Council for funding Simon Read.
8. References
Kulldorff, M. (1997). "A spatial scan statistic". Communications in Statistics - Theory and Methods, 26(6), 1481-1496.
Openshaw, S., et al. (1987). "A Mark 1 Geographical Analysis Machine for the automated analysis of point data sets." International Journal of Geographical Information Systems, 1(4), 335-358.
Rothman, K.J., et al. (2008). Modern Epidemiology. Philadelphia: Lippincott, Williams and Wilkins.
Tango, T. & Takahashi, K. (2005). "A flexibly shaped spatial scan statistic for detecting clusters".
International Journal of Health Geographics, 4(1), 11.
9. Biography