R E S E A R C H A R T I C L E
Open Access
Mortality along the continuum of HIV care
in Rwanda: a model-based analysis
Eran Bendavid
1,2*, David Stauffer
2, Eric Remera
3, Sabin Nsanzimana
3,4, Steve Kanters
5and Edward J. Mills
5Abstract
Background:HIV is the leading cause of death among adults in sub-Saharan Africa. However, mortality along the HIV care continuum is poorly described. We combine demographic, epidemiologic, and health services data to estimate where are people with HIV dying along Rwanda’s care continuum.
Methods:We calibrated an age-structured HIV disease and transmission stochastic simulation model to the epidemic in Rwanda. We estimate mortality among HIV-infected individuals in the following states: untested, tested without establishing care in an antiretroviral therapy (ART) program (unlinked), in care before initiating ART (pre-ART), lost to follow-up (LTFU) following ART initiation, and retained in active ART care. We estimated mortality among people living with HIV in Rwanda through 2025 under current conditions, and with improvements to the HIV care continuum. Results:In 2014, the greatest portion of deaths occurred among those untested (35.4%), followed by those on ART (34.1%), reflecting the large increase in the population on ART. Deaths among those LTFU made up 11.8% of all deaths among HIV-infected individuals in 2014, and in the base case this portion increased to 18.8% in 2025, while the contribution to mortality declined among those untested, unlinked, and in pre-ART. In our model only combined improvements to multiple aspects of the HIV care continuum were projected to reduce the total number of deaths among those with HIV, estimated at 8177 in 2014, rising to 10,659 in the base case, and declining to 5,691 with combined improvements in 2025.
Conclusion:Mortality among those untested for HIV contributes a declining portion of deaths among HIV-infected individuals in Rwanda, but the portion of deaths among those LTFU is expected to increase the most over the next decade. Combined improvements to the HIV care continuum might be needed to reduce the number of deaths among those with HIV.
Keywords:HIV, Rwanda, Mortality, Care continuum, Care cascade, Antiretroviral coverage, Universal test and treat, Loss from care
Background
The number of HIV infected individuals receiving anti-retroviral therapy (ART) in Sub-Saharan Africa is steadily increasing [1]. The expansion of ART provision has led to important declines in HIV-related and all-cause adult mor-tality [2–4]. However, the declining global estimates of HIV mortality belie the fact that, in 2013, HIV was responsible for more deaths than any other single cause in sub-Saharan Africa [5, 6]. A major challenge for addressing mortality
among those with HIV is the incomplete understanding of what patient groups are at the highest risk of mortality. This understanding can inform the prioritization of pro-grams targeting at-risk populations. We aimed to use data from the Rwandan HIV population to estimate mortality along the continuum of care.
The HIV care continuum, sometimes referred to as the care cascade, is a paradigm for understanding the states in the health care system that HIV-infected individuals find themselves following HIV infection [7]. Estimates of the continuum in the United States, for example, suggest that only 30% of all HIV-positive patients were virally sup-pressed in 2011, with notable gaps prior to HIV testing, after testing and before ART initiation, and after ART * Correspondence:[email protected]
1
Division of General Medical Disciplines, Stanford University, Stanford, CA, USA
2Center for Health Policy and the Center for Primary Care and Outcomes
Research, Stanford University, Stanford, CA, USA
Full list of author information is available at the end of the article
initiation [8]. However, healthcare systems are poorly equipped to monitor the vital status of patients outside ART programs, and may fail to distinguish between patient loss from care, transition to other healthcare facilities, and death [9]. As Rwanda’s public health system ensures that most patient transfers and mortality are identified, a unique opportunity exists to assess patient tracking through the HIV care continuum [10]. We used nationally representa-tive data from Rwanda and modeled this using a transmis-sion simulation model.
Methods
Setting
Rwanda’s HIV/AIDS strategy has been a positive outlier in its ability to engage large segments of the population, in-cluding typically hard to service populations, such as men and adolescents [11]. Since 2002, a National Strategic Plan set aggressive targets for increasing ART coverage using a decentralized network of clinics principally staffed by com-munity health workers [12]. Rwanda has outpaced many other countries in increasing ART coverage (defined as the portion of all infected individuals that are receiving ART) [1]. In addition, nearly all care in Rwanda is provided by the public sector (less than 1% of patients attend private clinics according to national surveillance data) [13].
Model description
We calibrated a dynamic stochastic microsimulation model of HIV disease and transmission to Rwanda’s HIV epidemic to study where in the HIV care continuum are people dying [14–17]. The model uses information on the transition of patients through the health care system from a national source of HIV care in the public sector [10]. We used the model to estimate the distribution and trends of mortality. Specifically, we examined where along the HIV care con-tinuum are HIV-infected individuals dying, and how this trend is expected to change in the next decade. We also ex-amined how HIV treatment and prevention programs ad-dressing different aspects of HIV care delivery would be expected to affect future mortality patterns.
The model simulates HIV transmission, testing, treat-ment, and disease progression in individuals, using an age-and gender-stratified demographic model fit to Rwage-anda’s population [18]. We modeled a population ages 15 and older, and assumed a stable population growth rate of 2.6% per year [18, 19]. The model is calibrated to several epide-miologic trends from 2003 to 2014, including population size, HIV testing coverage, ART coverage, and HIV preva-lence [1, 10, 20, 21]. Complete model parameters, descrip-tion, and calibration figures are shown in Additional file 1: Sections S1 and S2.
We modeled disease transmission through heterosexual contact. The infection status of HIV-negative individuals is determined by their risk factors for acquiring HIV,
including the number of sexual partners, the HIV status of their sexual partners, the infectivity of HIV-positive part-ners, and, for men, their circumcision status. Partner distri-bution and infectivity based on viral load is shown in the parameter table. The initial distribution of sexual partners was estimated from Rwanda’s 2005 Demographic and Health Survey and updated through discussion with Minis-try of Health participation [21]. The probability of having an HIV-infected sexual partner is dynamically determined in relation to the HIV prevalence in the opposite gender. We assume homogenous mixing across ages, and did not explicitly model special populations such as female sex workers except through the distribution of sexual partner-ships. For each individual with an HIV-positive partner, the partner’s infectivity is determined by the distribution of acutely infected, unsuppressed, and suppressed individuals in the currently infected population. We assume that indi-viduals with suppressed viral load on ART have 90% lower risk of transmitting HIV per coital act compared with chronic unsuppressed infection (the reduction in infectivity is higher in comparison with acute HIV) [22, 23]. The probability of infection for an uninfected individual, then, is a product of their partners’infection status and the trans-mission hazard per person-month of contact given the part-ner’s infectivity. The risk of acquiring HIV is 50% lower for circumcised men [24, 25]. Additional demographic and transmission parameters are provided in Table 1 and Additional file 1: Section S1.
HIV disease, care, and mortality
Our model represents HIV disease and care along the care continuum. Untreated HIV disease is represented as a chronic progressive disease in which a declining CD4 count defines the risk of mortality and development of op-portunistic diseases (OD). Effective treatment with ART leads to CD4 count increases that are based on age, CD4 count at treatment initiation, and duration of treatment. Additional details on the disease progression assumptions are in the Additional file 1 and previous articles [15, 16].
initiation, and in our analysis patients initiate ART when their measured CD4 count drops below 250 cells/mm3 (2003 to 2008), 350 cells/mm3 (2009–2013), or 500 cells/ mm3 (starting in 2014). Patients also qualify for ART when they experience an OD. Given estimates of rates of trans-mitted drug resistance, we estimate that 90% of those who are adherent achieve viral suppression within 6 months of ART initiation [26, 27]. Following ART initiation, patients may be lost to follow-up (LTFU) with a monthly probability of 0.0875% [10]. We use estimates that 50% of those LTFU may return to care if they develop an OD [9, 10].
We used monthly mortality rates for each person as a combined function of age, gender, and, for HIV-positive
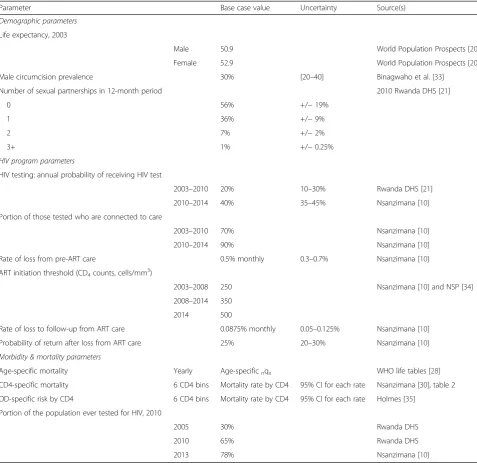
[image:3.595.58.536.98.561.2]individuals, CD4 count, and ART status. Age- and gender-specific mortality for HIV-negative individuals come from life tables for Rwanda and converted to monthly probability of death [28]. We cause-delete the contribution of HIV to overall mortality using estimates of the portion of deaths due to HIV by age and gender [29]. Thus, for HIV-negative individuals we apply cause-deleted age- and gender-specific mortality. For HIV-positive individuals, we model mortality as a function of current CD4 cell count, with an additional short-term risk of death during an acute OD event [30]. All the in-fluential base case parameter and uncertainty values are summarized in Table 1.
Table 1Selected model parameters and base case assumptions
Parameter Base case value Uncertainty Source(s)
Demographic parameters
Life expectancy, 2003
Male 50.9 World Population Prospects [20]
Female 52.9 World Population Prospects [20]
Male circumcision prevalence 30% [20–40] Binagwaho et al. [33]
Number of sexual partnerships in 12-month period 2010 Rwanda DHS [21]
0 56% +/−19%
1 36% +/−9%
2 7% +/−2%
3+ 1% +/−0.25%
HIV program parameters
HIV testing: annual probability of receiving HIV test
2003–2010 20% 10–30% Rwanda DHS [21]
2010–2014 40% 35–45% Nsanzimana [10]
Portion of those tested who are connected to care
2003–2010 70% Nsanzimana [10]
2010–2014 90% Nsanzimana [10]
Rate of loss from pre-ART care 0.5% monthly 0.3–0.7% Nsanzimana [10]
ART initiation threshold (CD4counts, cells/mm3)
2003–2008 250 Nsanzimana [10] and NSP [34]
2008–2014 350
2014 500
Rate of loss to follow-up from ART care 0.0875% monthly 0.05–0.125% Nsanzimana [10]
Probability of return after loss from ART care 25% 20–30% Nsanzimana [10]
Morbidity & mortality parameters
Age-specific mortality Yearly Age-specificnqx WHO life tables [28]
CD4-specific mortality 6 CD4 bins Mortality rate by CD4 95% CI for each rate Nsanzimana [30], table 2
OD-specific risk by CD4 6 CD4 bins Mortality rate by CD4 95% CI for each rate Holmes [35]
Portion of the population ever tested for HIV, 2010
2005 30% Rwanda DHS
2010 65% Rwanda DHS
Outcomes and sensitivity analyses
Our principal analyses address the following two ques-tions: (1) where are HIV-infected individuals dying in the context of Rwanda’s care continuum? and (2) how are these patterns expected to vary with changes to HIV care in Rwanda? In analyzing mortality, we measure deaths among HIV-infected individuals in each of the following groups: prior to HIV testing (Untested), among those with a known HIV diagnosis but who are no linked to care (Unlinked), after linkage to care but prior to ART initi-ation (pre-ART, included leaked patients), among those in ART care, and among those lost to follow-up (LTFU) after ART initiation. We estimate mortality with two metrics: the portion of all deaths taking place among individuals in each group, and a mortality rate calculated as the number of deaths divided by the number of person-years in the group (age-adjusted using weighted average of rates in each 5-year age group). The point estimates for the base case were obtained after 100 model iterations. Uncertainty in the results reflect both first-order (stochastic) variation as well as second-order variation from a probabilistic sen-sitivity analysis where parameters were jointly sampled from the distributions spanning their uncertainty ranges and the outcomes of interest were summarized after 1000 model iterations. Uncertainty bounds are reported as the 25–75% range among all model iterations.
In addition to the base-case estimations, we simulate the expected changes in mortality under several potential changes to Rwanda’s national strategic plan for HIV con-trol. These include modeling the mortality changes follow-ing intensifyfollow-ing annual testfollow-ing rates from 40% to 90% of the population; increasing linkage to care from 80% of the tested population to 90% (for example using patient tra-cing); reducing leakage from pre-ART 0.5% to 0.1% of the pre-ART population per month; and improving rates of LTFU from 0.0875% of those on ART to 0.05% per month. We also simulated immediate ART initiation for all linked HIV-positive individuals and one combined scenario where all improvements were implemented. These im-provements were constructed to reflect proposed inter-ventions in Rwanda through early identification and offer of ART to HIV-infected individuals, targeting of popula-tions at high risk for infection, community support for re-tention in ART programs, and peer networks to improve maintenance in care and reduce rates of loss to follow-up.
All simulations were carried out in Matlab 2014b, and analyses and visualizations in Stata 13.1.
Results
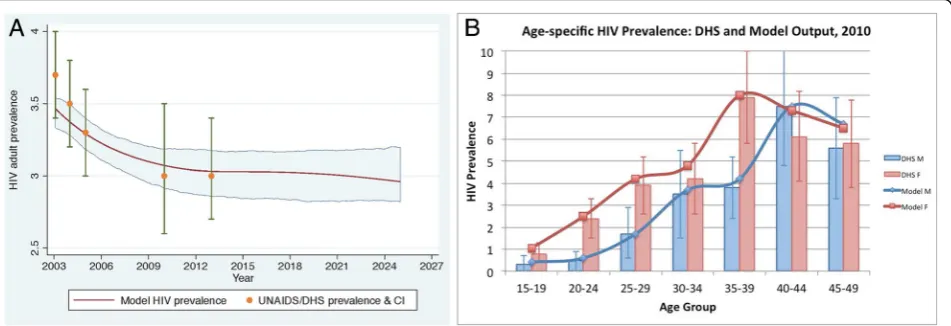
Our model is calibrated to Rwanda’s overall and age-specific HIV prevalence from 2003 to 2013, and projected forward to 2025. Between 2003 and 2005, we calibrated the model to UNAIDS prevalence estimates among adults, de-clining from 3.6% in 2003 to 3.3% in 2005 [1]. From 2005
to 2013, we used the Rwanda Demographic and Health Surveys of 2005 and 2010, and the Rwanda AIDS Indicators Survey of 2013 to obtain nationally representative adult HIV prevalence estimates [21]. Adult HIV prevalence was 3.0% in all three surveys. Prevalence in our model declined to 3.0% in 2007, and remained stable during the period from 2007 to 2013. We calibrated overall prevalence as well as age-specific prevalence in each 5-year age group, avail-able from the Rwanda Demographic and Health Surveys. Figure 1 shows the model’s calibration fitting overall preva-lence estimates from 2003 to 2013 (panel A) as well as age-specific prevalence rates seven years into the model is started, in 2010 (panel B). Although we did not explicitly calibrate incidence, our model’s incidence for 2013–2014 was 0.23 infections per 100 person-years, similar to the 0.27 estimate in the 2013–14 Rwanda HIV Incidence Household Survey [31]. The Additional file 1 contains add-itional calibration results.
Several demographic trends shape the mortality patterns. First, a stable 3% adult HIV prevalence, combined with an overall annual population growth rate of 2.6% implies a steady growth in the HIV-positive population, estimated at 239,668 in 2014 and increasing 25.9% to 301,808 by the end of 2025. Over the same time period, a continuation of current HIV mortality rates imply an increase of 17.4% in the number of deaths among those HIV-positive, from 12,971 in 2014 to 15,229 in 2025. While these estimates represent substantial increases in HIV-infected populations and deaths, they are smaller than the projected 32.6% in-crease in the overall population size, suggesting a decline from the present in HIV burden. Our baseline estimates of the number of deaths are higher than UNAIDS estimates of AIDS deaths since the model accounts for all deaths among those with HIV, including non-AIDS deaths among those with HIV. This increase in the number of deaths among those with HIV reflects the balance between the up-wards pressure on mortality from population growth and aging of the HIV-infected population versus the declining mortality from continued expansion of the population accessing ART. As Rwanda’s HIV-infected population ages, the portion of deaths made up by older individuals is also expected to increase. Our model estimates that, in 2014, 10% of deaths among HIV-infected individuals took place among those older than 65-years-old, and that this propor-tion would increase to 24% in 2025. These changes in HIV population patterns, including population growth and aging, help frame the changing drivers of mortality.
Where are people dying along the care continuum?
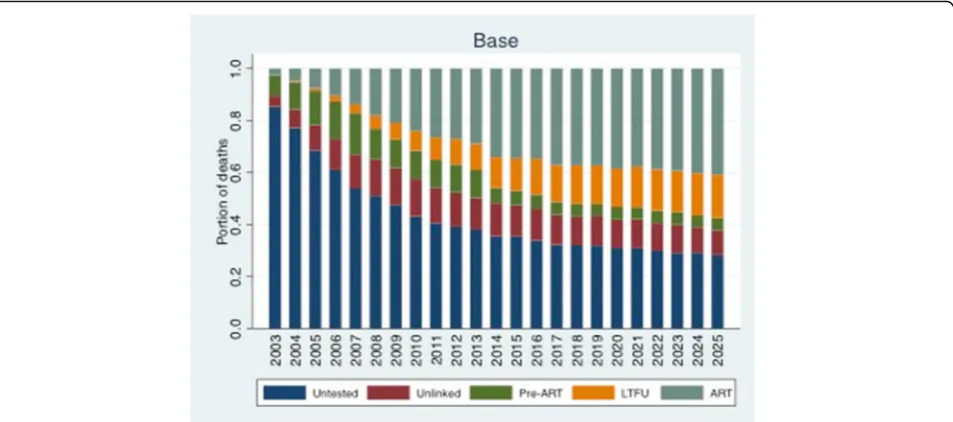
changing composition of those untested to include a growing portion of asymptomatic individuals with rela-tively higher CD4 counts. Figure 2 shows the time trends and changes in mortality distribution under the base case scenario. This results from selective testing of those with ODs such that the testing rate is generally higher among those with advanced disease, and from the op-portunity to miss those with recent infections even when testing rates are high, leading to a shift in the untested population towards those with less advanced HIV (we estimate that among those untested, the portion with CD4 cell counts higher than 500 was 29.4% in 2003 and 59.3%in 2014). By 2014, the portion of deaths among those untested declined to 35.4% (31.2-39.5% out of an estimated 8,177 deaths among people with HIV). At the same time, those on ART experienced the largest growth in the proportion of deaths, from 2.7% in 2003 (1.1– 4.4%) to 34.1% in 2014 (29.9–38.4%). This is a reflection of the large growth of people on ART, and accounts for the overall decline in mortality rates among those with HIV, since the mortality rate among those on ART is lower than any other group. We project that, over the next decade, the portion of all deaths made up by those untested, unlinked, and pre-ART will decline, and the portion of all deaths made up by those on ART and LTFU will increase (where deaths on ART is a desirable outcome of effective scale-up, while deaths among those lost from care are undesirable). The greatest increase in mortality is estimated to take place among those LTFU, from 11.8% (11.1–12.5%) in 2014 to 18.8% (17.9–19.9%) in 2025. While empirical observations and our modeled population suggest that in 2013 those LTFU made up 3% of the population living with HIV, model findings suggests that this group’s share of overall deaths is about 4 times higher than its share of the population, reflecting
their high mortality rate, especially in comparison with those on ART [10]. The increasing mortality share of those LTFU is a reflection of the growing portion of the infected population initiating ART, and, at current rates of loss from care following ART initiation, the number of those lost from ART care.
Mortality rates among all HIV-infected individuals have declined from a peak of 72.8 deaths per 1000 person-years in 2004 to 26.3 in 2014 (Fig. 3). These de-clines are mirrored most strongly in reductions among those untested and those on ART. Mortality rates among those unlinked, during pre-ART, or those LTFU have only declined modestly.
Effects of targeted and combined care improvements
[image:5.595.62.538.89.252.2]resulting in a declining number of deaths among those with HIV to 5691 in 2025. In addition, a combined pack-age of interventions is also expected to result in the great-est prevalence decline, down to 2.1% (2.0-2.3%) by 2025 (Additional file 1: Section S4).
Discussion
Our analysis provides new insights into mortality among people with HIV in Rwanda, with potential implications for other countries in sub-Saharan Africa with similar demog-raphy and epidemiology. Four principal insights emerge: first, at the current performance of the HIV healthcare sys-tem, the combination of growing population size, aging, and stable HIV prevalence implies that the number of deaths among HIV-positive individuals are expected to in-crease; second, while the untested and on-ART populations currently make the greatest contributions to mortality, the current levels of testing and ART initiation are expected to result in a declining share of mortality from those untested and a growing share from those in ART care; third, among those not on ART, mortality among those LTFU is expected to grow the most over the next decade; and, fourth, a com-bined approach that includes improvements to all aspects of HIV care may be needed in order to produce meaningful mortality decline.
We believe our analysis is the first HIV transmission model calibrated specifically with Rwanda’s epidemiologic and treatment parameters. HIV care in Rwanda has been among the best in sub-Saharan Africa in terms of expand-ing ART coverage through investments in HIV care
infrastructure, adoption of higher CD4 initiation thresh-olds, and improving HIV testing and linkage rates. At the same time, like several other sub-Saharan countries with rapidly growing ART programs, Rwanda had witnessed flat prevalence rates for much of the last decade and a de-clining HIV financial budget, such that maximizing care is a priority. In this complex landscape, our analysis identi-fies drivers of mortality along the care continuum.
Our modeling approach highlights the important role played by demographic changes. Specifically for Rwanda, population growth and aging of the overall and HIV-infected populations imply that growing numbers of individuals will die with HIV, often while remaining in ART and HIV care. On the one hand, this means that the growing mortality share of those on ART reflects the desirable survival of this popula-tion to older ages. On the other hand, it underscores the future needs to address age-related mortality and morbidity in this population [32].
[image:6.595.61.538.88.299.2]reduces mortality among those untested, unlinked, and LTFU. However, implementing immediate ART may be substantially simpler than a combined strategy (similar to UNAIDS’s 90-90-90 targets), and may sim-plify HIV care by avoiding pre-ART care.
There are both strengths and limitations to our ana-lysis. The strengths include our access to Rwandan specific data and interaction with the Ministry of Health officials available to provide context. Our model integrates a large amount of information on HIV epidemiology and care. Specifically, the mortality projections rely on data from observational and sur-veillance cohorts, and any bias in those parameters in-troduced by selection will propagate in our model. Our model assumes predominantly heterosexual transmis-sion. Given stigma associated with men who have sex with men in Africa and a lack of data on injecting drug use, it is possible these populations play a larger role than we accounted for. In addition, while Rwanda’s
population growth has remained stable over the past decade, our findings of the number of deaths could change if the demographic projections of population growth and age structure will change substantially over the next decade.
[image:7.595.60.537.88.435.2]the dearth of data on their epidemiology and behavior limits our ability to incorporate them in the modeling framework.
Conclusion
In conclusion, estimating the mortality patterns among those with HIV enables planning of interventions towards those groups that are expected to shoulder the burden. We estimate that the greatest increase in mortality among those not on ART is expected among those LTFU, and the great-est decline among those untgreat-ested. However, we also show that interventions targeting a single part of the HIV care space will not meaningfully decrease the number of deaths among those with HIV, and that combined approaches may be required to continue shrinking the number of deaths among those with HIV.
Additional file
Additional file 1:Section S1.Additional Model Schematic, Description, and Parameters.Section S2.Model Calibration Figures.Section S3.Changing Mortality Distribution with Continuum Improvements. Section S4: Projected Prevalence Trends with Continuum Improvements. (DOCX 12869 kb)
Abbreviations
ART:Antiretroviral therapy; HIV: Human Immunodeficiency virus; LTFU: Lost to follow up; UNAIDS: The joint United Nations programme on HIV/AIDS
Acknowledgements
None.
Funding
The Bill and Melinda Gates Foundation provided partial support for this analysis (EM, SK, DS). The National Institute on Drug Abuse provided additional support (EB, DS). The funders played no role in the design of the study and collection, analysis, and interpretation of data, or in writing the manuscript.
Availability of data and material
[image:8.595.305.536.254.736.2]All data sources used in this analysis are detailed in the Additional file 1 and Table 1. The source code is available upon request from the authors.
Authors' contributions
EB conceived the research idea, contributed to the model design, data analysis, and interpretation, and wrote the first draft of the report. DS programmed the model, contributed to the analyses, and implemented the study strategies. ER helped with procuring the HIV care data and with drafting the manuscript. SK analyzed Rwanda HIV care data and helped with manuscript drafting and revisions. SN helped collect and analyze the primary data underlying model parameters, designing model strategies, and drafting of the manuscript and critical revisions. EM analyzed Rwanda HIV care data and helped with manuscript drafting and revisions. All authors read and approved the final manuscript.
Competing interests
The authors declares that they have no competing interests. All authors completed the ICMJE uniform disclosure form at http://www.icmje.org/ coi_disclosure.pdf.
We declare no financial or non-financial competing interests.
Consent for publication
Not applicable.
Ethics approval and consent to participate
Not applicable.
Author details
1Division of General Medical Disciplines, Stanford University, Stanford, CA,
USA.2Center for Health Policy and the Center for Primary Care and
Outcomes Research, Stanford University, Stanford, CA, USA.3Institute of HIV
Disease Prevention and Control, Rwanda Bio-Medical Center, Kigali, Rwanda.
4Basel Institute for Clinical Epidemiology & Biostatistics and Swiss Tropical
and Public Health Institute, University of Basel, Basel, Switzerland.5Precision
Global Health, Vancouver, Canada.
Received: 17 May 2016 Accepted: 21 November 2016
References
1. UNAIDS AIDSinfo: Epidemiological Status [http://aidsinfo.unaids.org/]. Accessed 22 Nov 2016.
2. Bor J, Herbst AJ, Newell M-L, Bärnighausen T. Increases in adult life expectancy in rural South Africa: valuing the scale-up of HIV treatment. Science. 2013;339(6122):961–5.
3. Bendavid E, Holmes C, Bhattacharya J, Miller G. HIV Development Assistance and Adult Mortality in Africa. JAMA. 2012;307(19):2060.
4. Mills EJ, Bakanda C, Birungi J, Chan K, Ford N, Cooper CL, Nachega JB, Dybul M, Hogg RS. Life expectancy of persons receiving combination antiretroviral therapy in low-income countries: a cohort analysis from Uganda. Ann Intern Med. 2011;155(4):209–16.
5. Lozano R, Naghavi M, Foreman K, Lim S, Shibuya K, Aboyans V, Abraham J, Adair T, Aggarwal R, Ahn SY. Global and regional mortality from 235 causes of death for 20 age groups in 1990 and 2010: a systematic analysis for the Global Burden of Disease Study 2010. Lancet. 2013;380(9859):2095–128. 6. Global Burden of Disease Study 2013. Global Burden of Disease Study 2013
(GBD 2013) Results by Location, Cause, and Risk Factor. Seattle: Institute for Health Metrics and Evaluation (IHME); 2016.
7. Rosen S, Fox MP. Retention in HIV care between testing and treatment in sub-Saharan Africa: a systematic review. PLoS Med. 2011;8(7):e1001056. 8. MMWR Weekly November 28. 2014: HIV Diagnosis, Care, and Treatment
Among Persons Living with HIV—United States, 2011. [http://www.cdc. gov/mmwr/preview/mmwrhtml/mm6347a5.htm]. Accessed 22 Nov 2016. 9. Geng EH, Bangsberg DR, Musinguzi N, Emenyonu N, Bwana MB,
Yiannoutsos CT, Glidden DV, Deeks SG, Martin JN. Understanding reasons for and outcomes of patients lost to follow-up in antiretroviral therapy programs in Africa through a sampling-based approach. J Acquir Immune Defic Syndr. 2010;53(3):405.
10. Nsanzimana S, Kanters S, Remera E, Forrest J, Binagwaho A, Condo J, Mills E. HIV care continuum in Rwanda: a cross-sectional analysis of the national programme. Lancet HIV. 2015;2(5):e208–15.
11. Binagwaho A, Farmer PE, Nsanzimana S, Karema C, Gasana M, de Dieu NJ, Ngabo F, Wagner CM, Nutt CT, Nyatanyi T. Rwanda 20 years on: investing in life. Lancet. 2014;384(9940):371–5.
12. Rwanda HIV and AIDS National Strategic Plan [http://rbc.gov.rw/IMG/pdf/ final_nsp_2013-2018.pdf]. Accessed 22 Nov 2016.
13. Republic of Rwanda Ministry of Health Annual Report 2012–2013 [http:// www.moh.gov.rw/fileadmin/templates/Press_release/MoH_Annual_Report_ July_2012-June_2013.pdf]. Accessed 22 Nov 2016.
14. Bendavid E, Wood R, Katzenstein DA, Bayoumi AM, Owens DK. Expanding antiretroviral options in resource-limited settings–a cost-effectiveness analysis. J Acquir Immune Defic Syndr. 2009;52(1):106–13.
15. Bendavid E, Brandeau ML, Wood R, Owens DK. Comparative effectiveness of HIV testing and treatment in highly endemic regions. Arch Intern Med. 2010;170(15):1347–54.
16. Bendavid E, Grant P, Talbot A, Owens DK, Zolopa A. Cost-effectiveness of antiretroviral regimens in the World Health Organization's treatment guidelines: a South African analysis. Aids. 2011;25(2):211–20.
17. Bendavid E, Young SD, Katzenstein DA, Bayoumi AM, Sanders GD, Owens DK. Cost-effectiveness of HIV monitoring strategies in resource-limited settings: a southern African analysis. Arch Intern Med. 2008;168(17):1910–8. 18. World Population Prospects, the 2015 Revision [http://esa.un.org/unpd/wpp/].
Accessed 22 Nov 2016.
20. UN Population Division. World Population Prospects: The 2012 Revision [http://esa.un.org/wpp/]. Accessed 22 Nov 2016.
21. Demographic and Health Surveys. ICF International. [http://www.dhsprogram. com/]. Accessed 22 Nov 2016.
22. Cohen MS, Chen YQ, McCauley M, Gamble T, Hosseinipour MC, Kumarasamy N, Hakim JG, Kumwenda J, Grinsztejn B, Pilotto JH. Prevention of HIV-1 infection with early antiretroviral therapy. N Engl J Med. 2011;365(6):493–505. 23. Hollingsworth TD, Anderson RM, Fraser C. HIV-1 transmission, by stage of
infection. J Infect Dis. 2008;198(5):687–93.
24. Auvert B, Taljaard D, Lagarde E, Sobngwi-Tambekou J, Sitta R, Puren A. Randomized, controlled intervention trial of male circumcision for reduction of HIV infection risk: the ANRS 1265 Trial. PLoS Med. 2005;2(11):e298. 25. Gray RH, Kigozi G, Serwadda D, Makumbi F, Watya S, Nalugoda F, Kiwanuka N,
Moulton LH, Chaudhary MA, Chen MZ, et al. Male circumcision for HIV prevention in men in Rakai, Uganda: a randomised trial. Lancet. 2007;369(9562):657–66. 26. Rhee S-Y, Blanco JL, Jordan MR, Taylor J, Lemey P, Varghese V, Hamers RL,
Bertagnolio S, de Wit TFR, Aghokeng AF, et al. Geographic and Temporal Trends in the Molecular Epidemiology and Genetic Mechanisms of Transmitted HIV-1 Drug Resistance: An Individual-Patient- and Sequence-Level Meta-Analysis. PLoS Med. 2015;12(4):e1001810.
27. Mills EJ, Nachega JB, Buchan I, Orbinski J, Attaran A, Guyatt G, Bangsberg DR. Adherence to Antiretroviral Therapy in Sub-Saharan Africa and North America: A Meta Analysis. JAMA. 2006;296(6):679–90.
28. Global Health Observatory Data Repository: Rwanda Life Tables [http://apps. who.int/gho/data/view.main.61370?lang=en]. Accessed 22 Nov 2016. 29. Global Burden of Disease Visualizations
[http://vizhub.healthdata.org/gbd-compare/arrow]. Accessed 22 Nov 2016.
30. Nsanzimana S, Remera E, Kanters S, Chan K, Forrest JI, Ford N, Condo J, Binagwaho A, Mills EJ. Life expectancy among HIV-positive patients in Rwanda: a retrospective observational cohort study. Lancet Global Health. 2015;3(3):e169–77.
31. Remera E. 2013–14 Rwanda HIV Incidence Household Survey: Understanding HIV Epidemic in Rwanda. Boston: CROI; 2016. 32. Bendavid E, Ford N, Mills EJ. HIV and Africa's elderly: the problems and
possibilities. Aids. 2012;26 Suppl 1:S85–91.
33. Binagwaho A, Pegurri E, Muita J, Bertozzi S. Male circumcision at different ages in Rwanda: a cost-effectiveness study. PLoS Med. 2010;7(1):e1000211. 34. Rwanda HIV and AIDS National Strategic Plan [http://www.rbc.gov.rw/spip.
php?rubrique145]. Accessed 22 Nov 2016.
35. Holmes CB, Wood R, Badri M, Zilber S, Wang B, Maartens G, Zheng H, Lu Z, Freedberg KA, Losina E. CD4 decline and incidence of opportunistic infections in Cape Town, South Africa: implications for prophylaxis and treatment. J Acquir Immune Defic Syndr. 2006;42(4):464–9.
• We accept pre-submission inquiries
• Our selector tool helps you to find the most relevant journal • We provide round the clock customer support
• Convenient online submission • Thorough peer review
• Inclusion in PubMed and all major indexing services • Maximum visibility for your research
Submit your manuscript at www.biomedcentral.com/submit