0022-538X/95/$04.0010
Copyrightq1995, American Society for Microbiology
Quantification of Transcripts from the ICP4 and Thymidine
Kinase Genes in Mouse Ganglia Latently Infected
with Herpes Simplex Virus
MARTHA F. KRAMER
ANDDONALD M. COEN*
Department of Biological Chemistry and Molecular Pharmacology and Committee on Virology,
Harvard Medical School, Boston, Massachusetts 02115
Received 6 October 1994/Accepted 17 November 1994
Herpes simplex virus establishes latency in nervous tissue in which it is maintained for the life of the
mammalian host, with occasional reactivation leading to subsequent spread. Latency-associated transcripts
are abundant during latency, but viral proteins and productive cycle RNAs have not been detected. Using
sensitive, quantitative PCR assays, we have quantified certain viral RNAs specific to productive-cycle genes in
mouse ganglia latently infected with herpes simplex virus type 1. Sense-strand RNA specific to the essential
immediate-early gene,
ICP4
, was present in most ganglia in variable amounts relative to the amount of viral
DNA, with one to seven molecules of RNA per viral genome in about 20% of ganglia. In contrast, the amount
of latency-associated transcripts was much less variable, at an average of 4
3
10
4molecules per viral genome.
The amounts of
ICP4
-specific RNA were similar at 30 and 60 days postinfection, and at least some of these
transcripts initiated within a region consistent with utilization of the
ICP4
promoter. RNA specific to the
thymidine kinase gene, whose transcription in productive infection is dependent on ICP4, was present in
latently infected ganglia at a maximum level of 3.2
3
10
6molecules per ganglion (500 molecules per viral
genome).
ICP4
-specific and
tk
-specific RNAs measured from the same samples showed a positive correlation
extending over 2 orders of magnitude. We conclude that
ICP4
-specific RNA is expressed in the absence of
detectable reactivation and discuss possible implications of our findings for latent gene expression.
Herpes simplex virus (HSV) can express two distinct
tran-scriptional patterns, one specifying productive infection and
the other specifying latency. Productive infection, which is
typ-ical at peripheral sites in the mammalian host and in cultured
cells, involves a regulated cascade of gene expression.
Imme-diate-early (IE) genes are expressed first and are required for
the efficient expression of the subsequent early (E) and late (L)
genes. The productive cascade generates the components
re-quired for viral replication and generation of infectious
prog-eny. In contrast, latency is characterized by a complete lack of
detectable infectious virus. The only viral products that are
abundantly expressed are the latency-associated transcripts
(LATs) (11, 14, 60, 66, 70), which are not abundant during
productive infection. No infectious virus or viral antigens have
been detected in homogenized human autopsied trigeminal
ganglia (3) or mouse trigeminal or dorsal root ganglia latently
infected with HSV type 1 (HSV-1) (9, 15, 19, 35, 41, 44, 49, 52,
63, 65, 66, 67, 69), although reactivation competence can be
demonstrated by explant of tissue and other methods. The
absence of infectious virus and detectable viral antigens
cor-relates with the absence of detection of transcripts from
pro-ductive-cycle genes in human trigeminal or sacral ganglia
in-fected with HSV-1 (11, 12, 23, 68) or HSV-2 (10) or mouse
trigeminal or dorsal root ganglia latently infected with HSV-1
(14, 15, 19, 20, 55, 56, 66, 70, 76) or HSV-2 (71, 73). However,
infectious virus and viral products can be readily detected
during the acute phase of establishment of latency and during
reactivation. The mechanisms by which the productive pattern
of gene expression in acutely infected neurons switches to the
latent pattern, and how productive transcription is reactivated,
remain central unanswered questions in HSV biology, with
significance for the areas of tissue-specific gene expression and
control of HSV disease.
Part of the difficulty in studying gene expression in latency is
the low proportion of latently infected cells in the target tissue
and the resultant difficulties in detecting rare RNAs. The
ad-vent of PCR technology has enabled the quantitative detection
of nucleic acids at the level of individual molecules (61). To
ascertain whether there is a low level of HSV gene expression
other than LATs during latency, we have developed a sensitive
quantitative RNA PCR (QRPCR) assay for HSV genes. We
have applied this assay to detect HSV RNAs in latently
in-fected mouse trigeminal ganglia, in particular to the IE gene
ICP4 because of its critical role in activation of E and L genes
(16, 53). It has been thought that the absence of IE expression
in latency permits establishment and maintenance of latency,
and activation of IE genes would lead to reactivation (34, 45,
48, 63, 70, 78). We report the measurement and quantification
of ICP4-specific RNA at the level of hundreds to tens of
thou-sands of molecules per ganglion, or from 0.004 to 7 ICP4 RNA
molecules per viral genome copy, and compare its expression
with that of LATs and thymidine kinase gene (tk)-specific
RNA. We discuss the results of this study in terms of models of
mechanisms of latency and reactivation.
MATERIALS AND METHODS
Viruses and cells.The KOS strain of HSV-1 was propagated and assayed on Vero cell monolayers as previously described (7). The tk deletion mutant dlsptk has been previously described (8). The LAT promoter deletion mutant dlLAT1.8 has been previously described (43) and was generously provided by P. Schaffer.
Infection of mice and tissue collection.Eight-week-old CD-1 outbred mice were inoculated with 23106
PFU of virus or mock infected with virus diluent via corneal scarification (44). At 30 or 60 days postinoculation (p.i.), trigeminal ganglia were removed and rapidly frozen in liquid nitrogen. The elapsed times
* Corresponding author. Mailing address: Department of Biological Chemistry and Molecular Pharmacology, Harvard Medical School, 250 Longwood Ave., Boston, MA 02115. Phone: (617) 432-1691. Fax: (617) 432-3833. Electronic mail address: [email protected].
1389
on November 9, 2019 by guest
http://jvi.asm.org/
from cervical dislocation to immersion of tissue in liquid nitrogen were 137621 (mean6standard deviation [SD]) s for left ganglia and 195623 s for right ganglia (n518 each).
Preparation of ganglionic DNA and RNA.Ganglionic nucleic acids were pre-pared by the method of Chirgwin et al. (5), with attention to optimizing recovery and maintaining PCR-contaminant-free reagents and conditions. Briefly, each ganglion was transferred from liquid nitrogen to 1.0 ml of guanidine thiocyanate (GTC) solution (5 M GTC, 50 mM Tris [pH 7.5], 10 mM EDTA, 5%b -mer-captoethanol) and homogenized in an acid-washed, autoclaved Kontes size 20 glass tissue grinder. To analyze DNA, a 100-ml aliquot was transferred to a screw-cap tube and mixed with 300ml of water, 40ml of 3 M sodium acetate, and 1.0 ml of absolute ethanol. After incubation at2208C for at least 1 day, the precipitate was collected by centrifugation at 16,0003g for 30 min, washed with 70% ethanol, and resuspended in water (sterile water for irrigation; Baxter). In early experiments, the pellet was resuspended in 50ml of water, extracted and back-extracted with phenol-chloroform (1:1), extracted with chloroform, and ethanol precipitated by using 0.5 volume of 7.5 M ammonium acetate, after which PCR analyses of cellular and viral DNA were performed with aliquots of the resuspended pellet. Because of low and variable yield, the method was changed to the following. The resuspended pellet was brought to a final volume of 50ml containing 0.2mg of proteinase K per ml, 0.02% Tween 20, 13PCR buffer (50 mM KCl, 10 mM Tris-HCl, pH 9.0 [at 258C], 0.1% Triton X-100), and 1.5 mM MgCl2and heated sequentially to 658C for 2 h, 808C for 20 min, and 948C for 10 min to inactivate the enzyme. Aliquots were taken directly for PCR analysis. DNA standards were prepared from HSV DNA quantified by compar-ison with standards as described previously (33), reconstituted with uninfected mouse ganglia, and processed as described for the tissue samples. To analyze RNA, sarcosyl (N-lauroylsarcosine; Sigma) was added to the remaining 900ml of GTC homogenates to 0.5%, and the homogenates and two 0.8-ml GTC washes of the tissue grinder and transfer syringe were layered onto 2.0-ml 5.7 M cesium chloride cushions. Total RNA recovered after equilibrium centrifugation and ethanol precipitation (5) was treated with 15 U of RNase-free DNase (Promega) in the presence of 1 U of RNasin (Promega) per 40ml of reaction mixture for 1 h at 378C. The reaction was stopped with the addition of EDTA to 0.5 M and 1
mg of yeast tRNA (Boehringer Mannheim) and then extracted with phenol-chloroform (1:1), back-extracted with water, extracted with phenol-chloroform, and ethanol precipitated by using ammonium acetate.
Reverse transcription.Following an initial denaturation step of 10 min at 958C, total recovered RNA was hybridized with downstream primers Act-2, 4-2, L-2, tk-2 (Table 1), and other HSV-1-specific oligonucleotides (not described in this report) for 4 to 16 h at 658C in a 12-ml volume containing 3 pmol of each downstream primer, 250 mM KCl, 10 mM Tris (pH 8.3), and 1 mM EDTA and then covered with an oil overlay. After phase inversion with chloroform, half (6
ml) of each sample was added to each of two reaction mixtures containing 12ml of 1.53reverse transcriptase (RT) buffer (1.5 mM deoxynucleoside triphos-phates [dNTPs], 7.5 mM dithiothreitol, 15 mM MgCl2, 0.09 M KCl, 0.63 mM Tris [pH 8.3]) (1). Reaction mixtures were incubated with or without 10 U of avian myeloblastosis virus RT (Promega) at 42.58C for 1 h and then subjected to heat denaturation at 958C for 5 min. The resulting cDNA samples were stored at
2808C.
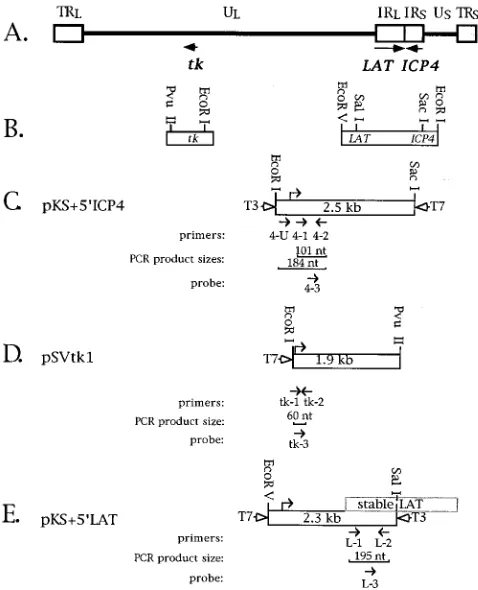
RNA standards.Plasmid pSPMbA, generously provided by S. Sakiyama, con-tains the mouseb-actin cDNA under the control of the bacterial SP6 promoter (74). HSV genes and plasmids containing relevant fragments are shown in Fig. 1. Plasmid pKS159ICP4 was constructed, using standard techniques (2), by cloning the 2.5-kb EcoRI-BamHI fragment of pK1-2 (17) (kindly provided by D. Knipe)
containing the 59end of the ICP4 gene into the EcoRI and BamHI sites of Bluescript II KS1(Stratagene), placing it under the control of the bacterial T3 promoter and enabling antisense transcription of this region from the T7 pro-moter (Fig. 1C). Plasmid pSVtk containing the EcoRI-PvuII fragment including the tk gene was kindly provided by Charles Hwang (28) (Fig. 1D). Plasmid pKS159LAT was constructed by cloning the EcoRV-SalI 2.3-kb fragment of the LAT 59region from pRFS (43) (kindly provided by P. Schaffer) into the EcoRV and SalI sites of Bluescript II KS1, placing it under the control of the T3 RNA polymerase (Fig. 1E). RNA transcriptions in vitro were performed by using 2mg of linearized plasmid DNA in 100-ml reaction volumes as described elsewhere (54), with low-specific-activity incorporation of [35
S]GTP (New England Nu-clear) (25mCi in 20mmol per reaction). After the 2-h reaction, one aliquot of each reaction was separated electrophoretically alongside radiolabeled RNA size markers transcribed concurrently on a formaldehyde-agarose gel (2), which was dried and subjected to autoradiography, to verify that RNA of the predicted size was the only detectable product. Another aliquot was taken to measure total counts per minute for determination of percent incorporation. Following treat-ment with RNase-free DNase (Promega), phenol-chloroform extraction, and ethanol precipitation, the samples were resuspended in 100ml of nuclease-free water (Promega). Triplicate aliquots were taken for measurement of trichloro-acetic acid-precipitable counts at this point to account for any loss incurred during the extraction procedure. The amount of RNA was calculated from the percentage of incorporated GTP (trichloroacetic acid-precipitable counts di-vided by total counts) times the amount of GTP present in the reaction mixture (50 nmol), corrected for the G1C content of individual transcripts (50% for
b-actin [74], 80% for ICP4 [47], 65% for LAT [77], and 62% for tk [31]), the size in nucleotides of each transcript, and Avogadro’s number. These synthetic RNA stocks were stored in aliquots at 2808C. Equivalent amounts of quantified standard RNA (LAT, tk, and ICP4 with other HSV-1-specific sequences not described here) were combined, serially diluted, and reconstituted with 5mg of total cellular RNA prepared from mouse brain (by the GTC-cesium chloride method [2]) or total RNA from individual uninfected mouse trigeminal ganglia (as described above).b-Actin standard serial dilutions were reconstituted with 5
mg of yeast tRNA (Boehringer Mannheim). For each set of samples, reconsti-tution standards were made and sample and standard cDNAs were prepared concurrently, as described above, using the same DNase and RT enzyme lots, reagents, and equipment to control for assay-to-assay variability.
PCR.PCR mixtures were brought to a volume of 90ml containing 10ml of 103
[image:2.612.57.565.84.247.2]buffer (500 mM KCl, 100 mM Tris-HCl, pH 9.0 [at 258C], 1.0% Triton X-100; Promega), 50 pmol of each upstream and downstream primer (Table 1), MgCl2 at a concentration unique to each assay (Table 2), and sample or standard DNA or cDNA. Following heat denaturation at 958C for 5 min (hot-start method [6]), 10ml containing 2.5 U of Taq polymerase (Promega) and 0.8ml of 25 mM dNTPs (Promega) (for a final reaction concentration of 200mM) was added, and the samples were overlaid with mineral oil. Water blanks and positive controls containing 2, 20, 200, and 2,000 molecules of HSV genomic DNA were included with each assay. Amplifications were performed on a Perkin-Elmer Cetus DNA Thermal Cycler with denaturation for 1.0 min at 948C, annealing for 1.0 min at 55 or 608C (Table 2), and extension for 1.0 min at 728C for the total number of cycles listed in Table 2. Reaction mixtures were stored at 48C. Coamplification of viral (tk) and cellular (adipsin) DNA was performed and analyzed as previously described (33) on 10ml of sample but with the inclusion of the hot-start method, reduction of the Taq polymerase to 2.5 U, and shortening of the annealing and extension steps to 1.0 min each. Assays for RNA were performed separately for each gene sequence to be amplified, using a portion of the cDNA (0.5ml each for
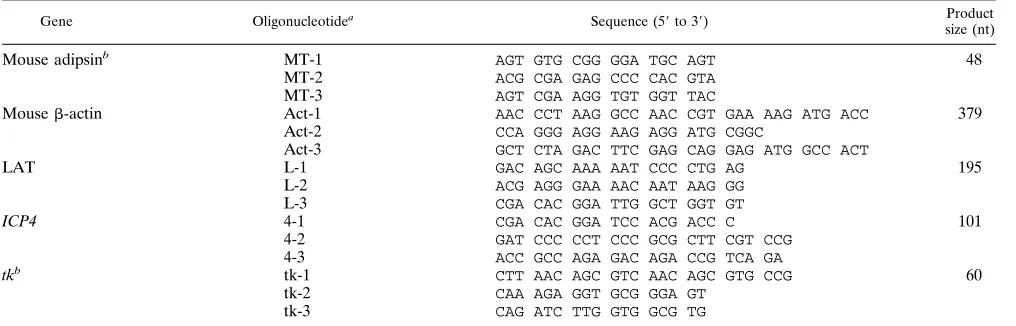
TABLE 1. Primers and probes
Gene Oligonucleotidea
Sequence (59to 39) Product size (nt)
Mouse adipsinb MT-1 AGT GTG CGG GGA TGC AGT 48
MT-2 ACG CGA GAG CCC CAC GTA MT-3 AGT CGA AGG TGT GGT TAC
Mouseb-actin Act-1 AAC CCT AAG GCC AAC CGT GAA AAG ATG ACC 379
Act-2 CCA GGG AGG AAG AGG ATG CGGC
Act-3 GCT CTA GAC TTC GAG CAG GAG ATG GCC ACT
LAT L-1 GAC AGC AAA AAT CCC CTG AG 195
L-2 ACG AGG GAA AAC AAT AAG GG L-3 CGA CAC GGA TTG GCT GGT GT
ICP4 4-1 CGA CAC GGA TCC ACG ACC C 101
4-2 GAT CCC CCT CCC GCG CTT CGT CCG 4-3 ACC GCC AGA GAC AGA CCG TCA GA
tkb tk-1 CTT AAC AGC GTC AAC AGC GTG CCG 60
tk-2 CAA AGA GGT GCG GGA GT tk-3 CAG ATC TTG GTG GCG TG
aNumbering indictes the following: 1, upstream primer; 2, downstream primer; 3, internal probe. bSequences were as reported by Katz et al. (33).
on November 9, 2019 by guest
http://jvi.asm.org/
LAT andb-actin and 3.0ml each for ICP4 and tk). Product sizes are indicated in Fig. 1 and Table 1. Product specificity was verified by predicted size, hybridization with the internal oligonucleotide probe, and restriction endonuclease analysis.
Detection and quantification of PCR products.Reaction products (10ml) were separated by electrophoresis on a nondenaturing polyacrylamide gel of 8% for
b-actin or LAT, 10% for ICP4, or 12% for tk or adipsin. Gels were stained with ethidium bromide and visualized under UV light. Stained bands which were characteristic for each assay and which did not all coincide with the specific PCR product were observed. These nonspecific products were similar in mock-in-fected and virus-inmock-in-fected samples, showing that they arose from cellular se-quences. Separated products were electroblot transferred to a nylon filter (GeneScreen Plus; NEN), UV cross-linked for 5 min, and prehybridized, probed, and washed as previously described (33). Probes (Table 1) were end labeled with [g-32
P]ATP (ICN) to high specific activity (range, 53108
to 73108 cpm/mg). Filters were exposed to preflashed Kodak XAR-5 film with intensifying screens at2808C for 16 to 24 h. Filters were additionally exposed to a storage Phos-phorImager cassette (Molecular Dynamics) for 2 to 24 h and quantified accord-ing to the manufacturer’s protocol. Data were analyzed with Microsoft Excell and Cricketgraph software packages and a Macintosh IIvx computer.
Normalization of viral DNA and RNA.Viral nucleic acids were normalized to cellular nucleic acids for two purposes, to normalize for sample-to-sample vari-ability in yield and to be able to relate viral RNA to viral DNA within each individual ganglion. Our first measurements of cellular DNA varied from 8.6 to 15mg of DNA per sample (11.562.1mg per ganglion, n528, mean6standard deviation SD, including mock- and virus-infected samples). After we changed methods from organic extraction to proteinase K digestion in subsequent exper-iments, we found that the cellular DNA amount was consistently higher (15.36
0.7mg per ganglion, n536, mean6SD). Thus all viral DNA values were normalized to 15mg of cellular DNA and expressed as ‘‘per ganglion.’’ The amount ofb-actin RNA expressed as log10molecules per ganglion was 10.060.4 (log10mean6SD, n528, including mock- and virus-infected samples). All viral RNA values were normalized to 1010b-actin RNA molecules and expressed as ‘‘per ganglion.’’
RESULTS
Development of a QRPCR assay for HSV-1-specific RNAs in
latently infected tissue.
To ascertain whether there were
HSV-1 productive-cycle transcripts present in latent infection
in mice, we developed a sensitive PCR-based RNA assay for
specific HSV-1 sequences and applied this assay to measure
levels of transcripts arising from the IE gene, ICP4, the E gene,
tk, and LATs. The principle of the assay was to compare the
RNA-specific PCR signal of a virally infected tissue sample
against a standard curve of known amounts of viral RNA.
Figure 2 shows a flowchart of the assay. Mice were inoculated
via corneal scarification, and 30 to 60 days later, trigeminal
ganglia were rapidly harvested into liquid nitrogen. Each
gan-glion was transferred to GTC from liquid nitrogen and
homog-enized. One-tenth of this homogenate was used to prepare and
analyze viral and cellular DNA. The remainder was used to
prepare, purify, and analyze specific cellular and viral RNA
sequences by comparison with standard curves of each gene
sequence.
For a PCR assay to be quantitative, several criteria must be
met (22). (i) The standards must be very close in composition
to what is being tested. Relevant fragments of genes were
cloned into transcription plasmids (Fig. 1), transcribed,
quan-tified, and reconstituted with an amount and constitution of
cellular RNA comparable to that of the trigeminal ganglion
samples. (ii) Samples and standards must be prepared under
identical conditions of reagent concentrations, enzyme
activi-ties, and times and temperatures of given reactions. Ganglionic
and reconstituted standard RNAs were treated with DNase,
purified by organic extraction, subjected to primer annealing,
and reverse transcribed concomitantly, using the same
re-agents, enzyme lots, and conditions. (iii) PCR must remain in
the linear range and sensitivity optimized with regard to primer
selection, Mg
21concentration, use of enhancing agents, and
cycling parameters (times and temperatures of each step).
Each assay was optimized initially using HSV DNA and then
applied to cDNA derived from specific genes. Individual
[image:3.612.59.298.70.365.2]pa-FIG. 1. Regions of the HSV-1 genome assayed. (A) Genome structure. The boxes represent the terminal and internal repeat (TR and IR) regions which bracket the unique long and short (UL and US) sequences depicted in the prototype arrangement. Arrows below the genome diagram designate the map locations and orientations of the tk, ICP4, and LAT genes. (B) Expanded regions containing genes of interest showing restriction enzyme sites used for cloning into transcription plasmids. (C to E) Open boxes represent the portions of each gene which were cloned into transcription plasmids, with the size of the insert in kilobase pairs indicated in each box. The restriction enzyme sites indicated above each box correspond to those shown in panel B. The transcription start site is indicated as a bent arrow above each box. The identities and directions of bacterial polymerase promoters are indicated at the sides of the boxes for T7 and T3 RNA polymerases. Below each box, arrows indicate the directions and rela-tive positions of PCR primers (numbered 1 and 2) and probes (numbered 3), with the identities indicated underneath each. The size of each PCR product is indicated in number of nucleotides. (C) The ICP4 transcription plasmid, pKS159ICP4, which contains the 59half of the ICP4 gene cloned into the Stratagene Bluescript II KS1vector. (D) The tk transcription plasmid, pSVtk1 (28). (E) The LAT transcription plasmid, pKS159LAT, which contains the 2.3-kb EcoRV-to-SalI 59region cloned from pRFS (43) into Bluescript II KS1. Superimposed on the cloned sequence is a box representing the genomic location of the 2-kb LAT, labeled ‘‘stable LAT.’’
TABLE 2. PCR conditions
Gene [Mg 21]
(mM) Additive
Annealing temp (8C)a
No. of cyclesb
Mouse adipsin 3.0 PMPEc 55 30
Mouseb-actin 1.5 PMPE 60 24
LAT 2.5 55 18
ICP4 1.5 60 30
tk 4.5 55 30
aIn each case, the melting temperature was 948C and the extension
temper-ature was 728C. Each temperature was held for 1.0 min.
bThe cycle number reflects the relative abundance of a given RNA species. cPMPE, Perfect Match Polymerase Enhancer (Stratagene).
on November 9, 2019 by guest
http://jvi.asm.org/
[image:3.612.312.555.81.166.2]rameters are described in Materials and Methods. (iv)
Quan-titative assays require methods of detection which are
sensi-tive, linear, and quantifiable. PCR products were probed with
specific radiolabeled oligonucleotides and quantified by
Phos-phorImager analysis, which is as sensitive and reproducible as
scintillation counting and has a linear range of 5 orders of
magnitude (32). (v) The accuracy of a quantitative assay is
determined by the reproducibility and variability of the
mea-surement, which together define the quantitative limits of the
assay. The assay for the IE gene, ICP4, is representative of our
QRPCR approach. To ascertain the reproducibility of the
as-say for ICP4, transcription mixtures were prepared from stored
stocks, diluted, reconstituted in 5
m
g of total cellular mouse
brain RNA, and assayed on two separate occasions. On the
second occasion, the transcript dilutions were also
reconsti-tuted with total RNA made from individual uninfected mouse
trigeminal ganglia to test whether any differences in RNA
between these two nervous tissues would affect the assay.
Prod-ucts from these three standard curves were probed and
quan-tified together. As shown in Fig. 3A, the assay was both very
sensitive and highly reproducible. Plotted results of
Phosphor-Imager quantification of these three standard curve
compari-sons (Fig. 3B) show that the assay was linear at this level of
sensitivity on a log-log scale. QRPCR assays of the other gene
sequences also generated linear, sensitive, and reproducible
standard curves (see below). Because there was no
demonstra-ble difference in the sensitivity or specificity of the ICP4 signal,
and because one animal provides more than 40 5-
m
g aliquots
of brain RNA, all subsequent standard curves were
reconsti-tuted in brain RNA.
ICP4
-specific RNA in latently infected ganglia.
The QRPCR
assay was first applied to the ICP4 gene because ICP4 is an
essential gene that is critically required for transcriptional
ac-tivation of E and L genes (16, 53). To determine whether ICP4
RNA was present, and at what level, in latently infected tissue,
the QRPCR assay for ICP4 was applied to mouse trigeminal
[image:4.612.336.530.70.526.2]ganglia latently infected with wild-type (wt) strain KOS or the
tk mutant dlsptk at 30 days p.i. The ICP4 signals were
normal-ized to
b
-actin RNA measured simultaneously. As shown in
Fig. 4 and Table 3 (experiment 1), an ICP4-specific RNA signal
FIG. 2. QRPCR assay flowchart. After removal of an aliquot for DNA anal-ysis, infected ganglion RNA and serial dilutions of synthetic standard RNA reconstituted in uninfected mouse brain RNA were assayed concomitantly as described in the text. Briefly, following DNase treatment, samples were reverse transcribed after a lengthy annealing time with a mixture of downstream (RNA-specific) primers, in the presence or absence of RT (1/2RT). Portions of the resulting cDNA were assayed by PCR for specific cellular and viral genes. PCR products were separated by acrylamide gel electrophoresis, transferred, probed with specific32P-end-labeled oligonucleotides, and quantified by using storage phosphor technology.
FIG. 3. Reproducibility of the QRPCR assay. (A) Autoradiographs of ICP4 standard curves. Three standard reactions were assayed starting with 10-fold dilutions of two different synthetic transcript preparations (transcript mixes 1 and 2) and recombined with either uninfected mouse brain or mouse trigeminal ganglia RNA. The number of ICP4 RNA molecules is expressed as log10; B represents a water blank mixed with cellular RNA. Standards prepared with (1) and without (2) RT are in adjacent lanes. The three standard sets were elec-trophoretically separated, transferred, and probed together for direct compari-son. The 101-nt ICP4-specific product was verified by its migration similar to that of the 100-nt fragment (indicated on the right) offX174 digested with HinfI (not shown). Computer-generated images of this figure and Fig. 5, 7, and 8 were made from autoradiograms by using a Microtek ScanMaker II with Adobe Photoshop and Canvas software on a Macintosh IIci computer. (B) The radiolabeled blots of the standards shown in panel A were quantified by using storage phosphor technology, and the log10values of PhosphorImager units (P.I.U.) were plotted against the log10number of ICP4 RNA molecules. The best-fit lines were gen-erated by linear regression analysis.
on November 9, 2019 by guest
http://jvi.asm.org/
[image:4.612.77.275.73.255.2]was detected in latently infected trigeminal ganglia (8 of 8
wt-infected ganglia and 3 of 10 dlsptk-infected ganglia) at a
level of 1.6
3
10
2to 2.5
3
10
4molecules per ganglion. The
absence of signal in the mock-infected controls demonstrates
that the signal was virus specific. The absence of signal in the
RT-negative controls demonstrates that the positive signal
ob-served in the RT-containing lanes was RNA specific.
Addition-ally, the PCR product was the predicted size for this primer
pair, comigrated with those of both the transcript and DNA
standards, and hybridized specifically with the oligonucleotide
probe which is internal to the primers used to generate the
product. Moreover, restriction digestion with HpaII and BstUI
(not shown) yielded fragment patterns predicted from the
pub-lished sequence (47) and comparable to restriction fragment
patterns of the cDNA and DNA standards (39). These
exper-iments show that RNA specific to ICP4 is present in latently
infected ganglia.
Variability of the
ICP4
signal relative to viral DNA.
To
examine the correlation of the ICP4-specific signal with the
amount of viral DNA, we measured viral DNA and normalized
it to cellular DNA by using PCR analysis of the mouse adipsin
gene, a single-copy gene (33). We found that the ICP4-specific
signal relative to viral DNA varied from 0.01 to 7 RNA
mol-ecules per viral genomes, or 700-fold (Table 3). Three of ten
dlsptk-infected samples were positive for ICP4-specific RNA,
and all had relatively high ratios of ICP4-specific RNA to viral
DNA (1.2, 1.7, and 3.6), but because the amount of dlsptk
DNA per ganglion was 1/10 that of wt DNA per ganglion (2.5
6
0.3 [n
5
8] versus 3.6
6
0.6 [n
5
8]; log
10mean
6
SD, or 3.2
3
10
2versus 4.0
3
10
3), the dlsptk samples in which no
ICP4-specific RNA was detected may contain ICP4-ICP4-specific RNA at
levels below one copy per viral genome. These data show that
the ICP4-specific RNA varied relative to viral DNA by nearly
3 orders of magnitude.
Constant level of LATs relative to viral DNA.
To ascertain
whether the large range of the RNA-to-DNA ratio measured
for ICP4 was specific to a productive-cycle gene in latent
in-fection, we examined whether LATs relative to number of viral
genomes had similar ranges of variabity. LATs were quantified
in wt- and dlsptk-infected ganglia at 30 and 60 days p.i. (Fig. 5
and Table 4). The amount of viral DNA remained constant in
wt-infected ganglia from 30 to 60 days p.i. (4.4
6
0.3 [n
5
6]
versus 4.0
6
0.2 [n
5
6], log
10mean
6
SD, or 2.5
3
10
4
versus
1.0
3
10
4). In dlsptk-infected ganglia, the amount of DNA was
about 1 log unit lower but also remained constant from 30 to
60 days p.i. (3.5
6
0.2 [n
5
7] versus 3.7
6
0.2 [n
5
8], log
10mean
6
SD, or 3.2
3
10
3versus 5.0
3
10
3). The ratio of LAT
to viral DNA was very consistent in both wt- and
dlsptk-in-fected ganglia at 30 days (4.6
6
0.4 [n
5
6] versus 4.6
6
0.4
FIG. 4. ICP4-specific RNA in latently infected ganglia at 30 days p.i. An autoradiogram of a probed blot of ICP4 QRPCR products separated on a 10% polyacrylamide gel is shown. Individual ganglion RNAs were reacted with (1) and without (2) RT and displayed in adjacent lanes. mock, three individual ganglia from animals inoculated with media not containing virus; dlsptk, three individual ganglia from animals inoculated with the tk deletion mutant dlsptk; wt, three individual ganglia from animals inoculated with wt strain KOS; M, molec-ular weight marker (fX174 digested with HinfI and end labeled with32
[image:5.612.58.300.71.151.2]P). The 101-nt ICP4-specific signal (arrow) was detected by probing with oligonucleotide 4-3 and verified upon longer exposure of the molecular weight marker.
TABLE 3. Viral DNA and ICP4-specific RNA content in latently infected mouse trigeminal ganglia at 30 and 60 days p.i.
Virus
30 days p.i. 60 days p.i.
DNA/TGGa RNA/TGGb RNA/DNA DNA/TGG RNA/TGG RNA/DNA
Expt 1, wt (KOS) 4.8 3.0 0.01
3.6 4.4 6.9
3.1 3.9 6.6
3.7 2.9 0.1
2.8 2.4 0.4
3.3 2.4 0.1
3.5 2.9 0.3
3.7 2.2 0.03
dlsptk 2.2 2.8 3.6
2.4 NDc
2.2 2.4 1.7
ND ND
3.0 3.1 1.2
2.4 ND
ND ND
2.8 ND
2.4 ND
2.6 ND
Expt 2, wt (KOS) 4.6 2.7 0.01 4.3 2.7 0.02
4.3 3.7 0.2 4.3 1.9 0.004
4.3 3.6 0.2 3.9 2.3 0.02
4.1 3.6 0.06 4.2 2.8 0.03
4.8 3.3 0.2 3.7 4.2 3.2
4.1 ND 3.9 4.1 1.6
a
Viral DNA per trigeminal ganglion (TGG) normalized to 15mg of cellular DNA (log10molecules).
b
ICP4-specific RNA per trigeminal ganglion normalized to 1010
molecules ofb-actin RNA (log10molecules).
c
ND, not detected.
on November 9, 2019 by guest
http://jvi.asm.org/
[image:5.612.60.550.450.703.2][n
5
7], log
10mean
6
SD, or 4.0
3
10
4
each) and at 60 days
(4.9
6
0.2 [n
5
6] versus 4.3
6
0.4 [n
5
6], log
10mean
6
SD,
or 7.9
3
10
4versus 2.0
3
10
4). These data show that the ratio
of LATs to viral DNA was constant.
ICP4
-specific RNA at different times p.i.
We examined
whether the presence of ICP4-specific RNA at 30 days p.i.
represented RNA left over from the acute phase of ganglionic
infection. This would imply a long half-life (t
1/2) in the context
of latently infected tissue. Using a measured value of 10
8mol-ecules of ICP4-specific RNA per ganglion at 3 days p.i. (acute
infection) (39) and the maximum value measured at 30 days,
2.5
3
10
4molecules, we calculated a theoretical t
1/2
of about 5
days. This calculated t
1/2predicts that no measurable
ICP4-specific RNA would be present by 60 days p.i. To test this,
animals inoculated at the same time were sacrificed at 30 and
60 days p.i. RNA was prepared immediately in each case and
stored in ethanol at
2
80
8
C. After harvest at 60 days, both sets
of samples were assayed together with appropriate standards.
Figure 6 shows samples from each group. The ICP4-specific
RNA values for all samples, normalized to 10
10b
-actin
mole-cules and to viral DNA normalized to 15
m
g of cellular DNA,
are compiled in Table 3 (experiment 2). These data show that
both the absolute amounts and the ranges of ICP4-specific
RNA were indistinguishable at 30 and 60 days p.i.
Further-more, the ICP4-specific RNA-to-viral DNA ratio ranged from
0.01 to 0.2 at 30 days p.i. and from 0.004 to 3.2 at 60 days p.i.,
values which overlap those obtained in experiment 1. Thus, the
ICP4-specific RNA detected in latently infected ganglia does
not appear to be attributable to a long RNA t
1/2.
Strand specificity of the ICP4 signal.
LAT is transcribed
downstream from and on the opposite strand of ICP4 (Fig. 1A)
and is transcribed in abundance during latency (14, 60, 66, 70)
(Table 4). Because of the extreme sensitivity of the QRPCR
assay and the reliance on heat denaturation of the RT without
further purification, the possibility that the ICP4 signal
in-cluded a contribution from the opposite strand, especially from
LAT run-on transcription, was examined. For amplification of
the complementary strand prior to or concomitant with the
PCR, two conditions would be required: there would have to
be residual RT activity after the heat denaturation step, and
there would have to be antisense RNA present in sufficient
abundance to be reverse transcribed under suboptimal
reac-tion condireac-tions of enzyme activity, time, temperature, and
composition. ICP4 antisense transcripts were generated and
quantified. In a reconstruction experiment, ICP4 antisense
transcripts at a molar excess of 10
5-fold antisense to sense
transcripts did not contribute to the ICP4 signal (39). In
addi-tion, we tested whether ICP4-specific RNA was present in
ganglia infected with a mutant which is severely impaired for
expression of LATs. In this experiment, mice were mock
in-fected or inin-fected with wt virus or the LAT promoter mutant
dlLAT1.8 (43) and harvested at 30 days p.i. As shown in Fig.
7A, the ICP4-specific RNA sense signal was detected in
dl-LAT1.8 latently infected ganglia, and the amount per ganglion
and per viral DNA was no less than that found in wt-infected
ganglia (Table 5). We conclude that the ICP4-specific RNA
signal detected in our assay was strand specific.
Does the
ICP4
-specific RNA detected in latently infected
tissue initiate at the
ICP4
promoter?
The finding of RNA
[image:6.612.63.291.69.390.2]specific to the ICP4 gene in latently infected ganglia raises the
possibility of authentic ICP4 expression during latency. To
begin to address this possibility, we examined whether any of
the ICP4-specific RNA that we observed in latently infected
ganglia was consistent with utilization of the ICP4 promoter.
We devised a coamplification PCR assay, using one common
downstream primer and two upstream primers, one within and
one upstream of the ICP4 transcription start site utilized
dur-ing productive infection (59). As depicted in Fig. 1C,
amplifi-cation of DNA would generate two products of 101 and 184
nucleotides (nt) in length, while amplification of RNA
initiat-ing at the ICP4 promoter would yield only the shorter product.
[image:6.612.317.552.69.152.2]FIG. 5. LATs in latently infected ganglia at 30 and 60 days p.i. Autoradio-grams of probed blots of LAT QRPCR products separated on 8% polyacryl-amide gels are shown. Synthetic transcript mixes (A) or individual ganglion RNAs (B and C) were reacted with (1) and without (2) RT and displayed in adjacent lanes. (A) The LAT standard curve. The number of LAT molecules is expressed as log10; B represents a water blank mixed with cellular RNA. The size of the LAT-specific product was 195 nt. M, molecular weight marker as in Fig. 4, with fragment sizes indicated on the right. (B) LAT in latently infected ganglia at 30 days p.i. (C) LAT in latently infected ganglia at 60 days p.i. For definitions of mock, dlsptk, and wt, see the legend to Fig. 4. The 195-nt LAT-specific signal was detected by probing with oligonucleotide L-3.
FIG. 6. ICP4-specific RNA in latently infected ganglia at 30 and 60 days p.i. (d.p.i.). An autoradiogram of a probed blot of ICP4 QRPCR products separated on a 10% polyacrylamide gel is shown. Individual ganglion RNAs were reacted with (1) and without (2) RT and displayed in adjacent lanes. Six individual ganglia from animals infected with wt strain KOS are shown. mock, as in Fig. 4; M, molecular weight marker as in Fig. 4. The 101-nt ICP4-specific signal (arrow) was detected by probing with oligonucleotide 4-3 and verified as for Fig. 4.
on November 9, 2019 by guest
http://jvi.asm.org/
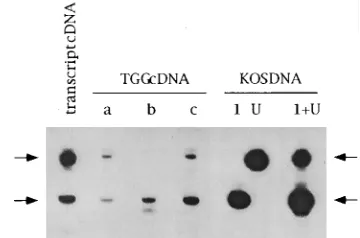
Coamplification was possible from both HSV DNA and cDNA
made from the transcription standard (Fig. 8). This assay was
applied to three 30-day-p.i. wt-infected ganglion samples in
which an ICP4-specific RNA signal had been measured. In two
of the samples, both the 101- and 184-nt products were
present. The 184-nt product shows that RNA initiating
up-stream of the ICP4 promoter was present, while the 101-nt
product could correspond to either RNA initiating at the ICP4
promoter or RNA initiating upstream from the ICP4 promoter
or both. In one of three samples tested, the signal included
only the 101-nt product, consistent with initiation at the ICP4
promoter. This finding provides evidence that in latency, ICP4
promoter-specific initiation of the ICP4-specific RNA can
oc-cur in the absence of read-through transcription.
Correlation of
ICP4
-specific and
tk
-specific RNA in latently
infected tissue.
E genes, such as tk, are targets for ICP4
trans-activation (16, 53). We applied the QRPCR assay for tk to
determine whether any tk-specific RNA could be measured in
latently infected ganglia RNA and by measuring ICP4-specific
RNA in the same samples to determine if there was a
corre-lation. The tk assay was less sensitive than the assay for ICP4,
probably because of a combination of lower efficiencies in
reverse transcription and PCR amplification. In addition, we
occasionally encountered the presence of a low-level positive
signal in the RT-minus reactions. When compared with the
DNA standard curve, the positive signal indicated
contamina-tion at the level of single molecules of DNA. This was possibly
due to PCR product carryover or incomplete DNase digestion
of viral genomic DNA in the RNA preparation. As shown in
Fig. 7B and Table 5, we did detect tk-specific RNA in ganglia
at 30 days p.i. at a level up to 500 molecules per viral genome.
By comparing Fig. 7A with Fig. 7B, a correlation between the
two can be seen. Linear regression analysis applied to the
quantified normalized values generated the following
relation-ship: log
10tk
5
3.0
1
0.68 log
10ICP4; r
25
0.79 (Fig. 7C).
These results show that the amount of tk-specific RNA and
ICP4-specific RNA correlated in latently infected mouse
tri-geminal ganglia over a 2-log-unit range.
DISCUSSION
We have developed a PCR-based assay for detection and
quantification of selected HSV-1 transcripts from individual
mouse ganglia. We found that (i) ICP4-specific RNA of the
correct strand is present in latent infection at 30 and 60 days
p.i., (ii) some of the ICP4-specific RNA initiates in a region
that is consistent with the ICP4 promoter, (iii) ICP4-specific
RNA expression fluctuates widely from ganglion to ganglion,
(iv) tk-specific RNA is also present in latent infection, and (v)
a correlation is seen between the ICP4-specific and the
tk-specific RNAs. We discuss the assay that we used and the
potential significance of our findings for gene expression
dur-ing latency.
Parameters of the QRPCR assay.
We chose to develop a
QRPCR assay with external standards rather than utilize a
competitive strategy such as that used by Ramakrishnan et al.
(57). Either method is capable of great sensitivity, but the
competitive approach requires dividing each sample into many
portions to quantify a single gene sequence, while the external
standard approach permits dividing each sample into several
portions for measurement of many different gene sequences
and therefore yields more information per individual sample.
Essential factors in the success of the assay included
maximiz-ing RNA recovery, sensitivity, and specificity. To maximize
RNA recovery, we rapidly collected tissue into liquid nitrogen
and used the GTC-CsCl method. We assayed the 5
9
ends of
target RNAs to hedge against 3
9
-to-5
9
exonuclease
degrada-tion. To maximize sensitivity, we used a long annealing time for
priming reverse transcription to permit hybridization with rare
RNA. In our hands, sensitivity was improved over 10-fold by
using specific primers rather than random primers (48).
Re-constituting synthetic RNA standards with cellular RNA
con-trolled for nonspecific amplification of and/or competition by
cellular sequences. Use of a radiolabeled probe maximized
detection of a specific PCR product. We used mock-infected
and RT-negative samples to control for contamination. We
conclude that RNA containing the sequence which this assay
amplifies is present in latently infected tissue.
Is
ICP4
RNA transcribed during latency?
Although we
clearly detect RNA specific to the ICP4 gene during latency,
our results do not permit us to conclude that these transcripts
are identical to the ICP4 mRNA prevalent in productively
infected cells. Three results, however, point in that direction:
(i) the RNA is the correct polarity, (ii) in at least some of the
ganglia, it appears to initiate in a manner consistent with
uti-TABLE 4. Viral DNA and LAT content in latently infected mouse trigeminal ganglia at 30 and 60 days p.i.
Virus 30 days p.i. 60 days p.i.
DNA/TGGa
LATs/TGGb
LATs/DNAc
DNA/TGG LATs/TGG LATs/DNA
dlsptk 3.3 8.5 5.2 3.2 8.2 5.0
3.6 7.8 4.1 3.5 8.1 4.6
3.8 8.1 4.3 4.0 7.8 3.8
3.5 8.4 4.9 3.8 7.7 3.9
3.4 7.7 4.3 3.8 8.1 4.3
3.3 8.2 4.9 3.6 7.9 4.3
NDd 8.0 3.7 8.2 4.5
3.1 7.8 4.7 3.8 8.0 4.2
wt (KOS) 4.6 8.6 4.0 4.3 9.2 4.9
4.3 8.8 4.5 4.3 9.0 4.7
4.3 9.1 4.8 3.9 8.8 4.9
4.1 8.9 4.8 4.2 8.9 4.7
4.8 9.2 4.4 3.7 8.8 5.1
4.1 9.4 5.3 3.9 9.0 5.1
a
Viral DNA per trigeminal ganglion (TGG) normalized to 15mg of cellular DNA (log10molecules).
b
LATs per trigeminal ganglion normalized to 1010
molecules ofb-actin RNA (log10molecules).
c
Ratio expressed in log10.
d
ND, not detected.
on November 9, 2019 by guest
http://jvi.asm.org/
[image:7.612.56.556.531.693.2]lization of the ICP4 promoter, and (iii) its expression positively
correlates with expression of tk-specific RNA.
In certain ganglia, some of the ICP4-specific transcripts
ini-tiate upstream of the ICP4 promoter. These transcripts might
conceivably correspond to RNA detected in productively
in-fected cells (27), which is 3
9
coterminal with ICP4 and of the E
kinetic class.
A second issue is whether these transcripts arise from de
novo transcription during latency. Our results comparing
tran-script levels at 3, 30, and 60 days p.i. (Fig. 6 and reference 39)
argue against these RNAs merely being carried over from
acute infection. Additionally, we find substantial amounts of
ICP4-specific RNA in ganglia latently infected with dlsptk,
which does not abundantly express ICP4 RNA during acute
ganglionic infection (36, 39). Assuming, then, that the
ICP4-specific RNA is the product of transcription during latency, the
issue becomes whether its existence represents transcriptional
noise, i.e., very low level, possibly nonspecific transcriptional
events. This is especially possible in those ganglia in which the
ratio of ICP4-specific RNA to DNA is very low (
,
0.1).
How-ever, it is difficult to invoke noise to explain the
;
20% of
ganglia in which the ratio is fairly high (
.
1), especially
con-sidering that this RNA signal could be derived from one or a
few cells. Given a value of about 100 to 200 latently infected
cells per mouse trigeminal ganglion infected with HSV-1 KOS
or KOS(M) via corneal scarification, as measured by reporter
gene (lacZ) expression of
b
-galactosidase (13, 62) or by LAT
in situ hybridization analysis (38), and our viral DNA values
(Tables 3 to 5), we can estimate a copy number of about 100
viral genomes per infected cell. If the ICP4-specific RNA is
derived from a single cell, the ratio of ICP4 transcripts to viral
genomes could be
.
100.
If
ICP4
RNA is transcribed during latency, is active protein
expressed?
Our assay permits measurement of transcripts for
[image:8.612.55.561.70.298.2]several genes from the same sample. We chose to assay for tk
because tk transcription is dependent upon ICP4 activation.
ICP4 induces a 30-fold increase in tk RNA expression in the
context of productive infection (29, 30). There was a strong
positive correlation (r
5
0.79) between the amounts of
ICP4-specific and tk-ICP4-specific RNAs. Interpretations of this
correla-tion include the following: (i) there is a casual relacorrela-tionship
FIG. 7. Strand specificity and correlation of expression of ICP4-specific RNA and tk-specific RNA in ganglia latently infected with wt or dlLAT1.8. (A and B) Autoradiograms of probed blots of QRPCR products separated on 10% (A) and 12% (B) polyacrylamide gels. Individual ganglion RNAs were reacted with (1) and without (2) RT and displayed in adjacent lanes. (A) ICP4-specific RNA. The 101-nt ICP4-specific product (arrow) was detected by probing with oligonucleotide 4-3 and verified as for Fig. 4 (molecular weight marker not shown). (B) tk-specific RNA from the samples shown in panel A. The 60-nt tk-specific product (arrow) was detected by probing with oligonucleotide tk-3. M, molecular weight marker as in Fig. 4; mock and wt, as in Fig. 4; dlLAT1.8, individual ganglia from animals inoculated with the LAT promoter deletion mutant dlLAT1.8 (43). In some RT2lanes, signal was detected at a level which was always less than 10% that detected in the corresponding RT1lanes. Higher-molecular-weight bands seen in the RT1lanes are present in mock-infected and virus-infected samples and comigrate with a band visible by ethidium bromide staining; thus, they represent abundant products arising from cellular sequences and exhibiting weak complementarity to the tk-specific probe. (C) tk-specific RNA per trigeminal ganglion (TGG) plotted against ICP4-specific RNA per trigeminal ganglion, both normalized tob-actin RNA as described in the text and expressed in log10(data from Table 5; best-fit plotted line generated by linear regression of log10values).
FIG. 8. Assay to determine the 59limit of ICP4-specific RNA detected in latently infected ganglia. Coamplification of longer (184 nt; upper arrows) and shorter (101 nt; lower arrows) PCR products with a common downstream primer (4-2) and two upstream primers, one situated 59of the transcript start site (4-U) and the other situated within the 59mRNA leader region (4-1), as diagramed in Fig. 1C. Lanes from the left: coamplification using plasmid pKS159ICP4 derived cDNA; coamplification of cDNA from three individual latently infected trigem-inal ganglia (TGG), a, b, and c; amplification of KOS strain HSV DNA with 4-2 and only 4-1 (1), only 4-U (U), or both (11U).
on November 9, 2019 by guest
http://jvi.asm.org/
[image:8.612.341.521.531.650.2](that is, the ICP4-specific RNA encodes a protein that induces
tk-specific RNA expression) and (ii) the levels of transcript
accumulation are higher in the same ganglia because of some
general increase in transcriptional activity. Although we cannot
rule out the second interpretation, it is interesting to entertain
the first. If there is a causal relationship, it could occur
throughout the particular ganglia, resulting from a global
sig-nal, or it could occur in one or a few latently infected cells. Is
the measured amount of ICP4-specific RNA sufficient for
physiologic activity? We think that it is, in particular if only one
or a few cells account for most of the signal. If only one or a
few cells contain most of the ICP4-specific RNA, then there
could be up to 4
3
10
4ICP4-specific RNA molecules in that
latently infected cell, which is probably sufficient for
physio-logically relevant ICP4 expression and activity.
A third intrepretation for the finding of ICP4-specific RNA
in latency is that ICP4 plays a role in maintaining latency as a
result of its ability to transrepress IE genes (50) or regulate
LATs (58). However the correlation of ICP4-specific RNA
with tk-specific RNA tends to argue against this interpretation.
We favor the hypothesis that transient or low-frequency
ex-pression of ICP4 leads to E gene transcription in some
pro-portion of latently infected ganglia.
If active ICP4 protein is expressed during latency, does this
imply low-level viral replication?
Our results raise this
possi-bility. In the natural human host and in animal models which
exhibit spontaneous reactivation, replication in neurons
pre-sumably precedes appearance of virus in that
replication-de-pendent L genes encode virion components. ICP4 antigen has
been detected in latently infected rabbit ganglia (25), and the
rabbit model is known to exhibit spontaneous reactivation (40).
However, the published record provides no evidence for
rep-lication or spontaneous reactivation in mice. In our model
system, CD-1 mice, infection with KOS or another virus with
wt growth and reactivation characteristics, 0 of 18 ganglia
con-tained infectious virus at the time of explant at 28 days p.i. (42).
We compared quantitative measurements from various
re-ports, limited to mouse trigeminal ganglia infected via corneal
scarification but including several virus strains and mouse
strains. In a total of 131 ganglia, no infectious virus was found
at the time of explant, which was from 11 to 115 days p.i. (41,
49, 63, 75). Other reports in which the number of negative
controls was not stated document the same negative result (15,
19, 65, 66, 67). To determine whether low-level infectious virus
was present but not detected by plaque assay because of
phys-ical entrapment by some cellular or tissue component, we
performed the following test. Fifty PFU of wt virus was mixed
with uninfected trigeminal ganglia tissue homogenates before
or after freeze-thawing and sonication; we recovered similar
numbers of PFU under all conditions (39). This result shows
that physical association of virus with cellular components
made accessible by tissue disruption does not prevent
detec-tion of infectious virus by plaque assay. However, mixing
ex-tracellular virus with tissue homogenate is not identical to
intracellular virus released by homogenization, so very low
frequency reactivation may remain undetected by plaque assay
of ganglionic homogenates. In addition, a recent report raises
the possibility that noninfectious nucleocapsids are axonally
transported separately from glycoproteins and enveloped in
distal regions of the axon (51).
[image:9.612.58.557.83.191.2]HSV maintains divergent goals of preserving latency while
permitting low-frequency reactivation. As discussed by Hill
(26), the operational definition of reactivation is the detection
of infectious virus from latently infected tissue. The process
whereby a stably latent viral genome generates an infectious
particle is not known. Investigators generally acknowledge that
complex host and viral features regulate latency and
reactiva-tion. Some have discussed reactivation as the inevitable
con-sequence of a single event, a switch, invoking the lytic cascade
of IE, E, and L genes as resulting from the triggering of such
a switch (63, 70, 78). In the context of latent infection, it has
been suggested that IE gene expression may constitute a switch
initiating the lytic cascade leading to reactivation (34, 45, 48).
A cascade is a series of reactions whereby each reaction is
necessary and sufficient for, and may augment, the subsequent
reaction. In contrast, Kosz-Vnenchak et al. (37) proposed that
reactivation requires more than turning on IE genes, and
Bloom et al. (4) addressed the possibility that reactivation
occurs in stages. We suggest that the process of reactivation is
more of an uphill climb than the downhill process suggested by
the word ‘‘cascade.’’ Each specific step of expression of viral
components would be necessary but not sufficient for progress
to the subsequent step. Progress from one step to the next
would occur only at some low frequency. The following
sce-nario is offered to illustrate this suggestion. (i) Most latently
infected ganglia contain various low levels of virus-specific
RNAs other than LATs, for example as shown in this report,
but do not express sufficient IE RNA to generate
physiologi-cally relevant levels of protein. (ii) A percentage of latently
infected cells are perturbed in some manner, such as through
trophic factor signalling pathways (64) or metabolic insults (21,
41, 72), to express specific IE proteins which can transactivate
E genes to a limited extent. (iii) A percentage of cells
contain-ing some E RNAs accumulate sufficient relative amounts of all
necessary E proteins to threshold levels to permit limited
rep-lication. Host-specific (4, 57), tissue-specific (67),
cell-type-specific (34, 45, 46, 76), and virus strain-cell-type-specific (24) factors
may affect the kinetics of any intermediate step. For example,
TABLE 5. Viral DNA and ICP4-specific and tk-specific RNA content in latently infected mouse trigeminal ganglia at 30 days p.i.Virus DNA/TGGa ICP4 tk tk/ICP4
RNA/TGGb RNA/DNA RNA/TGGb RNA/DNA
wt (KOS) 3.7 3.0 0.2 5.2 33 160
4.1 3.9 0.6 5.8 49 79
3.8 2.5 0.05 4.6 7 130
3.1 NDc ND
dlLAT1.8 4.4 4.3 0.8 5.5 13 16
3.8 4.6 6.3 6.5 510 79
3.8 2.2 0.03 ND
3.9 2.4 0.04 ND
aViral DNA per trigeminal ganglion (TGG) normalized to 15mg of cellular DNA (log
10molecules).
bHSV-specific RNA per trigeminal ganglion normalized to 1010molecules ofb-actin RNA (log
10molecules).
cND, not detected.
on November 9, 2019 by guest
http://jvi.asm.org/
step iii, limited replication, may be permitted at a much lower
frequency in mice than in humans. (iv) Once limited
replica-tion ensues, a replicareplica-tion-dependent viral funcreplica-tion may
up-regulate IE expression, leading to the lytic cascade and
pro-duction of viral particles, as suggested by Kosz-Vnenchak et al.
(36, 37). Such a function may be an L gene or it may be that
replication alters the nucleosome-associated DNA (18) in a
manner which alters the program of gene expression (79).
Early steps in replication as well as subsequent steps such as
axonal transport and peripheral infection may be subject to
broader host controls, such as the immunologic state. Thus, the
kinetic pattern of the HSV replication cycle may be viewed as
series of steps mounting to reactivation rather than as a
down-hill cascade in the context of infection of nervous tissue.
ACKNOWLEDGMENTS
We thank David Knipe, Magdalena Kosz-Vnenchak, and David Leib for communicating unpublished results; Shigeru Sakiyama for providing plasmid pSPMbA1; David Knipe for providing plasmid pK1-2; Charles Hwang for providing plasmid pSVtk; Priscilla Schaffer for providing plasmid pRFS and HSV mutant dlLAT1.8; Jennie Ja-cobson for advice on animal protocols; Paul Digard and Charles Hwang for helpful discussions on transcription; Ethan Bodin for initial work in QRPCR; and Lynda Morrison for invaluable discussions on viral latency. We thank Larry Feldman for suggestions which led to the LAT2and antisense experiments. David Knipe is especially appreci-ated for critical review of the manuscript.
This research was supported by NIH grant PO1 AI24010. M.F.K. was supported in part by a fellowship from the Albert J. Ryan Foun-dation.
REFERENCES
1. Arrigo, S. J., S. Weitsman, J. D. Rosenblatt, and I. S. Y. Chen. 1989. Analysis of rev gene function on human immunodeficiency virus type 1 replication in lymphoid cells by using a quantitative polymerase chain reaction method. J. Virol. 63:4875–4881.
2. Ausubel, F. M., R. Brent, R. E. Kingston, D. D. Moore, J. A. Smith, J. G.
Seidman, and K. Struhl (ed.).1994. Current protocols in molecular biology. John Wiley & Sons, Inc., New York.
3. Baringer, J. R., and P. Swoveland. 1973. Recovery of herpes-simplex virus from human trigeminal ganglions. N. Engl. J. Med. 288:648–650. 4. Bloom, D. C., G. B. Devi-Rao, J. M. Hill, J. G. Stevens, and E. K. Wagner.
1994. Molecular analysis of herpes simplex virus type 1 during epinephrine-induced reactivation of latently infected rabbits in vivo. J. Virol. 68:1283– 1292.
5. Chirgwin, J. J., A. E. Przybyla, R. J. MacDonald, and W. J. Rutter. 1979. Isolation of biologically active ribonucleic acid from sources enriched in ribonuclease. Biochemistry 18:5294–5299.
6. Chou, Q., M. Russell, D. E. Birch, J. Raymond, and W. Bloch. 1992. Pre-vention of pre-PCR mis-priming and primer dimerization improves low-copy-number amplifications. Nucleic Acids Res. 20:1717.
7. Coen, D. M., H. E. Fleming, Jr., L. K. Leslie, and M. J. Retondo. 1985. Sensitivity of arabinosyladenine-resistant mutants of herpes simplex virus to other antiviral drugs and mapping of drug hypersensitivity mutations to the DNA polymerase locus. J. Virol. 53:477–488.
8. Coen, D. M., M. Kosz-Vnenchak, J. G. Jacobson, D. A. Leib, C. L. Bogard,
P. A. Schaffer, K. L. Tyler, and D. M. Knipe. 1989. Thymidine kinase-negative herpes simplex virus mutants establish latency in mouse trigeminal ganglia but do not reactivate. Proc. Natl. Acad. Sci. USA 86:4736–4740. 9. Cook, M. L., V. B. Bastone, and J. G. Stevens. 1974. Evidence that neurons
harbor latent herpes simplex virus. Infect. Immun. 9:946–951.
10. Croen, K. D., J. M. Ostrove, L. Dragovic, and S. E. Straus. 1991. Charac-terization of herpes simplex virus type 2 latency-associated transcription in human sacral ganglia and in cell culture. J. Infect. Dis. 163:22–28. 11. Croen, K. D., J. M. Ostrove, L. J. Dragovic, J. E. Smialek, and S. E. Straus.
1987. Latent herpes simplex virus in human trigeminal ganglia: detection of an immediate early gene ‘‘anti-sense’’ transcript by in situ hybridization. N. Engl. J. Med. 317:1427–1431.
12. Croen, K. D., J. M. Ostrove, L. J. Dragovic, and S. E. Straus. 1988. Patterns of gene expression and sites of latency in human nerve ganglia are different for varicella-zoster and herpes simplex viruses. Proc. Natl. Acad. Sci. USA
85:9773–9777.
13. Davar, G., M. F. Kramer, D. Garber, A. L. Roca, J. K. Andersen, W. Bebrin,
D. M. Coen, M. Kosz-Vnenchak, D. M. Knipe, X. O. Breakefield, and O. Isacson. 1994. Comparative efficacy of expression of genes delivered to
mouse sensory neurons with herpes virus vectors. J. Comp. Neurol. 393:3–11. 14. Deatly, A. M., J. G. Spivack, E. Lavi, and N. W. Fraser. 1987. RNA from an immediate early region of the type 1 herpes simplex virus genome is present in the trigeminal ganglia of latently infected mice. Proc. Natl. Acad. Sci. USA
84:3204–3208.
15. Deatly, A. M., J. G. Spivak, E. Lavi, D. R. O’Boyle II, and N. W. Fraser. 1988. Latent herpes simplex virus type 1 transcripts in peripheral and central nervous system tissues of mice map to similar regions of the viral genome. J. Virol. 62:749–756.
16. DeLuca, N. A., A. McCarthy, and P. A. Schaffer. 1985. Isolation and char-acterization of deletion mutants of herpes simplex virus type 1 in the gene encoding immediate-early regulatory protein ICP4. J. Virol. 56:558–570. 17. DeLuca, N. A., and P. A. Schaffer. 1987. Activities of herpes simplex virus
type 1 (HSV-1) ICP4 genes specifying nonsense peptides. Nucleic Acids Res.
15:4491–4510.
18. Deshmane, S. L., and N. W. Fraser. 1989. During latency, herpes simplex virus type 1 DNA is associated with nucleosomes in a chromatin structure. J. Virol. 63:943–947.
19. Devi-Rao, G. B., D. C. Bloom, J. G. Stevens, and E. K. Wagner. 1994. Herpes simplex type 1 DNA replication and gene expression during explant-induced reactivation of latently infected murine sensory ganglia. J. Virol. 68:1271– 1282.
20. Ecob-Prince, M. S., F. J. Rixon, C. M. Preston, K. Hassan, and P. G. E.
Kennedy.1993. Reactivation in vivo and in vitro of herpes simplex virus from mouse dorsal root ganglia which contain different levels of latency-associated transcripts. J. Gen. Virol. 74:995–1002.
21. Fawl, R. L., and B. Roizman. 1993. Induction of reactivation of herpes simplex virus in murine sensory ganglia in vivo by cadmium. J. Virol. 67: 7025–7031.
22. Ferre, F. 1992. Quantitative or semi-quantitative PCR: reality versus myth. PCR Methods Appl. 2:1–9.
23. Gordon, Y. J., B. Johnson, E. Romanowski, and T. Araullo-Cruz. 1988. RNA complementary to herpes simplex virus type 1 ICP0 gene demonstrated in neurons of human trigeminal ganglia. J. Virol. 62:1832–1835.
24. Gordon, Y. J., J. L. C. McKnight, J. M. Ostrove, E. Romanowski, and T.
Araullo-Cruz.1990. Host species and strain differences affect the ability of an HSV-1 ICP0 deletion mutant to establish latency and spontaneously reacti-vate in vivo. Virology 178:469–477.
25. Green, M. T., R. J. Courtney, and E. C. Dunkel. 1981. Detection of an immediate early herpes simplex virus type 1 polypeptide in trigeminal gan-glia from latently infected animals. Infect. Immun. 34:987–992.
26. Hill, T. J. 1982. Herpes simplex virus latency, p. 175–240. In B. Roizman (ed.), The herpesviruses, vol. 3. Plenum, New York.
27. Hubenthal-Voss, J., L. Starr, and B. Roizman. 1987. The herpes simplex virus origins of DNA synthesis in the S component are each contained in a transcribed open reading frame. J. Virol. 61:3349–3355.
28. Hwang, C. B. C., B. Horsburgh, E. Pelosi, S. Roberts, P. Digard, and D. M.
Coen.1994. A net11 frameshift permits synthesis of thymidine kinase from a drug-resistant herpes simplex virus mutant. Proc. Natl. Acad. Sci. USA
91:5461–5465.
29. Imbalzano, A. N., D. M. Coen, and N. A. DeLuca. 1991. Herpes simplex virus transactivator ICP4 operationally substitutes for the cellular transcription factor Sp1 for efficient expression of the viral thymidine kinase gene. J. Virol.
65:565–574.
30. Imbalzano, A. N., and N. A. DeLuca. 1992. Substitution of a TATA box from a herpes simplex virus late gene in the viral thymidine kinase promoter alters ICP4 inducibility but not temporal expression. J. Virol. 66:5453–5463. 31. Irmiere, A. F., M. M. Manos, J. G. Jacobson, J. S. Gibbs, and D. M. Coen.
1989. Effect of an amber mutation in the herpes simplex virus thymidine kinase gene on polypeptide synthesis and stability. Virology 168:210–220. 32. Johnston, R. F., S. C. Pickett, and D. L. Barker. 1990. Autoradiography using
storage phosphor technology. Electrophoresis 11:355–360.
33. Katz, J. P., E. T. Bodin, and D. M. Coen. 1990. Quantitative polymerase chain reaction analysis of herpes simplex virus DNA in ganglia of mice infected with replication-incompetent mutants. J. Virol. 64:4288–4295. 34. Kemp, L. M., and D. S. Latchman. 1989. Regulated transcription of herpes
simplex virus immediate-early genes in neuroblastoma cells. Virology 171: 607–610.
35. Knotts, F. B., M. L. Cook, and J. G. Stevens. 1974. Pathogenesis of herpetic encephalitis in mice after ophthalmic inoculation. J. Infect. Dis. 130:16–27. 36. Kosz-Vnenchak, M., D. M. Coen, and D. M. Knipe. 1990. Restricted expres-sion of herpes simplex virus lytic genes during establishment of latent infec-tion by thymidine kinase-negative mutant viruses. J. Virol. 64:5396–5402. 37. Kosz-Vnenchak, M., J. Jacobson, D. M. Coen, and D. M. Knipe. 1993.
Evidence for a novel regulatory pathway for herpes simplex virus gene expression in trigeminal ganglion neurons. J. Virol. 67:5383–5393. 38. Kosz-Vnenchak, M., and D. M. Knipe (Harvard Medical School). 1994.
Personal communication.
39. Kramer, M. F., and D. M. Coen. 1994. Unpublished observations. 40. Laibson, P. R., and S. Kibrick. 1969. Recurrence of herpes simplex virus in
rabbit eyes: results of a three-year study. Invest. Ophthalmol. 8:346–350. 41. Laycock, K. A., S. F. Lee, R. H. Brady, and J. S. Pepose. 1991.