Brussels, 1 August 1990
$ECOND REPORT ON
THE THIRD JOINT PROGBAHME POR. TH! EXCHANGE OF YOURG WOIKEBS
1988 - 1989
SECOND REPORT ON THE THIRD JOINT PROGRAMME FOR THE EXCHANGE OF YOUNG WORKERS
1988 - 1989
1. INTRODUCTION
1.1. The "Thud Joint Programme to Encourage the Exchange of Young Workers wlthin the Communlty" was adopted by the Council 1n 1ts decis1on of 13 December 1984 and covers the period 1985-1990.
1.2. The Third Joint Programme is the latest version of the oldest Comrnun1ty youth mobility programme, launched 1n 1964 and based on Article 50 of the Treaty of Rome. Var1ous other youth mobility programmes have been establlshed s1nce, in part1cular COMETT, ERASMUS, and most recently, LINGUA.
1.3. The programme of exchanges for young workers provides an opportun1ty for part1c1pation 1n a Commun1ty scheme offering experience of living and working condit1ons 1n other Member States. fostering the skills. necessary for adult and working l1fe 1ncluding the development of vocational knowledge and practical skills as well as the sk1lls of interpersonal communicat1on between 1nd1viduals from d1fferent cultural backgrounds - and enabling partic1pants to find 1nterests in common with young people from other Member States and, above all. to develop their awareness of a shared European identity.
2. ADMINISTRATION
2.2. EXCHANGE ORGANISERS
2.2.1. Exchange organisers have the responsibility of organ1s1ng and implementlng the exchanges, and so remain the most important element in the structural framework supported by the Commission. The relationship between the Commission and each organiser is governed by contracts covering the individual exchange projects. These contracts define the cond1tions for implementing the exchanges, the obligat1ons of the body or group involved and ,the financial respons1bil1ties.
2.2.2. The majority of exchange organisers fall into two categories - those operat1ng at European level and those operating primarily at national level but which have acquired a Community dimension. The organ1sers are principally involved in exchange programmes. vocat1onal train1ng programmes or a variety of social. cultural and educational projects aimed at target groups from particular professional or industrial sectors which have been networking for the purpose of developing exchanges of young people. This wide range of organ1sations has greatly contributed to the variety of sectors 1n wh1ch exchanges have been run within the programme.
2.2.3. In 1988 18 organisations received grants and in 1989 a total of 29
organisations received grants for Young Workers' Exchanges.
2.2.4. In 1988/89. there were three meetings with exchange organisers involved in the programme
23 March 1988 :
24/27 September 1988
2&/27 October 1989
a one day meeting in Brussels to clarify the existing administrative procedures w1th exchange organisers.
a "brainstorming meeting" at Lago c
Maggiore. Italy. with the purpose of gathering together both represent-atives of the main organisers and a number of outside experts to discuss :
*
options for the long-term deve-lopment of the programme and*
guidelines for the two remaining years of the Third Programme.a two-day meeting in Brussels to discuss the administrative and fi-nancial aspects of the programme for
3
2.3. NATIONAL COORDINATORS
2.3.1. The Commission 1s particularly anxious that exchange organisers liaise with the national coordinators to discuss exchange plans, and they are required to send a copy of each project submitted to the Commission to the national coordinators concerned.
2.3.2. A meeting was held with the national coordinators in Brussels on 24 October 1988 to inform them of developments and to outline the perspectives of the Fourth Programme.
3. PRACTICAL RESULTS 1988 - 1989
3.1. The programme 1s open to young age. who are e1ther employed or have completed basic vocational experience.
people between ava1lable for
18 and 28 years of employment, and who or have similar work traintng
3.2. The exchanges range from the short-term, last1ng 3 weeks to 3 months and which include study vislts, work placements and a brief experience of the working environment, to the longer term, lasting 4 to 16 months and which are mainly work placements preceded by a language and orientation course.
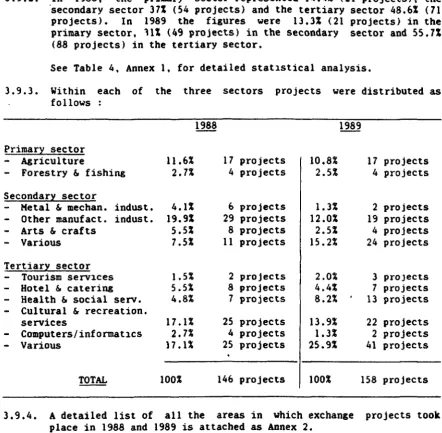
3.3. From 1986 to 1988 the annual budget for the programme remained at 4.5 mio ECUs and in 1989 there was an increase of 500.000 ECUs to 5 mio ECUs. Despite this situation, the number of participants has increased from 2304 in 1987 to 2676 in 1988 and approximately 3044 (11 in 1989 and the number of granted projects has increased from 146 in 1988 to 158 in 1989. It should also be noted that, in 1989, the flat-rate contributtons per participant per week were increased by 10 ECUs allowing for an increase in the grant per participant per week.
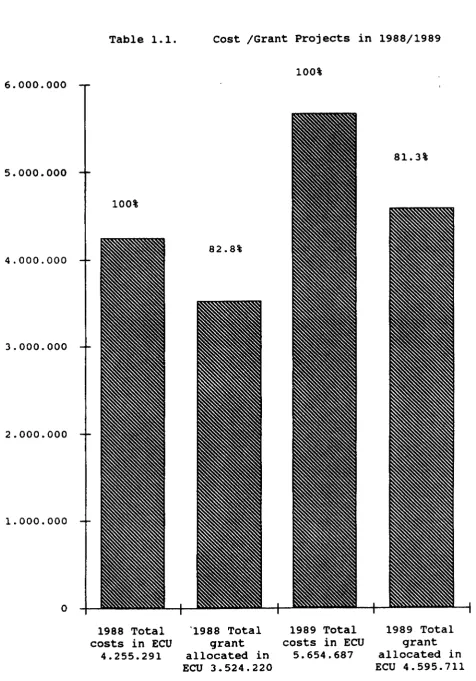
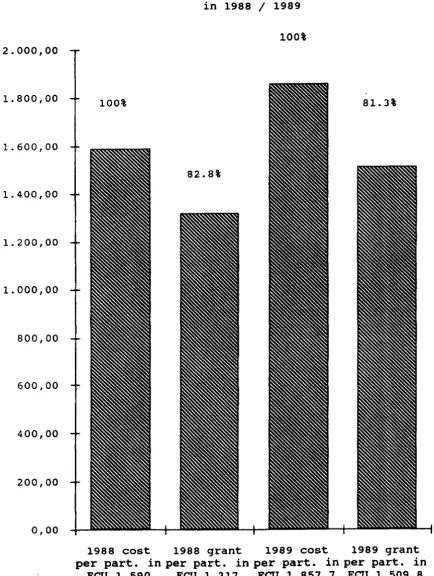
3.4. The average cost per participant per week in 1988 amounted to 141 ECUs and in 1989 this amount has increased to 168.9 ECUs, while the average grant per participant per week increased from 117 ECUs in 1988, to 137.3 ECUs in 1989.
3,5. The slight 1ncrease in both average cost and grant reflects,·on the one hand, the ab1lity of organisers to reduce costs and, on the other, the abiltty of some organisers - essentially those new to the programme - to secure other sources of income and thus reduce the grant required.
See Table 1, Annex 1, for detailed statistical analysis.
3.6. Projects are, in principle, approved beginning of and in June of each year. of allowing for a mid-year funding Commiss1on of any under-utilization funds can therefore be recuperated other projects.
on a biannual basis - at the This system has the advantage rev1ew. Organisers inform the of grants allocated; excess immediately and allocated to
3. 7. SHORT-TERM AND LONG-TERM EXCHANGES
3.7.1. As the Council Decision stipulates, exchanges short-term and long-term projects, each having objectives withln the overall guidelines.
are divided into its own particular
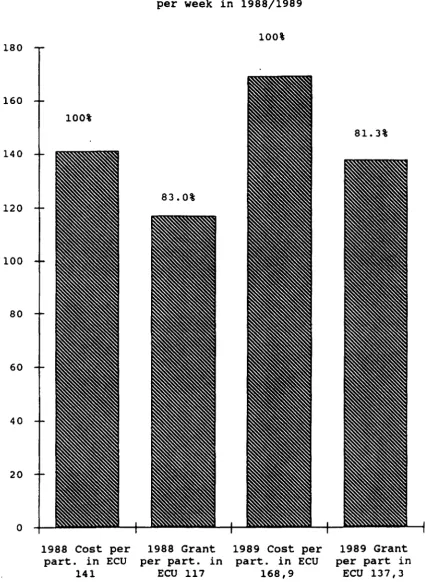
3.7.2. In 1988 and 1989 there was a decline in long-term exchanges. This is a result of several factors
Increasing difficulty In finding work placements In general, and particularly for foreign nationals in the different Member States.
Reluctance of young people who are employed to leave jobs, albeit temporarily, to partiCipate In the Programme.
An increase of "medium-term" exchanges, usually of 13-16 weeks' duration and often preceded by a very short language course. These combine the objectives of short-term and long-term exchanges, while many of the difficulties involved in the long-term programmes are eliminated.
3~7.3. The Commission Will, of course, continue to promote both types of exchange while ensuring that the programme Is open to the maximum number of young people possible, and that a relative balance is maintained between the economic sectors In which exchanges take place.
See Table 2, Annex l, for detailed statistical analysis. 3.8. GEOGRAPHICAL DISTRIBUTION
3.8.1. There is still a degree of over-concentration at the centre of the Community; however, efforts to redress this Imbalance are proving successful, and one of the priorities of the programme is to encourage the participation of young people from peripheral or disadvantaged regions.
3.8.2. The Commission endeavours to ensure a general balance between the number of young workers received and those sent abroad on exchanges from each Member State. This principle of balance operates· for the maJOritY of exchanges and the CommiSSIOn is anxious that it continues to underpin the bas1c a1ms of the programme wherever feasible.
5
3.9. SECTORAL DISTRIBUTION
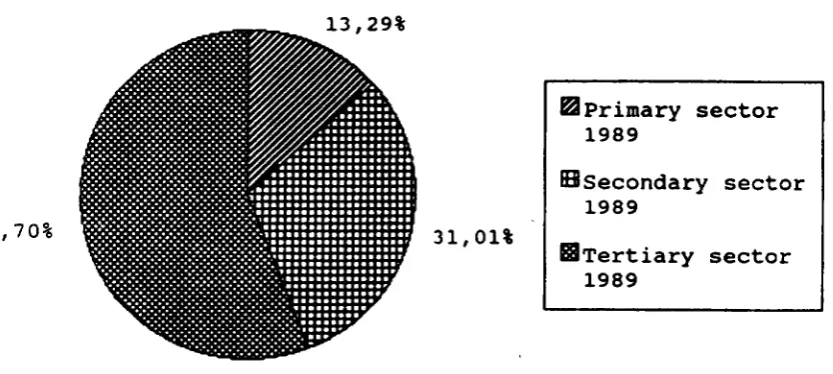
3.9.1. Although in earlier years of the programme, the ·primary and secondary sectors dominated exchanges, the development of the tertiary sector of the Community's economy is reflected in the Youn& Worker Exchange Programme, and this sector is now the largest in the programme.
3.9.2. In 1988, the primary sector represented 14.4% (21 projects), the 'secondary sector 37% (54 projects) and the tertiary sector 48.6% (71
projects). In 1989 the figures were 13.3% (21 projects) in the primary sector, lll (49 projects) in the secondary sector and 55.7%
(88 projects) in the tertiary sector.
See Table 4, Annex 1, for detailed statlstical analysis.
3.9.3. Within each of the three sectors projects were distributed as follows
Primary sector - Agriculture
- Forestry & fishing
Secondary sector
- Metal & mechan. indust. - Other manufact. indust. - Arts
&
crafts- Various
Tertiary sector Tourism serv1.ces - Hotel & catering
Health & social serv. - Cultural & recreation.
services - Computers/informatlCS - Various 11.6% 2.7% 4.1% 19.9% 5.5% 7.5% 1.5% 5.5% 4.8%
17.
u
2.7%17.1%
100%
17 projects 4 projects
6 projects 29 projects 8 projects 11 projects
2 projects 8 projects 7 projects
25 projects 4 projects 25 projects
146 projects
10.8% 2.5% 1.3% 12.0% 2.5% 15.2% 2.0% 4.4% 8.2% 13.9% 1.3% 25.9% 100%
17 projects 4 projects
2 projects 19 projects 4 projects 24 projects
3 proJects 7 projects 13 projects
22 projects 2 projects
41 projects
158 projects
3.9.4. A detailed list of all the areas in which exchange projects took place in 1988 and 1989 is attached as Annex 2.
3. 10. PROFILE OF PARTICIPANTS
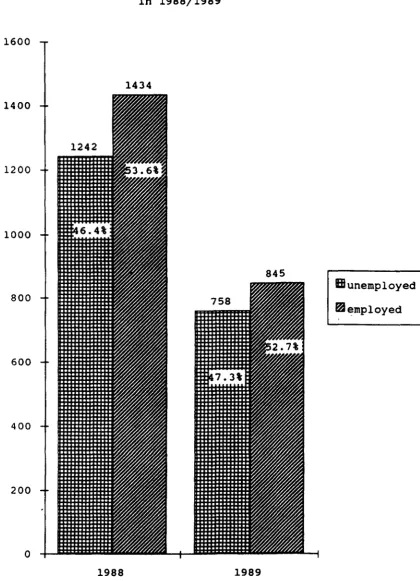
3.10.1. S1nce unemployed young people were made eligible to participate in the programme, the proportion of unemployed participants has increased steadily from 46.4% in 1988 to 47.3% in 1989, i.e. almost half of the participants in the programme are job-seekers.
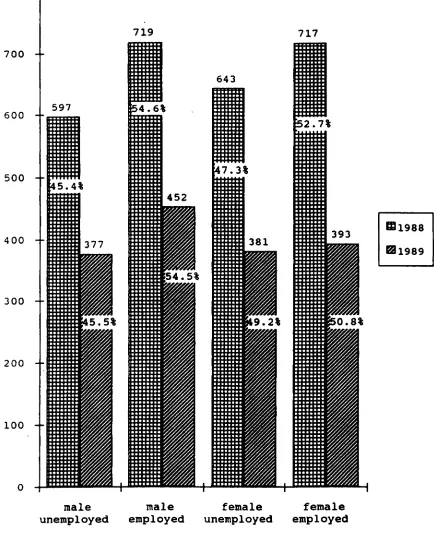
[image:6.594.75.518.212.645.2]3.10.2. Another prior1ty of the Third Programme is to offer equal opportu-nities to men and women. The Commission has endeavoured to ensure that young men and women are equally represented and that women are encouraged to participate in exchanges ~n new technology areas. In both 1988 and 1989, this aim was ach1eved, i.e. equality was complete and young women represented approximately 50% of all part1c1pants in the programme.
3.11.
3.12.
See Table 6, Annex 1, for detailed statistical analysis. WORK EXPERIENCE
The Third Joint Programme is not intended to offer the young person concerned bas1c vocational training and experience in another Member State but rather prov1des a complement to the training and experience already acquired in hls/her own country. The Commission continues to believe it is crucial that even short-term exchanges should have a genuine work experience content and that the work experience provided during long-term projects should be of suff1c1ently hlgh quality and value to encourage employers and workers alike to partic1pate in the scheme.
FUNDING OF PROJECTS
3.12.1. Both iQ 1988 and 1989, the Commiss1on had to refuse funding for a large number of exchange projects for budgetary reasons. The Commission's f1nancial support of the exchange programme was always intended as an 1ncent1ve to the development of young workers' exchanges within the Commun1ty. It was never intended to cover the ent1re costs of each exchange project. although this is in fact nearly the case in the majority of the exchanges. This situation obv1ously leaves much to be des1red as it ultimately means that the number of young people who can participate in the programme is not as h1gh as it m1ght otherwise be.
3.12.2. If the programme is to be extended and to be made less dependent on Community funds it is vital for exchange organisers, in cooperation with national coordinators, to explore all possible sources of complementary funding, be they governmental, regional, local or private. The Commission considers that the Member States should continue their support at national level and their action, if the programme is to have a real impact on young workers throughout the Community.
1
4. !VALUATION OP PROGRAHK!
4.1.
4.2.
In 1988, a qualitative analysis of submitted by the participants during carried out.
the contents of the reports the period 1985-1987 was
This analysis was a first pilot tendencies as regards the effects participants to be identlfied.
study which allowed of the exchanges
certain on the
4.3. During the course of 1989, the long-term repercussions which, in the opinion of the young workers, could have an influence on their participation in the exchange programme, were examined.
4.4. Four different levels of effects have been examined, closely follow1ng the objectives of the programme :
1. Impact on the work situation I development of the individual in professional terms;
2. Changes in the level of socio-cultural environment;
3. Development of awareness of problems in terms of European policy;
4. Effects on personal future plans, and on personal development.
4.5. The group examined in the study consisted of participants who took part in an exchange in 1987, and a random sample of 10% was considered to be sufficient to guarantee valid results. The main basis of the study was a written poll 1n addition to which interviews were carried out with 40 selected participants. The selection of the 40 persons to be interviewed was done along the line of the follow1ng criteria :
all twelve EC Member States were to be considered;
peculiarities appearing in the questionnaire were to be given a closer look if they were relevant to the research matter;
participants who had provided well-founded assessments-positive or negative ones - with regard to perspective were to be given priority;
all programme types were to be included - quantitative distribution of the number of participants per country depending on the absolute participation in the whole exchange programme;
low-cost realization. i.e. creation of regional centres if possible.
4.6. The core of the study was a mainly standardised questionnaire which was structured to follow the logical development of the exchange projects.
4.8. SOME STATISTICAL RESULTS
4.8.1. The breakdown by age group of the participants gives an interesting indication of the role which exchange participation plays in individual future planning. If we take into account the normal length of schooling, and basic vocational training, we find that a quarter of the participants take part in the exchange immediately after training- 27.5%. Approximately 47% have already worked for a few years before taking part in the exchange,
4.8.2. The male/female participation ratio is balanced, with 49% female and 51% male.
4,9. EXPECTATIONS FROM THE EXCHANGE
4.9.1. The desire to develop professional knowledge, and to get to know a neighbouring European country get the h1ghest votes, With about 30% each, as does the w1sh to perfect a foreign language.
4.9.2. Only 15.3% of long term participants gave professional reasons as their primary motivation; 32.1% said that getting to know another European country was the decisive factor, and 29.2% gave perfection of their linguistic skills as the main reason.
4.9.3. The majority (46.6%) of those on three week programmes gave professional reasons as their principal ones. In the same group. getting to know other countries came second with 33.5%. This can in some way be explained by the nature of these short courses, which can obviously only give an introduct1on.
4.10. ARE PARTICIPANTS' EXPECTATIONS FROM THE EXCHANGE FULFILLED?
4.10.1. 36.5% of all participants state that the1r aspirations are met completely, and 50.5% express themselves as being essentially sat1sf1ed. Only 11.5% think that their aspirations were not essentially satisfied. and 1.5% express themselves as not being satisfied at all.
4.10.3. Overall, 87% of participants state that they are largely satisfied, but the negative comments are concentrated on the three week programmes, and we think this latter type should change its role. It IS a perfectly good model if used as a "first Introduction" to various aspects, Including professional aspects, of another country. However, it would seem to be a good idez to abandon the use of this model in a pr1mary role for training improvement - this role seems better suited to other, longer, models.
4.11. PREPARING FOR THE STAY ABROAD
4.11.1. Preparing for a stay abroad is of great importance for the success of that visit. Barely a quarter of all participants already knew their host country. For 35% of the participants, the exchange was the1r f1rst stay abroad.
4.11.2. The survey shows that many participants only complain after the exchange IS over that before the exchange they were not informed of a prec1se programe. On the contrary, many participants were recruited Wlth only general Informatlon on the sector, and the probable act1vit1es.
4.11.3. The majority of those Interviewed had a clear disagreeable feeling of insecur1ty or confusion.
memory of a
4.11.4. In addition, approximately 28% of programmes have an unpleasant memory of by the organisations.
participants on the long the infrastructure provided
4.11.5. Only 16.2% of the same group -classify themselves under the memory", This is considerably of 35.4% of all participants "very pleasant memory",
participants In the long programmes-heading of having a "very pleasant below the, barely tolerable, average who classlfy themselves as having a
4.11.6. The interviews showed that a very clear distinction existed between the language courses and work :
the Infrastructure provided during the language courses was, unan1mously, seen as positive. During this period, the organisers are present, they take care of the participants, and offer a programme wh1ch complements the (language) course.
In most cases, this sltuation changes once the practical tra1n1ng begins. Participants then feel abandoned, amongst other reasons, because of the change of surroundings, location, etc.
4. 12. ON-THE-JOB VOCATIONAL TRAINING
4.12.1. 68.7% of the part1c1pants in the long programmes. and 61.2% of those in the 1-3 month programmes found that the compan1es were prepared for them when they arrived.
4.12.2. Those programmes aimed at a clearly defined group of participants, and which are thus easier to organise (for example banks, savings banks, and farming) generally work in a more satisfactory way.
4.12.3. In this context. the study of the eventual long term effects which could derive from participation in an exchange programme must take into consideration all the objectives set out in the Council Decis1on on this Community programme. and not only the professional aspects.
4.12.4. The mobility of employees has an important role to play in terms of the econom1c and political changes within the European Community. The S1ngle Market of 1993 can only fulfill its function in terms of a single labour market if individuals are prepared to change both their work1ng and l1v1ng conditions. In order for this to happen certain prerequisltes must be met. such as a fundamentally posit1ve approach towards other Member States.
4.12.5. The quest1on of professional benefit from part1c1pation in exchanges is therefore most important.
4.12.6. Immediate Benefit in Profess1onal terms from Partlcipation in Exchanges 1n function of the Length of the Exchange
In professional terms, the exchange was
Beneficial
Detnmental
No impact
TOTAL
Key 1 = Total Key 1 2 3 1 2 3 1 2 3 1 3 figure 2 • % response
Total number of particlpants 262 44.0% 44 7.4% 289 48.6% 595 100.0%
Less than One to one month three
months
74 118 28.2% 45.0% 33.8% 49.8%
18 14 40.9% 31.8%
8.2% 5.9%
127 105 43.9% 36.3% 58.0% 44.3%
219 237
36.8% 39.8%
3 • % of participants per type of programme.
11
4.12.7. These figures show that, in the long term programmes, the practical professional experience abroad generally has a posit1ve impact on-the-job at home, and progressively according to the length of the programme :
33.8% for part1c1pants 1n three week programmes; 49.8% for participants in 1-3 month programmes; 50.4% for partic1pants in longer programmes.
4.12.8. This result is shown even more clearly in terms of the long term effects (after one or two years)
Professional Key Total n• of Less than One to More than 1mpact of the participants one month 3 months 3 months
1 378 117 160 101 Beneficial 2 63.7% 31.0% 42.3% 26.7%
3 52.7% 69.0% 72.7%
1 9 4 3 2
Detrimental 2 1.5% 44.4% 33.3% 22.2%
3 1.8% 1.3% 1.4%
1 206 101 69 36 No impact 2 34.7% 49.0% 33.5% 17.5 3 45.5% 29.7% 25.9%
1 593 222 232 139 TOTAL 3 100.0% 37.4% 39.1% 23.4%
Key 1 = Total hgure 2 = % response
3 % of particlpants per type of programme.
4.12.9. One of the other objectives of the Council Decision concerning the Young Workers' Exchange Programme is to see a growing interest in European policies and a greater awareness of the European Dimension of this programme among participants.
4. 13. AN OVERALL APPRECIATION
4.13.1. An overall appreciation of part1cipat1on in exchanges yields the follow1ng results :
Key Total n• of Less than One to More than participants one month 3 months 3 months
1 576 212 232 132 For 2 96.0% 36.8% 40.3% 22.9%
3 94.6% 98.3% 94.3%
1 b 5 1
Aga1nst 2 1.0% 83.3% 16.7%
.3 2.2% 0.7%
1 18 7 4 7
No advice 2 3.0% 38.9% 22.2% 38.9
3 3.1% 1.7% 5.0%
1 600 224 236 140
TOTAL 3 100.0% 37.3% 39.3% 23.3%
Key 1 ,. Total hgure 2
=
% responsel
=
% of participants per type of programme.4.13.2. The figure of 96% for those who would, today, some time after their experience, advise part1cipat1on in such an exchange, shows the high value attributed to the European Community Young Workers' Exchange Programme by former partlcipants.
4.13.3. There 1s an obv1ous connect1on between the durat1on of an exchange and 1ts long-term positive repercussions in professional terms. This finding 1s re1nforced by the indications which participants have given 1n terms of the des1rable length of an exchange :
almost 88% of part1c1pants in long term exchange programmes declared themselves to be in favour of this model (long term);
approximately 53% of part1cipants who had participated in a one to three month programme, declared a preference for longer programmes, for a m1nimum of six months;
in terms of partic1pants in the three week programmes there is also a clear shift in op1nions, almost 60% of them argued for programmes of between one and three months, and almost a
13
5. CONCLUDING REMARKS
5.1. As mentioned earlier, there has been a progressive increase in the
number of part1cipants in 1988 and 1989, even though there has only been a limited increase in the budget. The Commission is also happy to note the constant increase in the number of new exchange organisers (in 1989 19 new organisations applied for a grant, of which 10 received grants).
5.2. The impact of the information materials disseminated since 1988 is becoming evident, and it should be noted that the number of requests for information from individuals, as well as from organisations, is still increasing.
5.3. Finally, it will have been noted from the Comm1ssion's Communication to the Council. "Education and Training withln the European Commun1ty -Guidelines for the med1um-term : 1989-1992" (COM(89) 236 flnal>. that "the CommlSSlOn intends to examine the scope of s1mpl1fying the presentatlon of the opportunities available to the youth publ1c by these two programmes (Young Workers' Exchange programme and Youth for Europe), and also to streamline the1r administrat1on. For this reason. the phas1ng of the two schemes w1ll be synchronized to perm1t a more coordinated approach in future by the Commission to youth exchanges of all kinds".
6.000.000
5.000.000
4.000.000
3.000.000
2.000.000
1.000.000
0
Table 1.1.
100%
1988 Total costs in ECU
4.255.291
-)S-cost /Grant Projects in 1988/1989
82.8%
·1988 Total grant allocated in ECU 3.524.220
100%
1989 Total costs in ECU
5.654.687
81.3%
[image:16.593.69.546.97.779.2]2.000,00
1.800,00
1.600,00
1.400,00
1.200,00
1.000,00
800,00
600,00
400,00
200,00
0,00
Table 1. 2.
100%:
Average cost 1 grant per participant in 1988 1 1989
100%
81.3%
82.8%
1988 cost 1988 grant 1989 cost 1989 grant per part. in per part. in per part. in per part. in
[image:17.596.42.476.170.746.2]180
160
140
120
100
80
60
40
20
0
Table 1. 3. Average cost/grant per participant per week in 1988/1989
100%
83.0%
1988 Cost per 1988 Grant part. in ECU per part. in
141 ECU 117
100%
1989 Cost per part. in ECU
168,9
81.3%
1989 Grant per part in
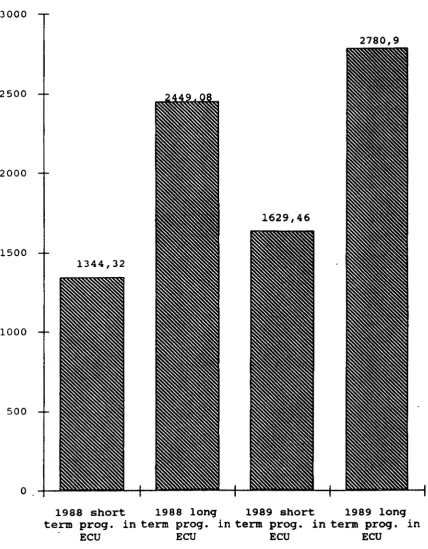
[image:18.596.87.513.162.744.2]3000
2780,9
2500
2000
1629,46
1500
1344,32
1000
500
0
1988 short 1988 long 1989 short 1989 long term prog. in term prog. in term prog. in term prog. in
[image:19.593.50.479.199.749.2]-)~-Table 1.5. Average cost per part per week per short/long-term programme in 1988/1989
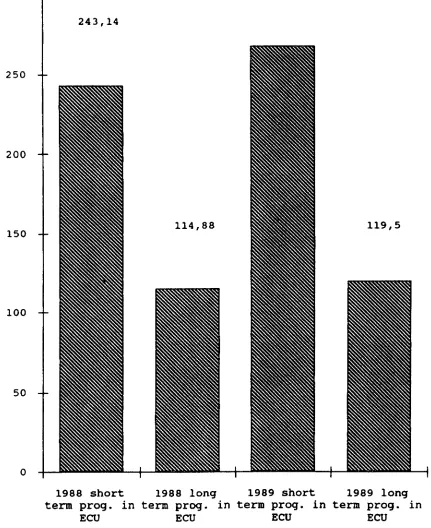
267,96 300
243,14
250
200
150 114,88 119,5
100
50
0
1988 short 1988 long 1989 short 1989 long term prog. in term prog. in term prog. in term prog. in
[image:20.594.87.518.215.743.2]82,19%
Table 2.2. Short/Long-term projects in 1989
-18,99%
DTotal long term 1989
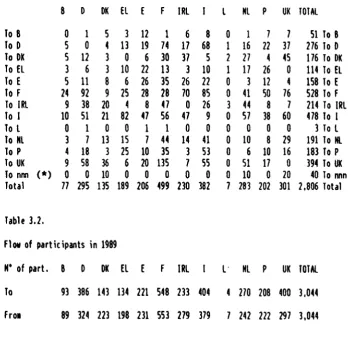
8 D DK EL E F IRL I l Nl p UK TOTAl
To 8 0 1 5 3 12 1 6 8 0 1 7 7 51 To 8 Note : The total figure of 2806 participants is based To D 5 0 4 13 19 74 17 68 1 16 22 37 276 To D on planned participant numbers of detailed To Dk 5 12 3 0 6 30 37 5 2 27 4 45 176 To DK applications and thus do not correspond with To EL 3 6 3 10 22 13 3 10 1 17 26 0 114 To El the final/actual participant numbers. For this To E 5 11 8 6 26 35 26 22 0 3 12 4 158 To E reason there is a variance of 130 participants to F 24 92 9 25 28 28 70 85 0 41 50 76 528 To F compared with the final/actual number of
To IRL 9 38 20 4 8 47 0 26 3 44 8 7 214 To IRl 2676 participants. To I 10 51 21 82 47 56 47 9 0 57 38 60 478 to I
To l 0 1 0 0 1 1 0 0 0 0 0 0 3 To l To Nl 3 7 13 15 7 44 14 41 0 10 8 29 191 To Nl..
To P 4 18 3 25 10 35 3 53 0 6 10 16 183 to P To UK 9 58 36 6 20 135 7 55 0 51 17 0 394 To UK To nnn (*) 0 0 10 0 0 0 0 0 0 10 0 20 40 To nnn
Total 71 295 135 189 206 499 230 382 7 283 202 301 2,806 Total
,
t
Table 3.2. \
flow of participants in 1989
N•
of part. 8 D DK El E FIRL
I l' Nl p UK TOTALTo 93 386 143 134 221 548 233 404 4 270 208 400 3,044 Note : The 1989 figures are based on planned participant numbers of detailed applications and not on
Fro• 89 324 223 198 231 553 279 379 7 242 222 297 3,044 the final/actual numbers as many have not
finished yet and specific participant inforaation is only available in final reports.
[image:23.841.53.416.88.432.2]Table 4
.1.48,63%
Sectoral distribution of projects
in 1988
36,99%
fl
Primary sector
1988
Hlsecondary sector
1988
Table 4.2.
55,70%
Sectorial distribution of projects in 1989
31,01%
fB
Primary sector 1989IBisecondary sector 1989
[image:25.596.85.502.373.560.2]Table 5.1.
1600
1400
1200
1000
800
600
400
200
0
-l'5-Unemployed/Employed Young Workers
in
1988/19891434
1988 1989
845
IEBunemployed
Fa
employed [image:26.597.92.513.165.746.2]800
700
600
500
400
300
200
100
0
Table 5.2. Unemployed/Employed Male/Female
597
male unemployed
Young Workers in 1988/1989
719
male employed
643
female unemployed
717
female employed
1Zh988
Bl1989
[image:27.594.61.495.212.751.2]Table 6.
1400
1200
1000
800
600
400
200
0
Male
I
Female Young Workers in 1988
1
1989
1360
829
1988 1989
IBMale
Ill
Female
[image:28.588.86.501.188.745.2]Annex 2
Detailed list of areas in which Young Workers Exchange
proJects took place in 1988 and 1989
Agriculture Agroindustry Archeology Arts
Art restoration
Audiovisual production Banking
Boat building Ceramics
Chemical industry Circus
Commerce Computers Construction. Crafts
Cultural "animateurs" Disabled workers Distribution Engineering
Environment protection Fisheries
Food, drink and tobacco industry Food processing industry
Forestry
Health and social services Horticulture
Hospitals
Hotel and catering Hunting
Import/export Insurance
Landscape gardening
Local employment initiatives Manufacturing industries Marketing
Media
Metal working industry Music
Nature conservation Nursing
Public administration Recycling
Secretariat Sports
Technical assistance to agriculture Telematics Textiles Theatre Tourism Transport Vitl.culture
COM(90) 377 final
DOCUMENTS
EN
05
Catalogue number: CB-C0-90-397-EN-C
.
ISBN 92-77-63155-4
PRICE 1 -3o pages: 3.SO ECU
I ( · per additional
tO pages: 1.2S ECU