1-1-1982
In vivo adsorption of plasma proteins onto
hydrogel coated silicone rubber: evaluation using
FT-IR/ATR
Linda Joanne Miller
Iowa State UniversityFollow this and additional works at:https://lib.dr.iastate.edu/rtd Part of theEngineering Commons
This Thesis is brought to you for free and open access by the Iowa State University Capstones, Theses and Dissertations at Iowa State University Digital Repository. It has been accepted for inclusion in Retrospective Theses and Dissertations by an authorized administrator of Iowa State University Digital Repository. For more information, please [email protected].
Recommended Citation
Miller, Linda Joanne, "In vivo adsorption of plasma proteins onto hydrogel coated silicone rubber: evaluation using FT-IR/ATR" (1982).Retrospective Theses and Dissertations. 18742.
In vivo adsorption of plasma proteins onto hydrogel coated silicone rubber: Evaluation using FT-IR/ATR
by
Linda Joanne Miller
A Thesis Submitted to the
Graduate Faculty in Partial Fulfillment of the Requirements for the Degree of
MASTER OF SCIENCE
Major: Biomedical Engineering
Signatures have been redacted for privacy
g
Iowa State University Ames, Iowa
1982
TABLE OF CONTENTS
PAGE
INTRODUCTION • • • • • • • • • • • • • • • • 1
LITERATURE REVIEW • • • • • • • • • • 3
Hydrogels • • • • • • • • • • • • • • • • • • • • 3
Interfacial Phenomena • • Surf ace Tension • • • • surface Free Energy • • Interfacial Free Energy Contact Angle • • • • • Critical surface Tension Structured Water • • •
Time Sequence of Deposition Compositional Changes •
Molecular Configuration • Conformational Changes
• • • • • • • • • • • • • • • • • • • • • • • • • • • • • • • • • • • • • • • • • • • • • • • • • • • • • • • • • • • • • • • • • • • • • • • • • • • • • • • • • • • • • • • • • • • • • • • • • • • • • • • • • •
Reversible vs Irreversible • • • • • • • • • • •
Type of Protein • • • • • • • • • • • • • • Protein Spectral Characteristics • • • • •
Mechanisms for Platelet Attachment • •
Techniques used to Study the Protein Layer • • • • • • • • • • • • • • • •
FT-IR/ATR • • • • • • • • • • • • • •
MATERIALS AND f'lETHODS • • • • • • • • • • • •
f'laterials • • • • • • • • • • • • • •
Methods • • • • • • • • • • • • • • Method 1- Sample Preparation (Tubing) •
Implantation • • • • • • • • • • • •
Sample Analysis • • • • • •
Method 2- Sample Preparation (Sneets) • flowcell Preparation
Implantation • • • • •
Sample Analysis •
Spectral Subtractions Protein Spectra • • • •
• • • • • • • • • • • • • • • • • •
Air Dried Silicone Rubber and Hydrogels
• • • • • • • • • • • • • • • • • • • • • • • • • • • • • • • • • • • • • • • • • • • • • • • • 4 4 4 4 5 7 7 8 10 10 11
• 1 2
• • • • • • • • • • • 1 3 14 15 16 , 7
RESULTS AND DISCUSSION • • Method 1 • • • •
Blood Data-SEii Resu 1 ts • FT-IR Results
• • • • Method 1
• • • • • • • Ill
• • • •
• •
• • • •
Method 2 • • • • • • • • • Blood Data- Method 2 •• Visual Observations •••
SEM Results • • • • • • • FT-IR Results • • • • • • Effect of Hydrogel Coating FT-IR and SEii Results • • CONCLUSION • • • • • • • • • • BIBLIOGRAPHY • • • • • • • • • APPENDIX A • • • • • • • • • • APPENDIX B • • • • • • • • • •
• • • • • • • • • • • • • • • • • • • • • • • • • • • • • • • • • • • • • • • • • • • • • • • • • • • • • • • • • • • • • • • • • • • • • •
•
• • • • • • • • • • • • • • • • • • • • • • • • • • • • • • • • • • • • • • • • • • • • • • • • • • • • • • • • • • • • • • • • • • • • • • • • • • • • • • • • • • • • • • • • • • • • • • • • • • • • • • • • • • • • • • • • • • • • • • • • APPENDIX C • • • • • • • • • • • • • • • • • • • • • • ACKNOWLEDGMENTS • • • • • • • • • • • • • • • • • • • •• • • • • 33 33 33 33 35 • 35 • 35 • 35 • ~2
• 56 • 69 • 72
• 90 • 93
• 98
LIST OF TABLES
PAGE TABLE 1. Infrared Bands (cm-1) for Albumin and
Fibrinogen • • • • • • • • • • • • • • • • • • 15
TABLE 2. Data from Method 1 • • • • • • • • • • • • • • 3q.
LIST OF FIGURES
PAGE
FIGURE 1. contact angle data (Vale, 1980, pg. 9ij) • • • 6 FIGURE 2. Subtractions in equation form • • • • • • • • 30 FIGURE 3. Subtractions illustrated in equation form • • 31 FIGURE q. Scanning electron micrographs of silicone
rubber (A and B) and 53 HEMA/15% NVP (C, D,
and E). 15 Kev. (scale bar=10 µm) • • • ••• 37 FIGURE 5. scanning electron micrographs of 10% HEMA/103
NVP (A) and 15% HEMA/53 NVP (B). 15 Kev.
(scale bar=lO µm) • • • • • • • • • • • • • • 39
FIGURE 6. spectrum of silicone rubber tubing showing
large peak at 1258 wavenumbers • • • • • • • • qo FIGURE 7. Scanning electron micrographs of silicone
rubber (A), 53 HEMA/15% NVP (B, C, and D), and 1 Ol!: HEMA/10% NVP (E and F), 15 KeV. (scale
bar=10 µm) • • • • • • • • • • • • • • • • • • q~
FIGURE 8. Scanning electron micrographs of 103 HEMA/103 N VP (A) and 15% HEMA/5% NVP (B, C, and D) • 15
Kev. (scale bar=10 µm) • • • • • • • • • • • • 46
FIGURE 9. Scanning electron micrographs of silicone rubber (A and B) and 5% HEMA/153 NVP (C and
D) • 1 5 Kev. (scale bar=1 0 µm) • • • • • • • • q9 FIGURE 10. scanning electron micrographs of 103 HEMA/10%
NVP (A) and 15% HEMA/5% NVP (B and C). 15 Kev.
(scale bar=10 µm) • • • • • • • • • • • • • • 51
FIGURE 11. scanning electron micrographs of silicone rubber (A, B, and C) and 53 HEMA/153 NVP (D and E). 15 Kev. (scale bar A =250 µm, scale
bar B, C, D, E =10 µm) • • • • • • • • • • • • 53 FIGURE 12. Scanning electron micrographs of 10% HEMA/103
C, D, E=10 µm) • • • • • • • • • • • • • • • • 55
FIGURE 13. Comparison of two germanium spectra collected during alignment experiment • • • • • • • • • 57 FIGURE 1q. Spectra resulting from applying silicone
rubber sheets to the crystal with varying degrees of pressure, upper spectrum (A) was collected using relatively less pressure than
lower spectrum (B) • • • • • • • • • • • • • • 59
FIGURE 15. Spectrum of 57. HEMA/157. NVP after exposure to blood illustrating dispersion curves indicated
by arrow • • • • • • • • • • • • • • • • • • • 60
FIGURE 16. Absorbance spectra of silicone rubber after 15 minutes exposure to blood (A) and the protein layer after silicone rubber subtraction (B) • 61 FIGURE 17. Absorbance spect~a of 53 HEMA/15%
minutes exposure to blood (A) and layer after subtraction of the 57.
(B) • • • • • • • • • • • • • • •
llVP after 1 5 the protein HEMA/157. NVP
• • • • • • 62 FIGURE 18. Absorbance spectra of 103 HEMA/103 NVP after
15 minutes exposure to blood (A) and the protein layer after subtraction of the 107.
HEMA/103 NVP (B) • • • • • • • • • • • • • • • 63 FIGURE 19. Absorbance spectra of 153 HEMA/53 llVP after 15
minutes exposure to blood (A) and the protein layer after subtraction of the 153 HEl!A/53 NVP
(B) • • • • • • • • • • • • • • • • • • • • • 6q.
FIGURE 20. Absorbance spectrum of water vapor • • • • • • 67 FIGURE 21. Comparison of spectra resulting from water
subtractions, the upper spectrum (A) was obtained by method 1 and the lower spectrum
(B) by method 2 • • • • • • • • • • • • • • • 68
FIGURE 22. Absorbance spectra of fibri.nogen
albumin (B) • • • • • • • • • • • (A) • and • • • • • 70 FIGURE 23. Absorbance spectra illustrating the effect of
silicone rubber (A) and 5% ~EMA/15% NVP (B) • 73
FIGURE 25. Absorbance spectra showing water retention of 10% HEMA/10% NVP (A) and 15% HEMA/5% NVP (B) • 74 FIGURE 26. (continued on pages 79, 80, and 81). FT-IR
spectra and associated SEM micrographs for dog 3178. sample pairs are designated: left leg
(right leg) • • • • • • • • • • • • • • • • • 78
FIGURE 27. (continued on pages 83, 84, and 85)· FT-IR spectra and associated SEM micrographs for dog G.s. Sample pairs are designated: left leg
(right leg) • • • • • • • • • • • • • • • • • 82
FIGURE 28. (continued on pages 87, 88, and 89). FT-IR spectra and associated SEM micrographs for dog 3172. Sample pairs are designated: left leg
(right leg) • • • • • • • • • • • • • • • • • 86
FIGURE 29. Schematic spectrum of silicone rubber • • • 100 FIGURE 30. Schematic spectrum of protein • • • • • • • 100 FIGURE 31. Schematic spectra of protein and silicone
rubber • • • • • • • • • • • • • • • • • • • 101
[image:8.571.50.496.90.422.2]INTRODUCTION
When a foreign material is placed in contact with blood, a layer of proteins is rapidly deposited. This occurs in 3 to 5 seconds and is the initial step in the
blood's response to contact with a foreign material. It has been determined that not only is this protein layer
necessary for subsequent platelet deposition but that it can be used to predict the relative quantities of platelets that will adhere to the surface, depending on the nature and type of protein deposition.
Currently, considerable research is being conducted to characterize the protein layer. Experiments have been
performed on many different materials to determine the rate and chronological sequence of deposition, as well as the molecular configuration and composition. By studying the protein layer, knowledge can be acquired about the body's response to foreign surfaces. It may be possible to
formulate a material which, after an initial tolerance
period, will be passivated and accepted by the body. Under some circumstances, it is desirable to prohibit the
deposition of any proteins. This is the case for contact lenses, where any protein buildup causes discomfort to the wearer and inhibits vision.
HEMA (hydroxyethyl methacrylate) and NVP
LITERATURE REVIEW
Hydrogels
More than twenty years ago, Wichterle and Lim (1960) began their work with hydrogels. Because of their hemo- and biocompatible properties, hydrogels are still under
considerable investigation today. Hydrogels are a broad class of synthetic polymers which are able to swell in water and retain greater than twenty percent of the water in their structure without dissolving in the water (Hoffman et al., 1977). A list of their many uses in the field of medicine include coatings for sutures, catheters, intrauterine
devices, vascular grafts, and electrophoresis cells, as well as homogeneous materials for electrophoresis cells, contact lenses, artificial corneas, breast implants, burn dressings, and hemodialysis membranes.
One of the disadvantages in utilizing hydrogels is their low mechanical strength. For many applications, they must be grafted onto a stronger support material. The
hydrogels chosen for this investigation were HEMA and NVP. They were radiation grafted onto silicone rubber as the support material. In this manner, the surface
characteristics of a material such as silicone rubber may be altered and possibly improved. ay varying the solvent,
imbibition in the end product (Ratner and Hoffman, 1975).
These parameters are of interest in efforts to design improved biomaterials.
Interfacial Phenomena
Sur!~ Tension
At the surface of matter, especially liquids, there exist asymmetric forces which pull the surface molecules inward. The number of surface molecules continues to decrease until a minimum surface area is reached. The tension created at the surface due to the depletion of molecules is called surface tension and is expressed as dynes/cm (Andrade, 1973)~
.§l!I:.!fil<~ ~ !~!:.!U
surface energy is a measure of the inward forces that result in unsatisfied bonds at the surface. It is expressed in ergs/cm2 and is therefore equivalent to surface tension.
ln!~rf~cial Fr~~ !~!:..!ll
When two surfaces, each with its particular surface free energy, contact each other, the unsatisfied bonds are satisfied, and the surface energy is reduced. The
interfacial free energy can be described by
YA=the surface free energy of A, YB=the surface free energy of B,
r
A (Bl = the effect of B on A, andr
B (A) =the effect of A on B (Andrade, 1973). Holly (1979) claims that solids with low surface energy in air usually have high interfacial tension in water. Conversely, materials that have lowinterfacial tension in water have high surface free energy.
fQ!!.!.!!£! Anql§.
Depending on the interfacial energy, a liquid drop placed on a solid surface will either bead or spread over the surface. A line tangent to the drop forms the contact angle. If the contact angle is greater than 900, the
surface is hydrophobic. However, if the contact angle is less than 900, the liquid will spread over the surface until at contact angle equal zero, the surface becomes completely
wet. This surface is hydrophilic. The contact angle
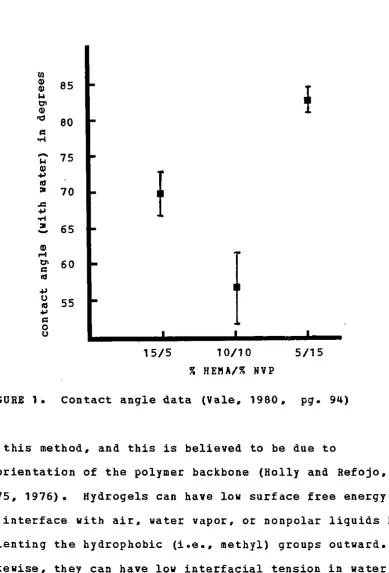
provides an inverse measure of wettability (Andrade, 1973). As can be seen from the contact angle data in Figure 1, for HEMA and NVP, polymerized in 12% methanol and 68% water by gamma irradiation, 10% HEMA/10% NVP is the most
hydrophilic, 15% HEMA/5% NVP is next, and 5% HEMA/15% NVP is the least hydrophilic of the series. The water contact
angle for silicone rubber is 1030.
~
m
85m
M
~
m
~ 80
=
~
....
M 75m
I
~ ~
~ 70
.c
~ ~
~ 65
~
m
~~ 60
=
~
~ u 55
~
~
=
0 u
15/5 10/10 5/15 3 HE~A/3 NVP
FIGURE 1. Contact angle data (Vale. 1980. pg. 9~)
in this method. and this is believed to be due to
[image:14.565.69.459.74.648.2](Holly, 1979).
~ri:ti£.Sl a!!!:fa£g Iimsion
If the contact angle of a series of liquids which vary in surface tension (shown as cos6), is plotted against
surface tension of the liquid, a linear relationship will result. Extrapolation of the line to cos6=1 yields the critical surface tension. Critical surface tension values of 20 to 30 dynes/cm are considered to represent values for materials which would be biocompatible (Baier, 1977). Lyman et al. (1969) have observed decreasing platelet adsorption with decreasing critical surface tension of different
materials.
Structured H.!!1~
Not only is the quantity of water an important
consideration for the initial adsorption of proteins on a hydrophilic surface, but also the structure and organization of water (Andrade et al., 1973; Garcia et al., 1980). Jhon and Andrade (1973) claim that there are at least three kinds of water in hydrogels: (1) hydrated, (2) interfacial, and
near the hydrophobic sites on the solid surface may form "iceberg" structures while water near the hydrophilic sites may be bound to the surface. Iceberg formation refers to the hydrophobic character of a hydrocarbon molecule which causes the water molecules to organize around it and to case it in an icelike casing. They further suggest that water bound to the hydrophilic sites may inhibit iceberg formation
(i.e., the hydrophobic domain is dispersed in the
hydrophilic matrix and the high amount of water bound in the polymer) and in this manner inhibit blood coagulation.
Time Sequence of Deposition
Although there is considerable debate concerning the exact sequence of events that occurs when blood contacts a foreign surface, most investigators agree on the basic sequence: polymer surface-blood contact, competitive adsorption of plasma proteins, formation of protein
coated surface, platelet approach, platelet reaction with glycoproteins, platelet adhesion, thrombus and coagulation
(Kim et al., 197q).
Baier (1977) believes that platelet morphology is the first signal that a thromboresistant surface has been
surface is observed. The white cells cover the platelets and, through some poorly understood mechanism,
phagocytize the platelets. He also postulates that the white cells may release enzymes which loosen and cause sloughing of the protein film. In contrast, Barber et al.
(1979) have observed leucocyte adherence, specifically neutrophils and monocytes, preceding thrombus and conclude that initial leucocyte adherence may be a critical factor for thrombus to occur on certain surfaces.
In more recent studies, the Battelle Research Laboratories group using Fourier Transform Infrared
Spectroscopy (FT-IR) with an Attenuated Total Reflectance (ATR) accessory and flowing whole blood has determined the sequence of protein deposition onto a germanium crystal
(Gendreau et al., 1981). Initially, albumin is adsorbed as the primary component. Immediately following albumin
adsorption is the adsorption of a highly labile carbohydrate species, which adsorbs and desorbs rapidly. Still within the first few minutes, fibrinogen and possibly gamma
globulins replace albumin as the predominant adsorbing
species. Similar results were observed on
Biomer~
silicone rubber and polyvinylchloride with the following exceptions: BiometIDadsorbed the least protein, and silicone rubberpolyvinylchloride (Gendreau et al., ca. 1982a).
£iU!!I!~itiong_J,. Chfil!~§
Plots as a function of time of protein bands which are common to all proteins (1550 and 1400 cm-1) indicate that adsorption occurs quickly with over half the total protein adsorbed in 15 seconds and over 90 percent in 30 seconds
(Jakobsen et al., ca. 1982b), After adsorption levels off, the primary pr-0teins begin to be replaced. During this exchange, the total protein remains constant (Gendreau et al., 1981).
Molecular Configuration
Brash and Uniyal (1979) claim that there is a wide variation in characteristics of protein adsorption to different surfaces. Using radioiodine labeling, they observed the formation of closely packed monolayers of
protein, but could find no more than single layers formed on solid surfaces. In direct conflict are the observations of many other investigators (Dillman and Miller, 1973; Bagnall, 1977; Watkins and Robertson, 1977) who have observed at
least two layers. Early work by Lyman et al. (1968) and Brash and Lyman (1969) using infrared (IR) internal
solids. This conflicts with later results by Bagnall (1977), who states that because globular proteins have hydrophobic cores and hydrophilic surfaces, adsorption on hydrophobic surf aces will cause molecular distortion as the molecule unfo~ds trying to present as nonpolar a surface as
possible to minimize interfacial tension. Sometimes this may not be possible because of internal constraints on the molecule. In addition, the possibility of an initially
adsorbed denatured layer, followed by a layer of proteins in their native state has been proposed (Brash and Lyman. 1969; Bagnall, 1977). The denatured layer, in this case, would be in contact with the polymer while the native protein layer would be exposed to blood.
s;.Qll~ll! i o
!!.ll
.!:,; ha .!lllfillThe conformation of the adsorbed protein layer is believed to be important in the determination of
biocompatibility (Jakobsen and Gendreau, 1978). The term, conformation, refers to the secondary structure of the protein, i.e., alpha helix, beta sheet, or random coil. Albumin tends to be a mixture of alpha helix (553), beta pleated sheets (153) • and random coil (303). Fibrinogen is composed of alpha helix (30-503) • random coil (603). and beta sheet (5-103) (Gendreau et al •• ca. 1982b).
Environmental factors such as pH and concentration can
changes can be observed in the IR spectrum.
Reversible vs Irreversible
In general, hydrophilic surfaces adsorb less protein than hydrophobic surfaces (Holly, 1979; Brash and Uniyal, 1979; Lyman et al., 1969; Andrade, 1973), and the protein adsorbed to the hydrophilic surface is reversibly bound
(Bagnall, 1977; Lyman et al., 1969; Holly, 1979).
Weathersby et al. (1977) report that the 'loose fraction' constituted approximately 25 percent of the adsorbed
fibrinogen on HEMA grafts, but only 5 percent on surfaces containing at least 5 percent EMA (ethyl methacrylate). In addition, the 'strongly bound' fibrinogen desorbs twice as fast from HEMA as from EMA.· Therefore, protein adsorption on a hydrophilic surface is reversible while adsorption on a hydrophobic surface is irreversible. Relating this to the previously discussed concept of multilayer adsorption, the initial layer is irreversibly bound but the second layer is loose and can be desorbed (Gendreau and Jakobsen, 1979; Bagnall, 1977; Dillman and Miller, 1973; Watkins and
material or even the tightly adsorbed layer (which may be denatured)• but rather the loose layer of native proteins.
In their FT-IR/ATR experiments, the Battelle Research Laboratories group (Jakobsen et al •• ca. 1982a) has observed
that increasing the flowrate of pure albumin solutions, while maintaining the same concentration. or decreasing the concentration at the same flowrate, decreases the amount adsorbed. Therefore, the amount adsorbed is directly
proportional to concentration and inversely proportional to flowrate. In similar desorption experiments. they noted the smaller the quantity adsorbed. the smaller the amount
desorbing. Therefore, the total amount desorbed is
inversely proportional to the flowrate during adsorption and directly proportional to the concentration during
adsorption, i.e •• at faster flowrates, less protein adheres but it adheres more tightly.
Type of Protein
An adsorbed protein coat determines and is a necessary precursor for platelet adhesion (Kim et al •• 1977). Some of the earliest work in protein adsorption consisted of
show that surfaces which adsorb or are precoated with albumin attract fewer platelets and the surface becomes
passivated (Packham et al., 1969; Lyman et al., 1974; Vroman et al., 1977; Barber et al., 1979). If fibrinogen is the main protein adsorbed, the surface will attract more
platelets and can become thrombogenic or thromboembolic (Mason et al., 1971; Packham et al., 1969; Lee and Kim,
1974; Roohk et al., 1976). Gamma glubulins have also been shown to attract an increased number of platelets {Roohk et al., 1977).
studies conducted using mixed protein solutions indicate that proteins are not adsorbed in proportion to their concentrations in the bulk solation, i.e., surfaces selectively attract specific proteins (Horbett and Hoffman,
1975; Kim et al., 1974; Lee at al., 1974).
Rl;Q1ein ~~£!.!:~ Character;!.!!tics
Table 1 lists the locations and relative intensities of IR bands for albumin (Koenig and Tabb, 1980) and fibrinogen
(Gendreau and Jakobsen, 1979). The IR spectrum for fibrin is very similar to that of fibrinogen (Jakobsen et al.,
TABLE 1. Infrared Bands (cm-1) for Albumin and Fibrinogen
~---albumin film 1656 vs 1540 s 1452
m
1390m
1305m
1248w
1172 vfibrinogen film 1650 vs
1550 s 1450
m
1400m
1320w
1240m
1160 vv 1080w
vs=very strong, s=strong, m=moderate, v=veak, vv=very weak
---ftechanisms for Platelet Attachment
Lee and Kim (1974) have proposed a mechanism·for
platelet attachment which involves the formation of enzyme-substrate complex bridges between platelet glycosyl
transferases and incomplete heterosaccharides in
glycoproteins. Assays were conducted utilizing three plasma proteins: albumin, fibrinogen, and gamma globulips, and two platelet glycosyl transferases: sialyl transferase and
galactosyl transferase. When the proteins were treated (sialic acid or galactose removed), fibrinogen and gamma globulin coated surfaces shoved greater platelet adherence than either surface untreated. Treated and untreated
[image:23.563.42.485.88.270.2]carbohydrate to protein is significantly higher on
thrombogenic surfaces than on thromboresistant. Kim et al. (1977) have also postulated that adsorbed fatty acid salts are released from the interface following contact with
plasma to form localized concentrations of fatty acids which cause platelet aggregation.
Technigues used to Study the Protein Layer
In the past, researchers have employed many methods to study protein adsorption and the resulting platelet
adherence. As previously mentioned, in some studies
surfaces were precoated with individual proteins (Packham et al., 1969; Lee and Kim, 1974). Others have studied
adsorption from single protein solutions (Horbett and
Hoffman, 1975; Kim and Lee, 1975). Adsorption from mixtures indicates decreased surface concentrations (Brash and
Uniyal, 1976) of proteins compared with adsorption from single protein solutions. Varying flowrate studies show greater adsorption from static systems than from flowing systems (Gendreau and Jakobsen, 1979). Brash and Uniyal (1976) reported a decrease in surface concentrations upon the addition of washed red cells. Radiolabels have been used extensively in in vitro and in vivo experiments
1976). Lyman et al. (1974) and Weathersby et al. (1976) used elution methods.
IR and internal reflection techniques were used in early investigations (Lyman et al., 1968; Brash and Lyman,
1969; Baier and Dutton, 1969). Watkins and Robertson (1977) used ATR to study the adsorption of fluorescein labelled gamma globulin onto silicone rubber. Kim and Lee (1975) employed internal reflection IR spectroscopy in their studies of adsorption of single protein solutions onto hydrophobic polymers. The Battelle Research Laboratories group has utilized FT-IR/ATR to investigate adsorption from single solutions (Gendreau et al., ca. 1982b; Jakobsen et al., ca. 1982a), mixed solutions (Gendreau et al., ca. 1982b; Gendreau and Jakobsen, 1979; Jakobsen et al., ca. 1982a), and static and flowing solutions (Gendreau and Jacobsen, 1979). They have extensively studied adsorption from flowing whole blood onto a germanium crystal and, to a limited extent, onto various polymer thin films including silicone rubber, Biemer, polyethylene, and polyvinylchloride
(Gendreau and Jacobsen, 1979; Gendreau et al., 1981; Jakobsen et al., ca. 1982b).
FT-IR/ATR
total reflection (ATR) is based on the principle of total internal reflection. When a beam of radiation is passed into a prism. for example germanium, the energy is totally reflected from the back face. then the front face, and so on until the beam emerges from the opposite end of the prism. The sample to be examined is placed in intimate contact with the crystal. As the beam passes through the crystal, energy at the points of reflection is selectively absorbed by the sample so the resulting spectrum is characteristic of the sample. The beam penetrates approximately 6000A (for a 600 germanium prism) into the sample, but penetration varies depending on the specific prism used and the angle of incidence. The intensity of the IR radiation of a given freguency depends on the refractive index, angle of
incidence, and the absorption index (Conley, 1972, pg. 57). The technigue is useful for, but not limited to, the IR examination of solid materials. one advantage it has over conventional IR is the ability to analyze opague samples since the resulting spectrum is independent of sample thickness; therefore, the need for precise and extremely short path length cells is eliminated. When ATR is coupled with FT-IR, an extremely sensitive system is produced. The spectrum generated by the interferogrammed light is Fourier Transformed into an IR spectrum. FT-IR employs a
noise ratio of the FT over conventional IR greatly improves the usefulness of the ATR technique. The computer allows for spectral manipulations such as addition, subtraction, and scaling. By subtracting spectra of known samples from that of an unknown sample, it is possible to identify the components of the original spectrum. In this way larger peaks in a mixed sample can be subtracted, making smaller shoulder peaks more prominent. In the case of protein deposition onto a crystal or coated crystal surface,
MATERIALS AND METHODS
Materials
The monomer 2-hydroxyethyl methacrylate (LDT B669F9) was obtained from Alcolac, Inc., 3440 Fairfield Rd.,
Baltimore, Maryland and was used as received.
N-vinyl-2-pyrrolidone (LDT 236-12) was obtained from Monomer-Polymer and Dajak Labs, Inc., 36 Terry Drive, Trevose, Pennsylvania, and was used as received. Dow Corning
silicone rubber tubing (LDT H116336, 0.132 in ID x 0.163 in OD, and LOTS H040101, H070406, 0.076 in ID x 0.125 in DD) and silicone rubber sheeting (LDT H059172) were purchased from GenTec Health Care, Inc., 1265 Thomas Road, Des Moines, Iowa.
Vacuum tubes (Vacutainer 13665), containing 12 mg of siliceous earth, and vacuum tubes (Vacutainer 13206Q), containing 6 mg of sodium EDTA, an anticoagulant, were obtained from Becton-Dickinson, Division of Becton,
Dickinson and Company, Rutherford, New Jersey, and were used for ACT (activated clotting time) and platelet counts,
Platelets were counted on a Spencer "Bright Line"
hemacytometer (cat. 1ij92) made by AO Instrument company, Buffalo, New York. Suture material was acquired from Ethicon. Inc., Somerville, New Jersey. Silastic Medical Adhesive Silicone Type A (LOT H010503) was acquired from Dow Corning corporation Medical Products, Midland, Michigan.
Microscopic examination of the blood exposed surfaces was performed on a JEOL-U3 Scanning Electron Microscope
(SEM), Japanese Electron Optics, Tokyo, Japan. Samples were dried in a Polaron critical point drier (E3000) and sputter coated with a Polaron SEM coating unit (E5100) • Polaron Instruments, Inc.. Warrington, Pennsylvania. The carbon paint was obtained from Acheson Colloids co •• Port Huron, Michigan.
FT-IR evaluations were performed on an IBM IR-98 FT-IR. IBM Instruments, Inc •• Danbury, Connecticut. The GOD
Germanium ATR prism and ATR solid sample holder were also obtained from IBM Instruments. Micro cleaner and hexanes for cleaning the analyzing crystals were generously supplied by Instrument Services, Iowa State University, Ames, Iowa.
Methods
~1hod
!.::
.§.2..!!!.Rle !!~Eil2.tiQ..!!. (!ubin,g:)ultrasonically rinsed in deionized water for 10 minutes, rinsed in distilled water and air dried. Four foot sections were filled with the appropriate nitrogen degassed monomer-solvent solution (5% HEMA/15% NVP/15% methanoll ; 10%
HEMA/10f. NVP/15% methanol; 15% HEMA/5% NVP/15% methanol)• tied securely at both ends, and irradiated in a 6DCo source. The dose was 2500 Grays (0.25 Mrad). Following irradiation,
the tubing samples were filled with a 1:1 solution of ethanol and water to remove any unpolymerized monomer. This solvent was changed several times prior to storage of the tubing samples in a fresh aliquot of solvent. Twenty-four hours prior to surgery the tubing samples were filled with saline.
Implfilltation.
Dogs weighing 25-30 kg were obtained from Laboratory Animal Resources, Iowa state University, Ames, Iowa. The animals were fasted overnight and anesthetized with an intravenous injection of sodium pentobarbital (29 mg/1 kg body weight). Additional anesthesia was administered as needed. Presurgical blood specimens were drawn for platelet counts. The anesthetized animals were placed in a supine position with the legs extended. Nonsterile technique was used.
A 10-12 centimeter incision was made directly external to the femoral artery and vein. Using blunt dissection, the tissues were separated to expose the blood vessels. An ex
vivo, unilaterai shunt was constructed by cannulating both the femoral artery and femoral vein. A two foot section of one type of experimental tubing was inserted and was
maintained with two ligatures around each vessel. Patency of the shunt was monitored every 5 minutes with a Parks 806 Doppler Ultrasound flowmeter. The tubing sample was left in place for
qs
minutes, or until no flow was detected. After removal, the section was flushed gently with saline toremove excess blood without stripping adhering deposits from the wall. A one inch section was fixed in 2% glutaraldehyde for subsequent SEM analysis, while the remainder of the
tubing was air dried prior to FT-IR analysis. This
procedure was repeated in the animal for the remaining three types of tubing. Samples for FT-IR analysis were examined as soon as possible after the surgery.
~.!!l.E.1 e A.!!A.ll'.llli
Microscopic evaluations were made using scanning
electron microscopy. Following fixation in glutaraldehyde, the sections we.re dehydrated in a series of acetone rinses
Half-inch sections of tubing were slit longitudinally through both sides with a scalpel blade. one section was firmly placed in the center on each side of a 450 KRS-5 ATR prism in the solid sample holder. IR spectra were collected with an IBM IR-98 FT-IR and a variable angle ATR accessory.
!leth.QS 2- ~~ g!'.§J!li!!.tiQJ! (Sheet§)
surfaces varying in hydrophilicity were prepared by radiation grafting various formulations of HEMA and NVP monomers onto silicone rubber sheeting. Silicone rubber sheeting (0.02 mm thick), and twelve 12cc syringes were
ultrasonically washed in a mild solution of Ivory Flakes for 10 minutes, ultrasonically rinsed for 10 minutes in
deionized water, rinsed in distilled water, and air dried. scintillation vials were filled with the appropriate
nitrogen degassed monomer-solvent solution (5% HEllA/15%
NVP/15% methanol; 10% HEllA/10% NVP/15% methanol; 15% HEllA/5% NVP/15% methanol). 10x50 mm strips of silicone rubber
sheeting were suspended in the solutions and exposed to 2500 Grays (0.25 llrad) irradiation in a &oco source. The
r12~cell g~g£~~~tiQ.!l.
Twelve 12cc polypropylene syringes were cut, six at the 12 cc mark and six at the 8 cc mark. Each syringe was
attached to a 1 foot length of silicone rubber tubing (0.076 in ID x 0.125 in OD) by means of a cuff formed from a half inch piece of silicone rubber tubing (0.132 in ID x 0.183 in OD). The cuff was strengthened by the addition of a small bead of Silastic Medical Adhesive Silicone Type A and allowed to dry overnight. To minimize surface material interactions inside the flowcell, each syringe assembly was coated with a thin layer of silicone rubber. The syringe assemblies were held vertically and immersed approximately one half inch below the surface of a solution composed of a 6 inch bead of Silastic Medical Adhesive Silicone Type A well mixed with 60 cc of hexanes. A 50cc syringe at the upper end of the tubing was used to draw the solution into the syringe. After removal from the silicone rubber/hexanes solution, each syringe was blotted several times at the open end, and hung vertically to dry for several days. A
gently pressing it into place with a wooden applicator stick soaked in saline. The samples were arranged
counterclockwise in the following order, silicone rubber, 53 HEMA/153 NVP, 103 HEMA/103 NVP, 153 HEMA/53 NVP. In this manner, four surfaces varying in hydrophilicity could be simultaneously exposed to flowing blood. on the morning of surgery, the longer syringe with the attached samples was joined to the shorter syringe using a half inch piece of silicone rubber as a cuff. This created a flowcell with the samples equidistant from the two ends. The entire system was filled with saline and clamped at both ends.
I!!!~antation
to and from the flowcell cut, and the flowcell opened to facilitate rinsing the lumen in several changes of saline. Fifteen minutes was arbitrarily chosen for the time of exposure to blood. The syringe with samples was stored in saline until the end of the experiment. The procedure was repeated for the left leg. At the end of the experiment, the samples were pried loose by carefully inserting a
screwdriver under each sample. As quickly as possible, the samples were cut in half. One section was suspended with suture material and fixed in glutaraldehyde while the other was allowed to air dry. Again the samples for FT-IR were analyzed as soon as possible following surgery.
asm£le Ans!xsi§
Microscopic evaluations were made as in Method 1.
IR spectra were collected with an IBM IR-98 FT-IR and a variable angle ATR accessory. The parameters used to
collect, store, and plot the spectra are listed in Appendix A. A polished 600 germanium crystal was used for all
samples. Samples which had been exposed to blood were placed firmly in contact with one side of the crystal in a solid sample holder.
alignment. This was to determine whether accurate alignment could be produced without using the chopper for alignment. The next set of experiments involved placing 10x2.5 mm
sheets of silicone rubber on the crystal and tightening the sample holder to varying degrees to determine the effect on
the spectrum of pressure on the sample.
For analysis of those samples which had been exposed to blood, 5x10 mm sections were used. Prior to beginning each new sample set, the germanium crystal was cleaned with a cotton ball soaked in Micro cleaner diluted with distilled water, and thoroughly rinsed in distilled water. In between samples, the crystal was cleaned with hexanes and a Kimwipe. A spectrum of the clean crystal (e.g., LIND54) was collected before each new set of samples was run. Each blood exposed sample was applied firmly to the crystal and a spectrum was collected.
Specyal .fil!.!?ilfil<tiim§.
After the completion of the experiment, it was
discovered that the high frequency component of the spectra between 1800 and 1qoo wavenumbers was due to water in the sample. To remove this interference, a spectrum of water vapor was collected, stored, and subtracted from the
appropriate spectra. The water vapor spectrum was collected by placing several drops of water on the germanium crystal. Since the IBM system used in this investigation is under vacuum, the water placed on the crystal dissipates as soon as the system pumps down. The spectrum collected represents water vapor in the two meter beam path.
Two methods were utilized for the necessary
subtractions. In the first method, water vapor (LIND93} was subtracted from the "wet" protein coated polymer (LIND56} using the SSM (subtract spectrum manual} command. The SSM real time subtract program determines the subtraction
constant (CON) by subtracting the file assigned to AFB
(e.g., LIND93} from the file assigned to AFA (e.g., LIND56} while using the file assigned to AFC (e.g., LINDSij) as a common reference. The value of CON is automatically stored in the computer memory by the software. With AFN set equal to SS (see Appendix B}, the "dry" protein coated polymer
(DLIND56} was stored as a new file. The SS equation performs the actual subtraction by using the equation,
where the parameters AFA, AFB, and AFC have been
appropriately set, and CON has been determined by the real time subtract program. Next, water vapor was subtracted from the "wet" polymer (LIND55). With AFN equal to SS, the "dry" polymer was stored as (DLIND55). Finally, by
subtracting the "dry" polymer (DLIND55) from the "dry" protein coated polymer (DLIND56) using the SAM (subtract absorbance manual) command, only the "dry" protein remains. AFN is set equal to AS to plot the resulting spectrum. The AS equation subtracts two absorbance files. Figure 2
illustrates the above text in equation form. SSMll SSMll SAMII LIND56 LIND54 LIND55 LIND54 LIND93 LIND54 LIND93 LIND54 DLIND56 - DLIND55
AFN=SS stored as DLIND56
AFN=SS stored as DLIND55
AFN=AS plotted
FIGURE 2. Subtractions in equation form
the second method involved ~ubtracting the "wet"
polymer (LIND55) from the "wet" protein coated polymer
(LIND56), using the SSM command. With AFN=SS, the new "wet" protein spectrum was stored as a new file (NLIND56). In this step the water component of the two spectra should
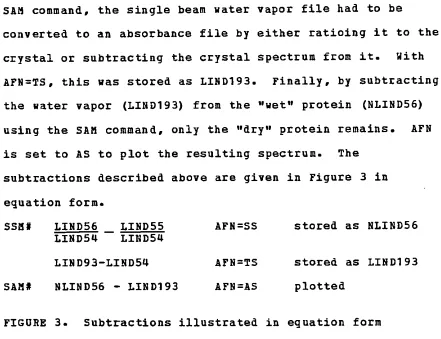
SAM command, the single beam water vapor file had to be
converted to an absorbance file by either ratioing it to the crystal or subtracting the crystal spectrum from it. With AFN=TS, this was stored as LIND193. Finally, by subtracting the water vapor (LIND193) from the "wet" protein (NLIND56) using the SAM command, only the "dry" protein remains. AFN is set to AS to plot the resulting spectrum. The
subtractions described above are given in Figure 3 in equation form.
SSMI
SAHi
LIND56
LIND Sq LIND55 LIND5ij LIND93-LIND5ij NLIND56 - LIND193
AFN=SS stored as NLIND56
AFN=TS stored as LIND193 AFN=AS plotted
FIGURE 3. Subtractions illustrated in equation form
Although both subtraction methods yielded identical results, the second method was chosen because it involved one less subtraction. Care must be taken when using the subtract programs as it is possible to artificially generate data.
Protein S~ftr~
To obtain protein ATR spectra, dilutions of albumin and fibrinogen were made at 50 mg/ml and 5 mg/ml,
[image:39.561.45.486.79.418.2]before applyin~ 0.06 ml of albumin. Again the crystal was
air dried and a spectrum was collected.
!14
.ru;~ ~ili.£2~ .!!~~L sn~ Hxdr2g:~!a5x10 mm sections of silicone rubber, 5% HEMA/15% NVP on silicone rubber, 10% HEMA/10% NVP on silicone rubber, and
15~ HEMA/5~ NVP on silicone rubber were allowed to air dry.
RESULTS AND DISCUSSION
Method 1
~122S Data- ~21hog
1
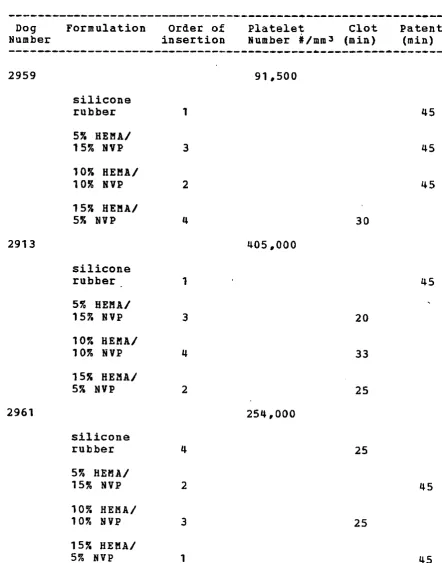
As can be seen from Table 2, the first formulation inserted always remained patent for at least qs minutes of exposure to flowing blood, the second remained patent twice and clotted once, the third remained patent once and clotted twice, and the fourth clotted each time. It was decided that recannulating the artery and vein four times was too traumatic for the vessels. Therefore, this method was abandoned.
g~~22~lt2
Silicone rubber (dog 29S9) in Figure ija has a uniform distribution of platelets while Figure qb, (also silicone rubber (dog 2913)) shows an uneven distribution of
leucocytes. Figures ijc and ijd are micrographs of SY.
HEMA/1SY. NVP (dog 29S9) and represent adjacent areas on the same surface, while S% HEMA/1S% NVP (dog 2961) in Figure qe shows a uniform distribution of platelets. Platelet
degranulation products can be observed in Figures ijc, ijd,
and Sa. Mostly white cells are attached to the 10~ HEMA/10%
Dog Formulation Order Of Platelet Clot Patent
Number insertion Number #/mmJ (min) (min)
---·---2959 91,500
silicone
rubber 1 q5
53 HEl!A/
15% llVP 3 q5
1 03 HEl!A/
103 llVP 2 q5
1 53 HEl!A/
53 llVP 30
2913 ll05
.ooo
silicone
rubber 1 q5
53 HEl!A/
151. II VP 3 20
103 HEl!A/
10% liVP q 33
15% HEMA/
53 NVP 2 25
2961 25!l,OOO
silicone
rubber 25
5% HEl'lA/
153 llVP 2 q5
103 HEl!A/
10% llVP 3 25
153 HEl!A/
53 llVP 1 q5
[image:42.563.43.486.114.678.2]---are presented.
!!=II!
ResulteFigure 6 illustrates a representative silicone rubber IR spectrum from implantation Method 1. A very large peak is observed at 1258 wavenumbers and is believed to be a methyl vibration caused by deformation of the silicone rubber matrix when the tubing was flattened against the crystal. Sharp peaks often shift location in the spectrum by migrating a few wavenumbers in either direction. Such shifts in peak frequency make spectral subtraction
impossible. In addition, the large 1258 cm-1 band
interferes with the 1240 cm-1 band which is common to many proteins.
Method 2
Bloo.Q Data- ~thod
l
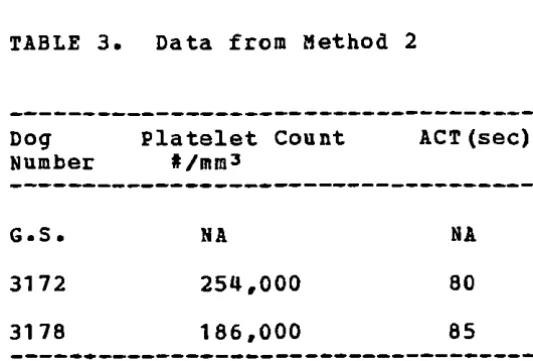
The blood data from Method 2 are presented in Table 3. These values are normal for healthy dogs.
!ifil!li
Q~I.llliQll!iAfter flushing them with saline, the flowcells were observed macroscopically. There were no clots or
erythrocytes visible in either flowcell from dog G.s.
en
I-I-<
z
::J
w
u
z
([
IT.l Ir
0
en
IT.l
([
0.2.
0. 15
0.1
0.05
18 0
16 0
llf 0
12 0
10 0
8 0
WRVENUMBERS CM-1
FIGURE 6. Spectrum of silicone rubber tubing showing large peak at 1256 wavenumbers
.i=
[image:48.786.146.668.50.461.2]TABLE 3. Data from Method 2
Dog Number
G.S. 3172 3178
Platelet Count
I/mm~
NA
254,000 186,000
ACT(sec)
NA 80 85
---In particular, silicone rubber from both flowcells and 10% HEHA/10% NVP from the right flowcell appeared to have larger deposits of erythrocytes than the other surfaces from the same dog. While examining the right flowcell from dog 3178,
[image:49.566.46.313.72.252.2].§.!~ Results
Figures 7a through 12e are SEM micrographs illustrating the blood's response to surfaces varying in hydrophilicity. some of the red cells found in the following SEM micrographs are crenated as in Figure 7a. This is believed to be a
fixation artifact. Compare the crenated cells of Figure 7a with the normal cells in Figure 7b. A diversified response is seen in Figures 7a to 8d (dog 3178). An extensive
network of fibrin with entrapped erythrocytes is observed on silicone rubber (Figure 7a) and 5% HEMA/15% NVP (Figures 7b and 7c), while a large thrombus with entrapped white cells is seen on another area of 5% HEMA/15% NVP (Figure 7d). The reaction to 10% HEKA/10% NVP ranges from areas of complete fibrin cover with some formed elements (Figures 7e and 7f) to areas with predominantly leucocytes and almost no fibrin
(Figure Sa). Note the uniform alignment of the fibrin
strands in Figure 7e. The reaction to 15% HEKA/5% NVP also ranges from an extensive fibrin network (Figures Bb and Be) in some areas to minimal deposition in others (Figure Bd).
silicone rubber, but the surface attracted more fibrin than erythrocytes. A few leucocytes are seen on Figure 9.
Figure 9c also shows a few platelet clumps. Almost no fibrin is present on the 103 HEMA/103 NVP (Figure lOa) and 153 HEMA/53 NVP surfaces (Figures lOb and lOc), but varying quantities of platelets and white cells are attached.
The response of dog 3172 to the test materials is
illustrated in Figures lla through 12e. The deposition onto this silicone rubber (Figure lla) surface appeared to occur in streaks. The direction of flow was perpendicular to. the streaks. At higher magnification (Figure llb) the light areas are seen to be primarily erythrocytes and fibrin while the dark areas (Figure llc) have only a few adherent
platelets. Deposition onto 53 HEMA/153 NVP ranged from areas of extensive fibrin (Figure lld) to areas with only a few white cells (Figure lle). Note the development of
pseudopods on the platelets. Mostly erythrocytes and fibrin were attracted to the 103 HEMA/103 NVP surface (Figures 12a to 12c). A cluster of platelets can be observed in the center of Figure 12c. The 153 HEMA/53 NVP surface (Figures 12d and 12e) attracted the least fibrin, and the adherent formed elements range from primarily platelets to a few white cells.
overall, the least material adhered to the 153 HEMA/5~
(scale bar=10 µm)
15
Kev. (scale bar
A=33.3 µm,scale bar B, c, D,
were heavily covered with fibrin, more fibrin was found on the silicone rubber surfaces. However, some regions of the silicone rubber surfaces were clean, and large fibrin and red cell deposits were also found on each of the other surfaces. In general, the silicone rubber surfaces were more heavily covered with fibrin and cellular elements than the hydrogel grafted samples. The reactions observed are believed to be the result of decreased adhesion to the
hydrophilic hydrogel samples compared with silicone rubber. In general, the greater the degree of hydrophilicity of the
hydrogel, the less material was observed to be adsorbed after the 15 minute exposure (i.e., 15% HEMA/5% NVP and 10% HEMA/10% NVP compared with the 5% HEMA/15% NVP samples).
FT-IR l!!!sult§
The spectra collected during the FT-IR experiments are presented in Figures 13 to 22.
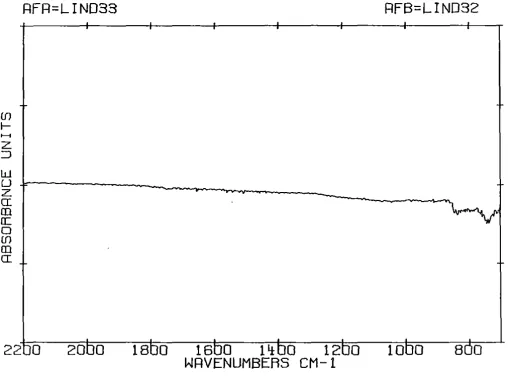
Figure 13 shows the ratio of two germanium spectra that were collected during the alignment experiment. The
resulting curve is almost a straight line and indicates that the two original spectra were nearly identical.
([)
I-
,__,
z
::::J
w
LJ
z
IT
m
a:
0
([)
m
IT
22 0
20 0
18 0
16 0
11± 0
12 0
WRVENUMBEAS CM-1
10 0
8 0
FIGURE 13. Comparison of two germanium spectra collected during alignment experiment
U1
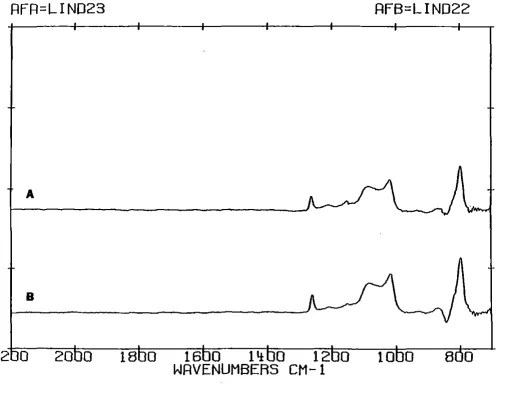
[image:65.792.150.663.51.436.2]Note the increase in intensity of the 1258, 1013, and 793 cm-1 silicone rubber bands in (B).
When performing the subtractions (see Appendix C), one peak is monitored. The peak chosen should exist•in the reference spectrum, but not in the sample spectrum. The subtraction continues until the peak disappears. In some instances, the peak cannot be completely subtracted and a dispersion curve results. Part of the peak is above and part below the spectrum as indicated by the arrow in Figure 15 which was obtained by subtracting a spectrum of water vapor from the spectrum of protein coated 5% HEHA/15% NVP. Dispersion curves are observed when an interaction occurs that shifts the peak a few wavenumbers. For example, if silicone rubber is subtracted from hydrogel coated silicone rubber and a dispersion curve results when trying to
subtract a particular peak, then the hydrogel has reacted with the silicone rubber causing a frequency shift in the silicone rubber bands.
The next series of spectra (Figures 16 to 19) is
A
B
22 0
20 0
18 0
16 0
1'± 0
12 0
10 0
8 0
WRVENUMBERS CM-1
FIGURE 14. Spectra resulting from applying silicone rubber sheets to the crystal with varying degrees of pressure, upper spectrum (A) was collected using relatively less pressure than lower spectrum (B)
.
[image:67.788.147.655.48.445.2]({)
I-,_.
z
:::J
w
u
z
a:
m
a::
0
({)
m
a:
17 0
160
150
ll±O
130
12 0
11 0
WRVENUMBERS CM-1
FIGURE 15. Spectrum of 5~ HEMA/15% NVP after exposure to
blood illustrating dispersion curves indicated by arrow
[image:68.789.165.656.48.423.2]Ill
>--
z :J0. I
0.075
ti
0.05 z a: C'.l a:. 0 Ill C'.la: 0.025
Ill
>
-z :Jo.o
0.03 0.0225ti
z 0 .015a: C'.l a: 0 Ill C'.l
a: 0.0075
0.0
RFR=LIND56 RFB=LIND5~
RFR=LIND56 RFB=LIND55 RFC=LIND5~
B
[image:69.564.100.481.84.606.2]ff) t-z :::J 0. 1 0.075
tJ
z 0.05CI. ID a:: a ff) ID
CI. 0.025
ff) t-z :::J
o.o
0.03 0.0225tJ
0.015z a: ID a::
a ff)
ID
a: 0.0075
0.0
RFR=LIND57 RFB=LIND5~
RFR=LIND57 RFB=LIND87 RFC=LIND5~
FIGURE 17. Absorbance spectra of 53 HEMA/153 NVP after 15 minutes exposure to blood (A) and the protein layer after subtraction of the 5% HEMA/153 NVP
[image:70.562.106.481.74.588.2]en
,_
-
z ::J0. 1
0.075
tJ
0.05 z a: m a:. 0 en ma: 0.025
en
,_
-z ::Jo.o
0.01 0.0025tJ
-0.005 z a: m a: a en ma: -0.012
RFR=LIND58 RFB=LIND5~
RFR=LIND58 RFB=LINDBB RFC=LIND5~
FIGURE 18. Absorbance spectra of 103 HEMA/lOr. NVP after 15 minutes exposure to blood (A) and the protein layer after subtraction of the 103 HEMA/107. NVP
[image:71.564.97.506.74.592.2]en f-~ z :::J 0.075 w
u z 0.05
a: m a:: D en m
a: 0.025
en f-z :::J 0.0 0.01 0.0025
tJ
-0.005 z a: m cc D en ma: -0.012
RFR=LINDSO RFB=LINDBS RFC=LIND5~
FIGUF.E 19. Absorbance spectra of 153 HEMA/53 NVP after 15 minutes exposure to blood (A) and the protein layer after subtraction of the 153 HEMA/Sr. NVP
To determine the relative quantity of protein on each surface based on the FT-IR spectra, the spectra were rated
and ranked. Because the 1650 and 1550 cm-1 bands are common to all plasma proteins, these bands were used to rate the spectra. Within a group composed of silicone rubber, 5% HEMA/15% NVP, 10% HEMA/10% NVP, and 15% HEMA/5% NVP, the spectrum with the most protein was rated a ij, the next lower
a 3, etc. The ratings were always started with the spectrum having the largest peaks and progressed to those having the smallest. If two spectra could not be differentiated, they were scored equally. The results of the ratings are
presented in Table ~. The ratings were totalled for a final
comparison. Note that within the hydrogel coated samples, 15% HEMA/5% NVP had the lowest protein deposits compared with 10% HEMA/10% NVP (intermediate) and 5% HEMA/15% NVP
(the most). Also, the amount of protein on the 15% HEMA/5% NVP formulation was somewhat lower than for silicone rubber. Within a formulation type for any particular dog, usually less protein was seen deposited for samples initially
exposed (i.e., right leg, initial insertion, compared with left leg, latter insertion).
TABLE 4. Ratings of Protein Spectra
---Dog number S.R.* 5% H/15% N 10% H/10% N 15r. H/5ll N---G.S. (right) 3 4 2 1
G.s. (left) 4 4 3 2
3172 (right} 1 4 3 2
3172 (left) 2 4 3 1
3178 (right) 1 4 3 2
3178 (left) 2 3 4 2
---Total 13 23 18 10
*S.R.=silicone rubber, H=HEl!A, N=NVP
---spectra. These are illustrated in Figure 21 with the spectrum resulting from subtraction method 1 shown
vertically displaced (i.e., subtraction method 1 results in A, subtraction method 2 results in B).
The spectra collected after drying single protein
[image:74.566.50.491.117.324.2]en
I-I-<
z
::J
w
u
z
a
en
cc
0en
en
a
22 0
20 0
18 0
16 0
l'± 0
12 0
WRVENUMBERS CM-1
FIGURE 20. Absorbance spectrum of water vapor
[image:75.787.154.671.50.426.2]CJ)
I-t-i
z
::J ·W
u
z
a:.
m
a:
0CJ)
m
a:.
RFR=NLIND56
A
B
RFB=LIND193
.A~
22 0
20 0
18 0
16 0
14: 0
12 0
WRVENUMBERS CM-1
FIGURE 21. Comparison of spectra resulting from water subtractions. the upper spectrum (A) was
obtained by method 1 and the lower spectrum (B) by method 2
[image:76.788.144.679.46.466.2]