Dissertations
1982
Description and genetic analysis of H-2 associated
genes controlling early embryo development
Simon Ber Goldbard
Iowa State University
Follow this and additional works at:
https://lib.dr.iastate.edu/rtd
Part of the
Genetics Commons
This Dissertation is brought to you for free and open access by the Iowa State University Capstones, Theses and Dissertations at Iowa State University Digital Repository. It has been accepted for inclusion in Retrospective Theses and Dissertations by an authorized administrator of Iowa State University Digital Repository. For more information, please [email protected].
Recommended Citation
Goldbard, Simon Ber, "Description and genetic analysis of H-2 associated genes controlling early embryo development " (1982).
Retrospective Theses and Dissertations. 7042.
This was produced from a copy of a document sent to us for microfilming. While tl most advanced technological means to photograph and reproduce this documei have been used, the quality is heavily dependent upon the quality of the materia submitted.
The following explanation of techniques is provided to help you understar markings or notations which may appear on this reproduction.
1.The sign or "target" for pages apparently lacking from the document photographed is "Missing Page(s)". If it was possible to obtain the missing page(s) or section, they are spliced into the film along with adjacent pages. This may have necessitated cutting through an image and duplicating adjacent pages to assure you of complete continuity.
2. When an image on the film is obliterated with a round black mark it is an indication that the film inspector noticed either blurred copy because of movement during exposure, or duplicate copy. Unless we meant to delete copyrighted materials that should not have been filmed, you will find a good image of the page in the adjacent frame. If copyrighted materials were deleted you will find a target note listing the pages in the adjacent frame. 3. When a map, drawing or chart, etc., is part of the material being photo
graphed the photographer has followed a definite method in "sectioning" the material. It is customary to begin filming at the upper left hand corner of a large sheet and to continue from left to right in equal sections with small} overlaps. !f p.ecessar/, sectioning is continued again—beginning below the! first row and continuing on until complete.
4. For any illustrations that cannot be reproduced satisfactorily by xerography, photographic prints can be purchased at additional cost and tipped into your: xerographic copy. Requests can be made to our Dissertations Customer:
Services Department.
-5. Some pages in any document may have indistinct print. In all cases we have; filmed the best available copy.
University
Microfilms
international
Goldbard, Simon Ber
DESCRIPTION AND GENETIC ANALYSIS OF H-2 ASSOCIATED GENES CONTROLLING EARLY EMBRYO DEVELOPMENT
lovi/a State University PilD. 1982
University
Microfilms
In all cases this material has been filmed in the best possible way from the available copy. Problems encountered with this document have been identified here with a check mark V .
1. Glossy photographs or pages \/ 2. Colored illustrations, paper or print 3. Photographs with dark background // 4. Illustrations are poor copy
5. Pages with black marks, not original copy
6. Print shows through as there is text on both sides of page 7. Indistinct, broken or small print on several pages
8. Print exceeds margin requirements 9. Tightly bound copy with print lost in spine 10. Computer printout pages with indistinct print
11. Page(s) lacking when material received, and not available from school or author.
12. Page(s) seem to be missing in numbering only as text follows. 13. Two pages numbered . Text follows.
14. Curiing and wrinkled pages 15. Other
genes controlling early embryo development
by
Simon Ber Goldbard
A Dissertation Submitted to the
Graduate Faculty in Partial Fulfillment of the
Requirements for the Degree of
DOCTOR OF PHILOSOPHY
Maj or: Immunobiology
Iowa State University Ames, Iowa Approved:
In Charge of Major Work
1982
Signature was redacted for privacy.
Signature was redacted for privacy.
TABLE OF CONTENTS
Page
I. INTRODUCTION 1
A. The Early Development of the Mouse 1
1. Morphology 2
2. Molecular events in preimplantation 4
3. The surface of preimplantation embryos 5
a. Embryos as antigens 5
b. Teratoma antigens 7
c. H-2 antigens and the embryo surface 9
4. The timing of cleavage in early embryos 12
B. Monoclonal Antibodies 14
1. Plasmacytomas 14
2. Interspecies and intraspecies hybridomas 16b
3. T cell hybridomas 18
4. Applications of monoclonal antibodies 18
II. MATERIALS AND METHODS 21
A. Mice 21
B. Collection of Embryos 21
C. Determination of Cell Number 22
D. Determination of Superovulation Time 23
E. Production of Monoclonal Antibodies 23
1. Cells 23
2. Cell freezing and storage 25
3. Immunization of mice 26
4. Fusion protocol 27
5. Cloning 30
a. Soft agar cloning 30
b. Cloning by limiting dilution 31
6. Preparation of selective medium 32
7. Expansion of cells and production of ascites
fluid 32
a. Cytotoxicity test 33
b. Two-step microcytotoxicity test 33
c. Indirect immunofluorescence using L-929
fibroblasts 34
d. Cell fixation 35
e. Indirect immunofluorescence using lymphocytes 35
9. Purification of monoclonal antibodies 36
a. Protein A sepharose chromatography 36 b. Ammonium sulphate precipitation of ascites 37
10. Immunoglobulin class and subclass analysis of
monoclonal antibodies 38
F. Detection of H-2 Antigens on Preimplantation Embryos 39
1. Indirect immunofluorescence 39
2. Embryo cytotoxicity assay 39
3. Indirect embryo cytotoxicity test 41
G. Indirect Test Using Thymocytes 41
H. Statistical Analyses 42
III. RESULTS 44
A. Effect of the H-2 Complex on Early Development 44
1. Development of the Tarkovski method using CFl
embryos 44
2. Association of slow development with H-2^
haplotype 44
3. Proof of association using congenic mice 50
4. Earliest action of Ped gene 56
a. Ovulation time 56
b. Time of first cleavage division 56
5. Rate of development 62
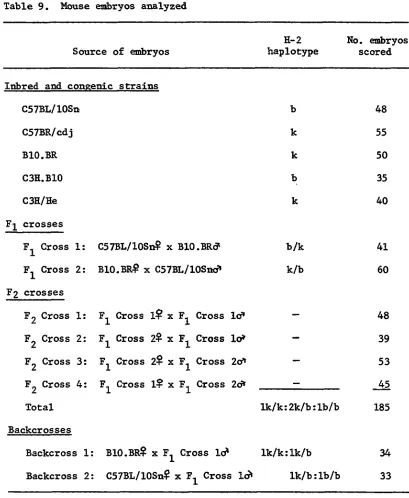
6. Genetic analysis 67
a. Ft^ generation 67
b. F2 generation 67
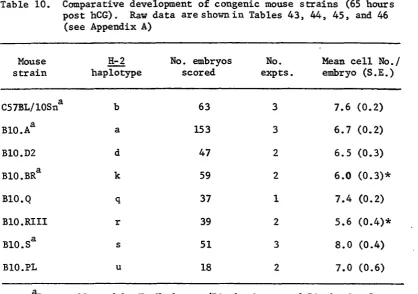
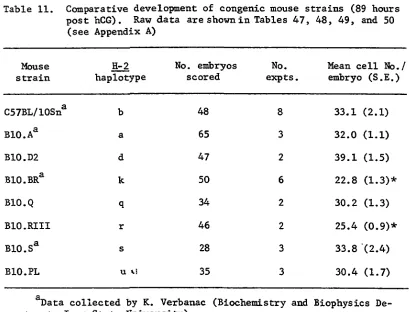
7. Comparative development of congenic mouse strains 69
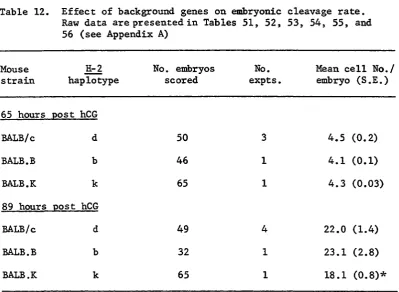
8. Effect of background genes 73
9. Gene complementation studies 74
1. Nomenclature of monoclonals 76
2. Screening methods 90
3. Production of ascites tumors 93
4. Purification of monoclonal antibodies 94
a. Protein A sepharose purification 94
b. Ammonium sulphate precipitation 94
5. Analysis of monoclonals 99
a. Control ascites 99
b. Isotype analyses of monoclonal antibodies 99 c. Titration of monoclonal antibodies 99 d. Specificity of monoclonal antibodies 100
C. Detection of H-2 Antigens on Preimplantation Embryos 112
1. Indirect immunofluorescence 112
2. DNA synthesis assay 112
a. Screening of guinea pig complement 112 b. Titration of ascites using embryos 113
3. Indirect cytotoxicity assay for embryos 117
a. Titration of antiserum with thymocytes 117 b. Titration of the antibodies using embryos 118
IV. DISCUSSION 120
V. LITERATURE CITED 131
VI. ACKNOWLEDGMENTS 142
VII. APPENDIX A. RAW DATA FOR THE GENETIC ANALYSES 143
VIII. APPENDIX B. RAW DATA FOR LABELING OF EMBRYOS 203
IX. APPENDIX C. CELL FUSION PROTOCOL IN SUMMARY 209
LIST OF FIGURES
Page
Figure 1. Picture of a CFl blastocyst (89 hours post hCG)
fixed by the Tarkovski method 45
Figure 2. Correlation between cell number (CFl embryos) and time post hCG injection. Data were collected using
the Tarkovski method 47
Figure 3. Graphic representation of association of slow
development with H-2^ haplotype (65 hours post hCG) 52
If Figure 4. Graphic representation of the association of H-2
haplotype with slow development (89 hours post hCG) 54
Figure 5. Time of ovulation of C57BL/10Sn (o), BIO.BR (o), and
C57BR/cdj (
A
) mice 58Figure 6. Time of first cleavage division of C57BL/10Sn (o),
BIO.BR (a) and C57BR/cdj (a) embryos 60
Figure 7. Rate of development of C57BL/10Sn (o), BIO.BR (
Q)
and C57BR/cdj (
A
) embryos 63Figure 8. Theoretical curve showing development of a slow and
a fast strain 65
Figure 9. Frequency histograms of P]^, P2, F^, F2, and
back-crosses 71
Figure 10. Fusion 1 80
Figure 11. Fusion 2 81
Figure 12. Fusion 3 82
Figure 13. Fusion 4 83
Figure 14, Fusion 5 and fusion 6 84
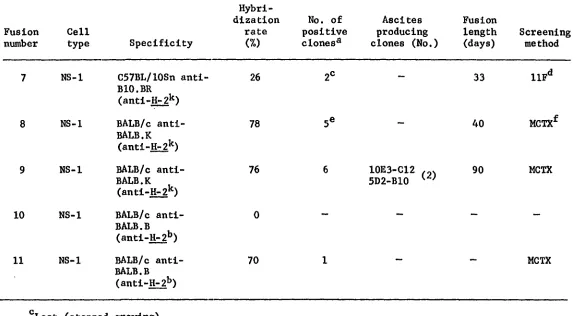
Figure 15. Fusion 7 85
Figure 16. Fusion 8 86
Figure 17. Fusion 9 87
Figure 18. Fusion 10 88
Figure 20 ^
and 21. BIO.BR lymphocytes labeled with anti-H-2 monoclonal
antibodies (9A2D2) 91
Figure 22. Elution profile of protein A sepharose purification
of 2H1-5B monoclonal antibody 95
Figure 23. Elution profile of protein A sepharose purification
of 9A2-D2 monoclonal antibody 97
/
Figure 24. Titration curve for 2H1-5B monoclonal antibodies 101
Figure 25. Titration curve for 9A2-D2 monoclonal antibodies 103
Figure 26. Titration curve for 5D2-B10 monoclonal antibodies 105
Figure 27. Titration curve for 10E3-C12 monoclonal antibodies 107
Figure 28. Titration curve for 11-4.1 monoclonal antibodies 109
Figure 29. Titration curves for control (•) and D52-B10 (o)
ascites using A/J embryos 114
LIST OF TABLES
Page
Table 1. Summary of cell lines used for hybridoma production 16b
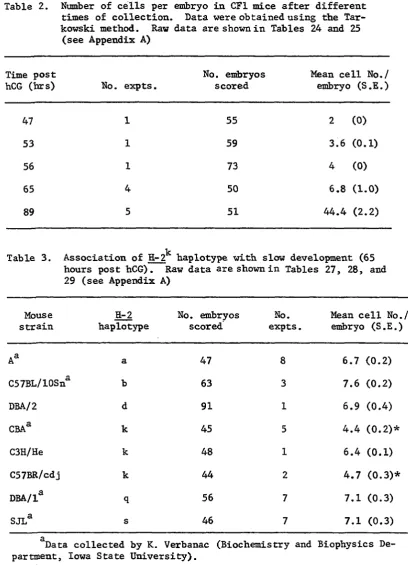
Table 2. Number of cells per embryo in CFl mice after dif ferent times of collection. Data were obtained using the Tarkowski method. Raw data are shown in Tables
24 and 25 (see Appendix A) 49
Table 3. Association of H-2^ haplotype with slow development (65 hours post hCG). Raw data are shown in Tables 27,
28, and 29 (see Appendix A) 49
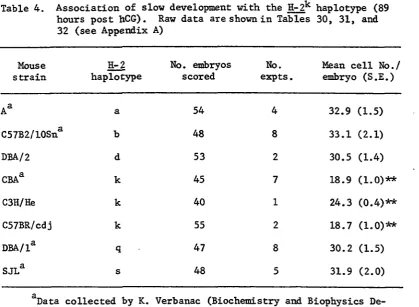
Table 4. Association of slow development with the H-2^ haplo type (89 hours post hCG). Raw data are shown in
Tables 30, 31, and 32 (see Appendix A) 50
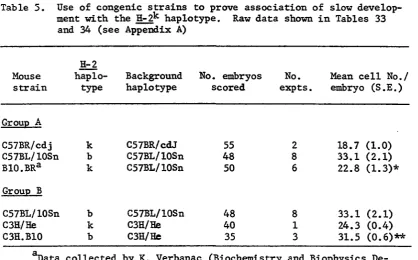
Table 5. Use of congenic strains to prove association of slow development with the H-2^ haplotype. Raw data shown
in Tables 33 and 34 (see Appendix A) 51
Table 6a. Comparison of cell number per embryo among inbred and
congenic strains 57
Table 6b. Analysis of generation embryos (65 hours post hCG). Raw data is presented in Tables 35 and 36 (see Ap
pendix A) 67
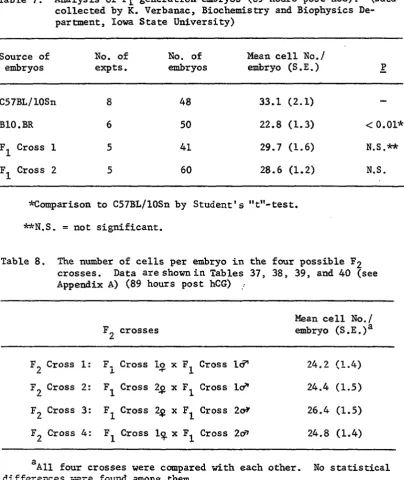
Table 7. Analysis of F^ generation embryos (89 hours post hCG).
(Data collected by K. Verbanac) 68
Table 8. The number of cells per embryo in the four possible F2 crosses. Data are shown in Tables 37, 38, 39, and
40 (see Appendix A) 68
Table 9. Mouse embryos analyzed 70
Table 10. Comparative development of congenic mouse strains (65 hours post hCG). Raw data are shown in Tables 43,
44, 45, and 46 (see Appendix A) 73
Table 11. Comparative development of congenic mouse strains (89 hours post hCG). Raw data are shown in Tables 47,
48, 49, and 50 (see Appendix A) 74
Table 12. Effect of background genes on embryonic cleavage rats. Raw data are presented in Tables 51, 52, 53,
75 77 99 100 111 III 113 115 116 118 119 144 146 148 150 153 155 157 159 160 162
Studies on gene complementation. Raw data are shown in Tables 57, 58, 59, and 60 (see Appendix A)
Summary of fusions
Testing of control ascites against lymphocytes. Figures show percent killing of lymphocytes
Isotypes of monoclonal antibodies
Specificity of monoclonal antibodies
Theoretical and probable specificities to which the monoclonal antibodies could be directed
Screening of guinea pig complement
Detection of H-2 antigens on A/J embryos with mono clonal antibodies
Inhibition of DNA synthesis (+ S.E.) in embryos after being treated with monoclonal ascites at a 1:20 dilution. (Raw data are shown in Tables 63, 64, and 65, Appendix B)
Block titration of direct (mouse anti-mouse) and indirect (rabbit anti-mouse) Ig antibodies using thymocytes
Indirect cytotoxicity test with DBA/2 embryos
CFl data (65 hours post hCG)
CFl data (89 hours post hCG)
Raw data for Figure 7
DBA/2 data (65 hours post hCG)
C3H/HeJ data (65 hours post hCG)
G57BR/cdj data (65 hours post hCG)
DBA/2 data (89 hours post hCG)
C3H/HeJ data (89 hours post hCG)
C57BR/cdj (89 hours post hCG)
163 164 166 167 169 170 172 174 175 176 178 179 180 181 183 184 186 187 189 191 193 195 196 198 199 200
C3H.B10 (89 hours post hCG)
Cross 1 (65 hours post hCG)
Cross 2 (65 hours post hCG)
Fg Cross 1
F^ Cross 2
F2 Cross 3
Fg Cross 4
Backcross 1. 7^7^
Backcross 2. F^P^
B10D2 (65 hours post hCG)
BIO.Q (65 hours post hCG)
BIO.RIII (65 hours post hCG)
BIO.PL (65 hours post hCG)
B10.D2 (89 hours post hCG)
BIO.Q (89 hours post hCG)
BIO.RIII (89 hours post hCG)
BIO.PL (89 hours post hCG)
BALB/c (65 hours post hCG)
BALB.B (65 hours post hCG)
BALB.K (65 hours post hCG)
BALB/c (89 hours post hCG)
BALB.B (89 hours post hCG)
BALB.K (89 hours post hCG)
CBAg X BALB/cd*(65 hours post hCG)
BALB/c^ X CBAcf (65 hours post hCG)
Table 60. CBAg. x BALB/cô* (89 hours post hCG) 202
Table 61. Raw data for Table 20 204
Table 62. Raw data for Table 20 205
Table 63. Raw data for Table 21 (dilution 1:20) 206
Table 64. Raw data for Table 21 (1:20 dilution) 207
Table 65. Raw data for Table 21 (1:20 dilution) 208
Table 66. Variances of P., P., F., F„ and backcross genera
I. INTRODUCTION
A. The Early Development of the Mouse
After fertilization, the zygote undergoes a series of cell divi
sions that culminate in the implantation of the embryo into the uterine
wall. Within 24 to 48 hours of fertilization, the zygote divides it
self and gives rise to two biastomeres of approximately equal size
(Rafferty, 1970). During this division, and the three subsequent ones,
the embryos are named according to the cell stage (i.e., "4 cell" stage
embryos or "8 cell" stage embryos). The next division brings a dramatic
morphological alteration. The blastomeres "compact" to give a solid
ball of cells, the morula, in which individual cells cannot be discerned
by gross observation. Cavitation characterizes the next embryonic
stage which generally occurs one day after the morula stage is reached.
This is the early blastocyst stage. Here, the embryo consists of an
outer layer of trophéetoderm cells which surround a blastocoelic cavity
and a solid cluster of cells called the inner cell mass or ICM (Daniel,
1978).
Most mammalian embryos go through another stage called late
blastocyst. However, at this stage, embryos can start to differ
dramatically among mammalian species. While a mouse embryo is relatively
small (100 (jan diameter) having only 250 cells at implantation (Rafferty,
1970), a pig blastocyst could be one meter long with millions of cells.
However, early development is so similar between mammalian species that
easy and useful comparisons can be made. Due to its availability,
Mice are relatively inexpensive and genetically inbred, recombinant,
and congenic strains are available.
There is very little information about how early development is
controlled. Several approaches have been taken for the study of
pre-Implantation development. The first and simplest way to study
development would be the observation of morphological changes during
ontogeny.
1. Morphology
Tarkowski and Wroblewska (1967) showed that individual cells from
"4 to 8" cell embryos are equivalent and totipotent. However, by
the morula stage, the differentiation of blastomeres into trophoblast
and inner cell mass depends in the first instance on their position
occupied in the morula. That is, the "inside" and "outside" cells
of the morula will be committed to different patterns of differentia
tion (Hillman et al., 1972; Kelly, 1979).
It is at the morula stage that most changes start to occur. The
first change is compactation which starts at the 8-16 cell stage
and leads to lack of definition of individual blastomeres. At this
stage, the blastomeres appear to maximize contact with neighboring
cells and very often assume irregular shapes. Here the blastomeres
form tight junctions (Ducibella et al., 1975) and exhibit differences
in cytoplasmic basophilia between cells, which may precede differentia
tion (Calarco and Brown, 1969).
The start of the blastocyst stage is marked by the formation of
cytoplasmic vesicles (Calarco and Brown, 1969). The expansion of the
blastocoel, the formation of the trophoblast and the ICM are simultaneous
and critical events in development. The trophoblast will develop into
the placenta and other fetal membranes, while the ICM gives rise to the
embryo proper and some of its extraembryonic structures (Rossant, 1977).
Snow (1973) has suggested that determination does occur as early as *
the 16 cell stage embryo.
These experiments are by no means conclusive, since no other evi
dence for early determination has been put forward. It is unclear when
I CM and trophectoderm cells are committed to their respective patterns
of differentiation. By producing hexaparental mice. Markert and Fetters
(1978) showed that at least three ICM cells give rise to a fetus. Other
studies have shown that ICM cells are not committed until primary ecto
derm and endoderm are formed (Pederson et al., 1977).
In contradiction to these studies, Modlinski (1981) has shown that
ICM and trophoblast cells may be already committed at the early blasto
cyst stage. The study shows that murine trophoblast and ICM nuclei are
different from one another and can trigger different developmental
patterns when transplanted into fertilized mouse eggs. These data sup
port the hypothesis that determination is not a continuous process but
rather occurs just prior to blastocyst formation, all cells being
labile until chat time.
All these studies suggest that commitment at the blastocyst stage
is a two-way event, with both trophectoderm and ICM becoming committed
at approximately the same time. Until the exact time of determination
Rossant (1977) suggests that determination may begin around the time of
compactation. However, if determination occurs at a later stage, then
compactation is a phenomenon of different implication. Rossant (1977)
believes that it is unlikely that embryos have a built-in mechanism
that at a given time responds to environment and commits the cells to
differentiation. In summary, morphological studies describe "changes"
during preimplantation development, but provide little insight into the
genetic mechanisms responsible for these changes.
2. Molecular events in preimplantation
The second approach taken to the study of early development has
been the observation of molecular events and gene activities in the
young embryo. It is known that the newly fertilized mammalian egg
actively synthesizes RNA (Warner, 1977). This has been demonstrated
by autodiagraphy and by qualitative and quantitative analysis of the
RNA produced (Schultz and Tucker, 1977). Nevertheless, the demonstration
of synthetic activity by the embryonic genome is not really proof that
the activity is essential for development. The problem is identifying
specific RNA and protein products at each stage of development and
then correlating their presence with a particular function in differentia
tion.
There is evidence that at the blastocyst stage there is mRNA.
synthesis and there is a sufficient supply of ribosomes and tRSA to
allow for the production of differentiated gene products (Sherman,
1979). Also, RNA polymerase enzyme activity has been shown in pre
Warner, 1977). Moreover, relative amounts of the different enzyme
forms were shown to change between the "8 cell" and the blastocyst stage
which may indicate their involvement in differentiation (Warner, 1977).
RNA synthesis has been shown in "2 cell" stage embryos (Ellem and Gwatkin,
1968), in "8 cell" stage embryos (Piko, 1970) and in morula and early
blastocyst stages (Daentl and Epstein, 1973; Epstein and Daentl, 1971).
There appears to be no net increase in protein content in the
cleavage stage embryo (Brinster, 1967). Moreover, in the mouse, there
seems to be a slight decrease in total protein content from fertiliza
tion through cleavage and even in the blastocyst stage (Schiffner and
Spielman, 1976). It is difficult to reconcile this observation with the
fact that differentiation is occurring. It must be deduced that quite
a bit of protein breakdown and resynthesis must occur during this
time. Most of the interest in protein synthesis lies in the study of
surface proteins, since these proteins can be used as markers of dif
ferentiation.
3. The surface of preimplantation embryos
a. Embryos as antigens The third approach that has been
taken in the study of early mouse development is the study of surface
proteins. Research workers have attempted to relate their knowledge
of the cell surface to its. possible role during development. Cell
surface components could play the following roles during preimplanta
tion (Johnson and Calarco, 1980):
1. Recognition (sperm-egg, ICM-trophéetoderm,
2. Adhesion;
3. Motility, particularly in the development and invasiveness
by trophectoderm cells;
4. Communication;
5. Protection of the fetus from maternal immunological attack; and
6. Receptors for the induction of intracellular changes.
The most common and most widely used approach to the study of the
cell surface of embryos is the use of specific antisera. Antibodies
have been produced to embryos at all stages of preimplantation from
spermatozoa and unfertilized eggs to the late blastocyst stage. Heath
(1978) produced a rabbit antiserum that reacted with germ cells of
fetal mice. This antibody reacted also with carcinoma cells of four
different teratocarcinoma cell lines. The antiserum also reacted with
germ cells of adult mice but not with nongerminal tissue. This anti
body could be detecting a surface product involved in differentiation.
Xenogeneic antiserum has been raised to unfertilized mouse eggs
(Moskalewski and Koprowski, 1972). This antiserum, which was raised in
guinea pigs, also reacted with preimplantation stage embryos. It must
be pointed out that the antibody was raised against pronase treated
eggs. Thus, these observations have to be analyzed in light of the
fact that the enzyme could affect the surface of the embryos. Pronase
has been shown to profoundly alter cell surface properties (walach,
1972) and the antigenicity of mouse eggs and preimplantation embryos
in particular (Wiley and Calarco, 1975).
In 1975, Wiley and Calarco developed two rabbit antisera, one
antisera were produced by injecting male rabbits with blastocysts freed
of the zonae mechanically by mouth pipet. After being absorbed with
adult mouse tissues, the antisera reacted weakly (immunofluorescence)
with unfertilized mouse eggs and zygotes.
The antisera were not reactive against teratocarcinoma cells. The
second rabbit antiserum prepared by immunization with mouse blastocysts
showed a similar pattern of reactivity with preimplantation embryos
(Johnson and Calarco, 1980). This last antiserum does not cross react
with adult mouse tissues, nor does it react with a number of terato
carcinoma cell lines. Glass and Hansen (1974) described three antisera
raised in rabbits against mouse cumulus oocyte masses, morulas and
blastocysts. Embryos with intact zonae were used. Anti-cumulus oocyte
mass and anti-blastocyst sera, even after absorption with mouse cells,
caused the immediate death of cultivated mouse embryos. This antiserum,
however, had a high activity against the zona pellucida, a problem that
is prevalent in the use of xenogeneic antisera. The zona has been
shown to be a strong immunogen and activity against it can be high
after xenogeneic immunization (Solter and Knowles, 1979). In the search
of finding a stage specific embryonic antigen (SSEA), which would be
an excellent probe for development, some investigators have treated
embryos with antisera raised against teratocarcinoma cell lines.
b. Teratoma antigens Teratomas contain a wide variety of
cell types corresponding to derivatives of the three embryonic germ
layers. When transplantable, they are called teratocarcinomas and
contain, in addition, embryonic-like cells called embryonal carcinoma
that make them ideal for comparative studies with embryos : 1. They
have many characteristics in common with early embryonic cells and
can differentiate into derivatives of the three germ layers (Jacob,
1979); and 2. they are easily cultured in vitro. Cells derived from
teratocarcinomas can also be obtained from solid tumors and embryoid
bodies present in ascites. By their shape, these bodies recall
pre-implantation stages of mouse embryos (Jacob, 1979).
 number of teratocarcinoma cell lines have been established in
culture in various laboratories, which have used them as antigens for
the study of the embryonic surface. Edidin and Goodin (1975) developed
a rabbit antiserum against embryoid bodies of a multipotential ascites
subline (402x). The serum was reported to be cytotoxic for
pronase-treated unfertilized eggs and to localize on the ICM of the mouse blasto
cyst. The authors suggested that the antigens detected could be pre
cursors of H-2 antigens.
One important characteristic of embryonal carcinoma cells is that
they apparently do not express H-2 antigens. These cells do not
react with specific allogenic anti-H-2 sera (Artzt and Jacob, 1974).
EC cell line F9, if injected in 129 strain male mice, produces
cytotoxic antibody (Artzt et al., 1973). This syngeneic antiserum de
tects what is widely called the F9 antigen (Gachelin et al., 1977; Jacob,
1977, 1978). F9 antigen is present on spermatozoa (Artzt et al.,
1974) but not on any of the somatic cells tested (Jacob, 1979). In the
embryo, the F9 antigen can be detected a few hours after fertilization,
and it is present up to the blastocyst stage in both trophéetoderm
of syngeneic anti-F9 serum inhibits compactation (Kemler et al., 1977).
It is claimed that the F9 antigen may be related to the T/t ccanplex
(Artzt et al., 1974). Two lines of evidence support this hypothesis:
1. Absorption experiments with sperm indicate that sperm
from heterozygotes for one particular "t" haplotype contain half the
amount of F9 antigen than spermatozoa of the wild type (Artzt et al.,
1974).
2. The segregation of F9 antigen in different crosses suggests
that its expression is controlled by a gene closely linked or within
the T/t complex (Kemler et al., 1977). Due to the proven involvement
of the T/t complex in embryogenesis (Artzt and Bennett, 1975), the
mentioned data support the idea that F9 is the closest to a SSEA.
Other teratocarcinoma cell lines have been used to produce specific
antiserum. For example, syngeneic antisera were produced against
embryoid bodies of the ascites form of 0TT6050 teratoma (Dewey et al.,
1977). This antiserum detected cell surface antigens on mouse embryos
from the "2 cell" stage to blastocyst. Also, syngeneic antibodies have
been produced to cell line PCC4. These antibodies reacted with adult
sperm but not with preimplantation embryos (Gachelin et al., 1977).
c. H-2 antigens and the embryo surface The last set of sur
face antigens that will be reviewed are the major histocompatibility
antigens (MHC). They are especially important gince they are directly
related to our study. The MHC (H-2) of the mouse is located in the
middle portion of chromosome 17 and is between 0.3 and 1.5 centimorgans
long (Klein, 1979). Traditionally, the H-2 complex is viewed as a
control a variety of traits of immunological significance (Shreffler
and David, 1975). Each locus in this chromosomal segment is considered
part of the MHC. The complex is divided into four main regions, K, 1,
S and D, and the I region is further divided into five subregions,
I-A, I-B, I-J, I-E and I-C (Klein, 1979). The G region has been re
cently placed between the S and D regions (Klein, 1979). The K and D
regions, which are located on opposite ends of the H-2 complex (K
closest to the centromere), code for antigens capable of stimulating
alloantibody production and graft rejections (Vitteta and Capra,
1978). They are serologically complex antigenically and extremely
polymorphic (Klein, 1979). These antigens are considered Class I
antigens (Klein et al., 1978). The Class II antigens are the I-A
antigens which are coded by the I region of the H-2 complex (Shreffler
and David, 1975). The I-A gene products were originally detected sero
logically with antibodies. They were later shown to be responsible
for the activation of lymphocytes in mixed lymphocyte cultures (Klein,
1979). Another set of Class II antigens are the Ir gene-controlled
products, which regulate the immune response as measured by antibody
production (Shreffler and David, 1975), delayed type hypersensitivity
or proliferation of thymus derived (T) lymphocytes in vitro (Benacerraf
and Germain, 1978). The relation between la and Ir genes is still
confusing. Both sets of genes map in the same position and all attempts
to find Ir gene products different from la molecules have been unsuc
cessful. Therefore, it is now generally accepted that the Ir gene
Class III antigens are coded by the S and G regions. These antigens
are ser^nn proteins and erythrocyte surface antigens. One of the most
difficult things to understand is the extensive polymorphism of the
H-2 complex. Some 60 or more traits have been claimed to be controlled
by the complex (Klein, 1978). The question raised is whether there is
one locus for each of the 60 traits or whether single loci control
groups of traits in a pleiotropic fashion.
Recently, a simplified view of the H-2 complex has been put for
ward (Klein et al., 1981). In this model, the H-2 complex is divided
into only two classes of loci. Class II loci are composed of A^, A^,
E and Eg molecules, and the class I loci are the K and D molecules.
a P
Class III molecules are not considered to be a functional part of the
complex. Klein et al. (1981) have also disposed of the region-subregion
terminology and retain only the term locus. They also eliminate the
I-B and I-C subregions. According to this model, only a small number
of protein products are responsible for the large number of traits
which map to the complex.
Regardless of the correct model for the H-2 complex, the localiza
tion of H-2 antigens on mouse embryos has proven difficult. H-2
antigens have been detected on sperm and unfertilized ova (Edidin, 1972;
Johnson and Edidin, 1972). Heyner and Hunziker (1979) found evidence
of H-2 antigens in oocytes and "1 cell" zygotes but not in "2
cell" stage embryos. Their failure to detect H-2 antigens in cleavage
embryos joins a long series of unsuccessful studies trying to find
H-2 antigens on early embryos (Billington et al., 1977; Heyner, 1973;
is good evidence that H-2 antigens are present in 7-9 day mouse embryos
(Pathy and Edidin, 1973); it is in the earlier stages that they have
been difficult to find. Searle et al. (1976), using an electron
microscope immunoperoxidase technique, demonstrated the presence of H-2
antigens on trophectoderm of blastocysts. Also, Webb et al. (1977)
showed the presence of H-2 products on ICM cells. Finally, in studies
from our laboratories, using a highly sensitive cytotoxicity assay
(Cozad and Warner, 1981), it has been shown that H-2 antigens are present
on blastocysts. Krco and Goldberg (1977) showed the presence of H-2
antigens in "8 cell" stage embryos. This has recently been confirmed
in our laboratory^. Based on all these studies, it can be safely con
cluded that H-2 antigens are expressed in most stages of preimplantation.
The failure to prove their presence at earlier stages ("2 cell"-"4 cell")
probably represents a lack of sensitivity of the techniques used.
4. The timinp; of cleavage in early embryos
The last approach taken to the study of development and the one
that this work addresses is the study of timing events in preimplanta
tion. Timing in development has been the subject of just a few studies
in the past (Soil, 1979). Most of the studies are based on the observa
tion that in mammalian embryos, cell division is almost immediately
asynchronous after fertilization. Thus, in the mouse at a certain time
after fertilization, some embryos will contain fewer cells than others
(Rafferty, 1970). This observation has been confirmed in rats, where
embryos have also been shown to be asynchronous in their cell division
(Giavini and Prati, 1978). Also, Streffer et al- (1980) showed that
synchronization in the mouse (strain not specified) is lost early in
development (48 hours) and is more marked ig vivo than vitro.
Some years ago. Gates et al. (1961) and Whitten and Dagg (1962)
observed differences in the development of inbred mouse strains. Ac
cording to their observations, blastocysts of BALB/c mice had, on the
average, fewer cells per embryo than embryos from strain 129. Several
years later, Titenko (1977) observed that CBA embryos have fewer cells
at a given time than either BALB/c or C57BL/6 embryos. McLaren and
Bowman (1973) showed that C3H embryos have fewer cells per embryo, at
a given time, than the inbred strains C57BL, J and RIII. Based on
their observations, they suggested that genetic factors influence
the timing of early development. In other studies, Niwa et al. (1980)
showed that there are distinct differences between strains of mice in
the time of first cleavage. They showed that in spite of being
fertilized at similar times, the C3H mice showed a lower percentage
of "2 cell" embryos than the other three strains 20 hours after
insemination. From the above studies, it is observed that both CBA and
C3H are "slow" developing strains; both strains have the same H-2
Icn Ic
haplotype (H-2 )• Thus, it is reasonable to hypothesize that the H-2
haplotype is associated with slow development. Genes linked to the MHC
of the rat have been shown to affect development (Kanz et al., 1980).
The growth and reproduction complex (GRC) of the rat, which is a group
of genes closely linked to the MHC (Gill and Kunz, 1979), influences
body size and fertility. Also, Melnick et al. (1981) have shown that
and fetal weight.
In a preliminary study done in our laboratory, Verbanac and Warner
(1981) showed that the H-2 complex may play a role in early embryonic
development. Slow development is associated with the H-2 haplotype.
The gene(s) associated with the H-2 complex are named Fed standing for
preimplantation embryo development. In this dissertation, experiments
will be described to analyze Fed gene expression. These studies will
include the analysis of the range of Ped gene alleles, the description
of the earliest time in development at which the Ped gene is expressed,
studies on F^, and backcross embryos, and a search for the putative
Fed gene product, the H-2 antigens, on the preimplantation mouse embryo
cell surface.
B. Monoclonal Antibodies
1. Plasmacytomas
Plasmacytomas or multiple myelomas are malignant neoplasms of plasma
cells usually arising in bone marrow and are manifested by the
presence of large amounts of circulating homogeneous immunoglobulins
(Potter, 1972). Every plasmacytoma cell of independent origin
is restricted to producing a single species of immunoglobulin, i.e.,
immunoglobulins of identical specificity (Potter, 1972). In 1962,
Potter and Boyce were experimentally able to produce plasmacytomas
in BALB/c mice by using mineral oil. The large amount of immuno
globulin produced by this tumor was an unlimited source of homo
of these molecules (Potter and Lieberman, 1967). Plasmacytomas differ
from lymphomas in cell morphology and in that lymphomas fail to cause
paraproteinemia (anomalous amounts of circulating immunoglobulins) in the
host animal (Horibata and Harris, 1970). Not only have plasmacytomas
been useful in the study of immunoglobulins, but they have also pro
vided an excellent somatic-cell genetic system (Margulies et al.,
1977).
Although Horibata and Harris (1970) were able to grow plasmacytomas
in vitro, it was disappointing to find out that they were not a good
source of antibodies specific to known antigens. Thus, of thousands
of mouse myeloma tumors induced, only a few produce immunoglobulins
that react with known antigens (Potter, 1978). Trying to overcome these
difficulties, investigators have transformed heterogeneous populations
of sensitized lymphocytes with the use of viruses. In 1971, Baumal
et al. transformed human sensitized peripheral blood cells with
Epstein-Barr (EB) virus. However, none of the cell lines produced antibody
directed to the stimulating agent. One of the few limited successes
was achieved by Strosberg et al. (1974). Using SV40 virus, they trans
formed rabbit lymphocytes that produced antibody to pneumococcal type
III polysaccharides.
After plasmacytomas were grown iji vitro. Cotton and Milstein (1973)
produced hybrids between mouse and rat myeloma cells. They observed
that the hybrids continued to produce mouse heavy and light chains.
In 1974, Schwaber and Cohen fused human peripheral blood lymphocytes
with mouse myeloma cells. Gel electrophoresis analysis showed that
mouse. On the other hand, in England, Kohler and Milstein (1975)
decided to fuse a normal plasma cell with a plasmocytoma cell line
called P3-X63Ag.8. This cell line was isolated from the original P3
cell line isolated by Horibata and Harris in 1970. The cells are re
sistant to 8-azaguanine and do not grow in selective medium (e.g.,
HAT medium). The normal cells used for the fusion were obtained from
the spleen of a BALB/c mouse previously immunized with sheep red blood
cells (sRBC). They discovered that the hybrids were producing both
the myeloma protein and the anti-sRBC antibody. In this way, the normal
B-cell became immortal through hybridization with a neoplastic cell.
The fused cell was called a hybridoma. Several cell lines have been
isolated that can be used for the production of hybridomas. Table 1
is a summary of characteristics of cell lines used by most of the in
vestigators in this field.
When a clone of fused cells has been established, by definition,
all of the antibody it secretes is genetically derived from a single
cell (Milstein, 1981). It was clear from the beginning that the
presence of hybrids was higher than expected from simply a random fusion
of normal cells with tumor cells (Milstein, 1981). Apparently, with
immortalization, there is enrichment of T or B cells which have been
stimulated by antigen and have undergone blastogenesis. Thus, actively
dividing cells are enriched by antigen stimulation and will preferentially
fuse with the tumor cells (Melchers et al., 1978). One of the problems
encountered with hybridomas is their lack of stability due to chromo
somal loss (Milstein, 1981). Hybridomas can lose malignancy or immuno
Table 1. Summary of cell lines used for hybridoma production (Melchers et al., 1978)
Cell line
complete name Short name Strain Characteristics
P3X63Ag-8 X63 BALB/c Plasmacytoma (y, k)
P3-NSl-l-Ag4-l NS-1 BALB/c Plasmacytoma (k, nonsec)
MPC11-X45-GTG X45 BALB/c Plasmacytoma (y^b, k)
Sp2/0-Ag/4 Sp2 BALB/c Hybridoma (nonsec)
X63-Ag8.653 — BALB/c Plasmacytoma (nonsec)
BW5147 BW AKR Thymic lymphosarcomas^
EL-4 EL-4 C57BL Thymic lymphosarcomas
^Thymic lymphosarcomas or thymomas are malignant tumors derived from the lymphoid elements of the thymus.
chains are usually lost first and then one of the light chains is
lost (Kohler, 1980).
2. Interspecies and intraspecies hybridomas
Several kinds of interspecies hybridomas have been produced. One
example is rat-mouse hybridomas (Galfre et al., 1977; McKearn et al.,
1980), Using this type of hybridoma, McKearn et al. (1980) produced mono
clonal antibodies against the MH.C of the rat. from these and other studies
(Welb et al., 1979), it has been shown that rat-mouse hybridomas are
more stable than mouse-mouse hybridomas. Also, rat-mouse hybridomas
are useful because both cells carry different karyotypes and studies
on gene regulation are facilitated. Furthermore, over 90% of the
[image:34.560.58.473.86.356.2]which have a different allotype from the mouse (BALB/c) light chains
providing an excellent marker for regulation studies. However, produc
tion of mouse-mouse hybridomas has been reported by dozens of labora
tories and apparently have the widest application (see below).
Another potentially important type of interspecies fusion is the
rabbit-mouse hybridoma. In 1980, Yarmush was successful in producing
mouse-rabbit hybridomas. These could be an important source of specific
antibodies against pathogenic microorganisms like paT1idinn (causal
agent of syphilis), since the rabbit is the only good experimental
model for syphilis (Bishop and Miller, 1976). The last of the important
interspecies hybridomas are the mouse-human hybridomas. A good example
of their application is the study published by Schwaber and Rosen (1978).
B lymphocytes from an agammaglobulinemic patient were fused with mouse
myeloma cells. These hybridomas produced both murine and human immuno
globulins. This demonstrates the presence of structural genes coding
for immunoglobulins in the cells of this patient.
An important type of hybridoma is the human-human hybridoma (Olssen
and Kaplan, 1980). They developed an 8-azaguanine resistant human myeloma
and fused it with lymphocytes of patients with Hodgkin's disease that were
previously sensitized with 2,4 dinitrochlorobenzene. They obtained cul
tures producing specific human antibody to the chemical antigen. The
potential of these human-human hybridomas in therapy and clinical diagnosis
3. T cell hybridomas
If the same population of spleen cells which contains similar
numbers of B and T cells is fused with a myeloma or a T cell
lymphosarcoma, the results are quite different (Milstein, 1981). When
the fusion parent is the myeloma, the growing hybrids express the
antibody-secreting phenotype of the parental spleen cell but do not seem
to express the markers characteristic of T cells. On the other hand,
when the fusion parent is a T cell lymphosarcona, the growing hybrids
preferentially express the T cell characteristics. Thus, thymic
lymphosarcomas were developed to produce T cell hybridomas.
T cell hybridomas have been used to study suppressor cells and sup
pressor factors. Supernatant fluids of T cell hybridomas can suppress
expression of delayed type hypersensitivity (DTH) (Hewitt and Liene,
1979) to sRBC stimulation. T cell hybridomas developed by Taussig et al.
(1979) produced suppressor factors that reduced primary and secondary
responses to sRBC. Accessory cells (e.g., macrophages) have been fused
with multiple myeloma cells (Sethi et al., 1981). Two continuously
multiplying hybrid cell lines were established which showed
macrophage-like activity and retained the macrophage-derived Fc receptor activity.
These are useful studies of the role of macrophages in malignancy.
4. Applications of monoclonal antibodies
There are potentially limitless applications for monoclonal anti
bodies. The following are just a few examples of these.
Hybridomas have been used to study autoimmune diseases (Andrzejewsky
anti-DNA monoclonal antibodies were produced using mice showing Lupus-like auto
immune disease. These studies could be useful for a better understanding
of autoimmunity. Monoclonal antibodies have great potential as therapeutic
agents. They can be effective against transplanted mouse leukemia (Bern
stein et al., 1980) or even against parasitic diseases like malaria
(Yoshida et al., 1980). Hybridomas can be powerful tools in purification
processes. Using immunoabsorbent columns, Secher and Burke (1980) purified
interferon 5000-fold in only one step without any loss of activity.
The three areas in which monoclonal antibodies have already
found wider clinical application are oncology, hematology and im
munology. Specific monoclonal antibodies have been raised against
several carcinoembryonic cell lines (Acolla et al., 1980) and also
against neuroblastomas (Kennet and Gilbert, 1979). These antibodies
were very specific and showed no cross reactivity with normal cells or
other tumors. Monoclonals have been produced to T cell subpopulations
and can be used to mark or separate T cell subpopulations (Welb et al.,
1979; Ziegler, 1980). Monoclonals have also been produced against
human group A erythrocytes (Barnstable et al., 1978) with the goal of
replacing conventional antisera, vAiich is expensive to produce.
Monoclonals have also been raised to HLA antigens (Barnstable et al.,
1978) and (Ziegler, 1980). In the case of mice,
monoclonals have been produced to H-2 and la antigens (Lemke et al.,
1978; Ozato, 1980). The antigenic specificities detected by these
hybridomas were similar to those listed in H-2 charts, such as
those of Danant (1979). This last class of monoclonals are of
decided to use this approach to show the presence of H-2 antigens on
embryos. This is important because our working hypothesis is that the
II. MATERIALS AND lŒTHODS
A. Mice
The following inbred and congenic mouse strains were obtained
from the Jackson Laboratory, Bar Harbor, ME: C57BL/10Sn, C57BR/cdj,
CBA, C3H/HeJ, BALB/c, A/J, SJL, DBA/1, DBA/2, C57BL/6, BIO.BR,
B10.D2, BIO.A, BIO.PL, and BIO.RIII. (The last two were purchased
as mating pairs.)
The BIO.S, BIO.Q and C3H.B10 mice were obtained from Dr. D.
Shreffler, Washington University, St. Louis, MO; the BALB.K mice
from B. Mishel, University of California, Berkeley, CA; and the BALB.B
mice from Dr. R. Scibienski, University of California, Davis, CA.
mice were bred in our laboratory. The CFl (outbred)
mice were obtained from Charles River Breeding Laboratories, Wilmington,
MA. The mice were housed in a day night cycled room with controlled
temperature and food and water ^ libitum. The clock was never al
tered during the year so that the room was light either from 6
a.m.-8 p.m. standard time or from 7 a.m.-9 p.m. daylight savings time.
B. Collection of Embryos
Female mice 2-6 months old were super ovulated by injection with
5 I.U. pregnant mare serum (PMS) (Organon Holland) followed 48 hours
later by 10 I.U. human chorionic gonadotropin (hCG) (ICN, Nutritional
Biochemicals, Cleveland, OH). All injections were either at 3 p.m.
standard time or at 4 p.m. daylight savings time. Females were
jection, and checked for the presence of a vaginal plug the next
morning.
Plug positive females were sacrificed by cervical dislocation
at various hours after hCG injection, depending on the desired
developmental stage of the embryos.
Embryos were collected at 24, 27, 30, 33, 36, 40, 47, 53, 56,
and 65 hours post hCG from excised oviducts by flushing them with
modified Iilhitten and Biggers (1968) culture medium using a blunt
30 gauge needle. Embryos at 89 hours post hCG were collected by
flushing the uterus.
Embryos were collected in embryological watchglasses. The re
covery and examination of embryos were performed under dissecting
microscope (Bausch and Lomb, Rochester, NY). As soon as the embryos
were collected, they were washed three times in Whitten and Biggers
medium and placed in an atmosphere of 5% CO^ in air to maintain optimal
pH.
C. Determination of Cell Number
During the first stages of development ("1 cell" to "5 cell"
embryos), cell number was determined by direct microscopic inspection.
For the later stages, a modified version of the Tarkowski (1966)
procedure was used. In this method, individual embryos were washed
free of culture medium and placed in 0.8% sodium citrate for 5-15
minutes at room temperature. Next, the embryos were transferred to
parts absolute ethanol:one part glacial acetic acid) were added.
Usually, at least seven drops of fixative were required. Final
scattering of nuclei was achieved by blowing on the embryos during
air drying.
The preparations were stored in Giemsa (GIBCO, Grand Island,
NY) overnight and washed gently with distilled water. The nuclei
were counted using a Zeiss phase contrast microscope (equipped with an
integral illuminator) at 400x magnifications (Zeiss, New York, NY).
D. Determination of Superovulation Time
Female mice were injected with hormones as previously described
but they were not mated. The ampullary portion of the oviduct was
teased with fine forceps and the clutch of recently ovulated eggs was
removed. The oviducts were then flushed with a solution containing
300 units/ml hyaluronidase (1500 units/mg, Sigma, St. Louis, MO) in
Whitten and Biggers medium to remove cumulus cells.
E. Production of Monoclonal Antibodies
1. Cells
The NS-1 cells were obtained from Dr. Nancy Ruddle, Yale University,
New Haven, CT. The Sp-2/0 cells were a gift from Dr. J. Davie, Washington
University, St. Louis, MO. The 11-4.1 hybridomas were obtained from
the Salk Institute, LaJolla, CA.
sterile medium which consisted of low glucose (1000 mg/ml) Dulbecco's
Modified Eagles Medium (D-MEM) (GIBCO, Grand Island, NY) supplemented
with 10% fetal bovine serum (heat inactivated) (GIBCO) (or 10%
gamma globulin free newborn bovine serum), 1% of antibotic/antimycotic
solution (GIBCO) (Penicillin 10,000 units/ml, streptomycin 10,000
ug/ml and fungizone 25 jAg/ml) and 0.5% garamycin (10 mg/ml, Schering
Corporation, Kenilworth, NJ).
2
Cells were grown in 25 cm tissue culture flasks (Corning,
Fisher Scientific, St. Louis, MO) in humidified incubators in an
atmosphere of 5% CC^, 95% air and a temperature of 37°C.
The Sp-2/0 cells and Sp-2/0 hybridomas were grown in high glucose
(4500 mg/ml) D-MEM (GIBCO) with 10% gamma globulin free horse serum
(GIBCO), 5% calf serum (GIBCO) and the same concentration of anti
biotics as already described.
Cells were transferred twice a week by placing from 1 to 1.5 x
5 2
10 cells/ml into 10 ml of fresh medium in 25 cm tissue culture flasks
which were laid horizontally in the incubator with the caps loose.
Viability counts were done routinely. The NS-1 cells were treated
every 3-4 months with 8-azaguanine (Sigma) (2 lig/ml) to eliminate the
presence of mutants and maintain susceptibility to aminopterin.
The Sp-2/0 cells were treated at 3- to 4-week intervals.
A stock solution of 8-azaguanine was prepared by dissolving
10 mg of the drug in 10 ml of Hanks balanced salt solution. The drug
was dissolved by increasing the pH to 10 using a IM NaOH solution.
Next, the solution was neutralized to the original pH using a IM
1 ml aliquots. Before treating the cells, 1 ml of the stock
solution was added to 500 ml of complete medium.
2. Cell freezing and storage
Freezing medium consisted of complete medium, plus an extra
10% of serum (making a final concentration of 20% serum) and 10%
dimethyl sulphoxide (Fischer). Medium for freezing was prepared
fresh every week.
Cells were centrifuged at room temperature at 200 x g for
10 minutes and resuspended in freezing medium at a concentration of
2-5 X 10^ cells/ml. Cells were aliquoted into one ml quantities in
special polyestarane vials (Provials, Cooke, Alexandria, VA or
Inter-Med vials. Nunc, Denmark).
At the beginning of this project, the freezing of the cells was
conducted with a Linde 4-2 Biological Freezing System (Union Carbide,
NY) composed of a BF-6 controller, BA-2 freezing chamber, liquid
nitrogen tank (22 psig) and a Bristol Dynamaster Recorder, Model
PH560-51 (Waterbury, CT), with an adjusted chart speed of one inch per
minute. The recorder was calibrated by placing the thermocouple
probe into beakers containing distilled water at 25°C, 10°C, and 5°C,
respectively. The cooling rate (degrees per minute) was calculated
by dividing the temperature change by the chart speed. The control
vial was connected to the thermocouple and inserted into the chamber.
The controller was adjusted to a freezing rate of 1°C per minute.
When the samples were approximately 4°C above freezing point (-IS^C),
for 30 seconds eliminating random freezing of samples. The freezing
was continued to -30°C and then changed to 10°C per minute to -70°C.
Vials were then transferred to the liquid nitrogen container (LR-30,
Union Carbide, NY).
Later on in this project, a more economical, but equally effective,
way to freeze cells was used. The apparatus used was a BF-5
biological freezer (Union Carbide) which cools the cells using the
cold gas evolved from the liquid nitrogen container. The freezer
was adjusted to a freezing rate of l-2°C/minute and left for 45
minutes to an hour in the tank, after which the vials were deposited
in the storing tank.
Cells were stored in a LR-30 liquid nitrogen container (Union
Carbide) for years without losing more than 30% viability. Recovery
of cells from the liquid nitrogen was achieved by quickly thawing
the samples and diluting them slowly into 10 ml of fresh medium in
a tissue culture flask. The flask was placed in the incubator over
night. After 48 hours, a viability count was done and cells were
transferred as usual.
3. Immunization of mice
All immunizations were done using only congenic mice. In this
way, antibodies were directed exclusively to the H-2 coded antigens.
For the production of anti-H-2^ antibodies, C57BL/10Sn mice were
injected with BIO.BR splenocytes. Reciprocal injections were done
to produce anti-H-2^ antibodies.
facilitate the production of tumors since BALB/c mice were the original
sources of NS-1 cells.
For the production of anti-H-2^ antibodies, BALB/c mice were in
jected with BALB.K splenocytes and for the production of anti-H-2^
antibodies, BALB/c mice were injected with BALB.B cells.
Immunization against whole spleen cells was done according to the
method of Batchelor (1973). Single cell suspensions of the appropriate
strains were prepared by washing spleens with 1 ml of RPML 1640 medium
(GIBCO) followed by pressing through a 50 mesh stainless steel screen.
Each recipient mouse received 0.2 ml of the spleen cell suspension.
This suspension usually consisted of two donor spleens per eight
recipient mice. Females were always used as donors and recipients.
In this way, production of anti-HY antibody was avoided. Weekly in
jections (usually at least 8) were given until good titers were pro
duced. The recipient mice were always boosted 72 hours before the
fusion.
4. Fusion protocol
The protocol used to produce hybridomas is a modification of the
procedure described by Gefter et al.(1977). All the procedure was
performed under strict sterile conditions. All glassware and instru
ments were carefully sterilized (autoclaved). Three days before the
fusion, NS-1 (or Sp-2/0) cells were transferred to fresh medium (usually
4 to 6 flasks were enough for one fusion).
This step is particularly important because fusions are more
mentioned earlier, mice were boosted the same day that the cells were
transferred.
The day of the fusion, one of the boosted mice was sacrificed and
the spleen removed asceptically. The spleen was rinsed with serum free
D-MEM. While holding the spleen with the forceps, 2 ml of medium was
pushed through the spleen using a one ml tuberculine syringe. The
cells were collected in a 60 x 10 mm sterile plastic petri dish. The
spleen was then pressed through the sterile 50 mesh with the aid of
forceps. The cell suspension was transferred into a sterile tube.
Using a sterile red cell pipette (Fischer) and white blood cell
diluting fluid (0.5% acetic acid, 0.1% [v/w] crystal violet), a 1:100
dilution of the splenocyte suspension was made. The diluting fluid
lyses erythrocytes and stains lymphocytes violet. Cells were counted
with the aid of a hematocytometer. The NS-1 cells were washed and
re-suspended in serum-free D-MEM. The NS-1 cells were mixed in a one to
five proportion with the splenocytes. Red blood cells were not re
moved, but were discounted from the splenocyte cell count. The final
concentration of cells was always between 4 and 5 x 10^ cells.
A typical fusion would use 8 x 10^ NS-1 and 4 x 10^ splenocytes.
The mixed cell population was centrifuged for 8 minutes at 200 x g at
room temperature in 50 ml clear plastic, conical disposable tubes
(Corning).
Meanwhile, a 45% solution of PEG (polyethylen glycol 1540, Baker,
Phillipsburg, NJ) was prepared by mixing 2.25 g of PEG with 2.75 ml
of PBS, This PEG solution was prepared fresh for every fusion, melted