Final Report
FA8650-09-D-1639
Task Order 0001
Advanced Cloud Computing Technology for
Sensor Grids
REPORT DOCUMENTATION PAGE
Form Approved OMB No. 0704-0188
Public reporting burden for this collection of information is estimated to average 1 hour per response, including the time for reviewing instructions, searching existing data sources, gathering and maintaining the data needed, and completing and reviewing this collection of information. Send comments regarding this burden estimate or any other aspect of this collection of information, including suggestions for reducing this burden to Department of Defense, Washington Headquarters Services, Directorate for Information Operations and Reports (0704-0188), 1215 Jefferson Davis Highway, Suite 1204, Arlington, VA 22202-4302. Respondents should be aware that notwithstanding any other provision of law, no person shall be subject to any penalty for failing to comply with a collection of information if it does not display a currently valid OMB control number. PLEASE DO NOT RETURN YOUR FORM TO THE ABOVE ADDRESS.
1. REPORT DATE (DD-MM-YYYY) 2. REPORT TYPE
Final Report (Draft)
3. DATES COVERED (From - To) 5/20/09 – 11/30/10
4. TITLE AND SUBTITLE 5a. CONTRACT NUMBER
FA8650-09-D-1639 Advanced Cloud Computing Technology for Sensor Grids 5b. GRANT NUMBER
5c. PROGRAM ELEMENT NUMBER
6. AUTHOR(S) 5d. PROJECT NUMBER
Alex Ho, Marlon Pierce 5e. TASK NUMBER
0001
5f. WORK UNIT NUMBER
7. PERFORMING ORGANIZATION NAME(S) AND ADDRESS(ES) Anabas, Inc.
8. PERFORMING ORGANIZATION REPORT NUMBER
580 California Street Suite 1600
San Francisco CA 94104
9. SPONSORING / MONITORING AGENCY NAME(S) AND ADDRESS(ES) 10. SPONSOR/MONITOR’S ACRONYM(S) AFRL
11. SPONSOR/MONITOR’S REPORT NUMBER(S)
12. DISTRIBUTION / AVAILABILITY STATEMENT
13. SUPPLEMENTARY NOTES
14. ABSTRACT
Cloud computing is an important trend complementary to Grids. Although not suitable for closely coupled, petascale applications, Clouds are much better suited serving smaller users, users with on-demand requirements, users with loosely coupled, data-parallel problems, and users needing to store and access data collections. The latter will benefit from the utility computing focus of clouds. DoD command and control applications typically can benefit from cloud architectures as they tend to be many small on demand computations and not large petascale simulations. This project focuses on evaluating the coupling of Clouds and trustworthiness modeling, vunerabilities and defenses, including cloud computing technology for sensor grids, detection of anomalous use of sensors, using contextual data to authenticate and deauthenticate sensors in mobile devices, side-channel leaks in software-as-a-service, and understanding malware on mobile devices with sensors.
15. SUBJECT TERMS
Cloud cyberinfrastructure, Sensor Grid, Trustworthiness, Side-channel leak, Contextual risk, Sensory malware
16. SECURITY CLASSIFICATION OF: 17. LIMITATION OF ABSTRACT
18. NUMBER OF PAGES
19a. NAME OF RESPONSIBLE PERSON Alex Ho
List of Figures
Figure 2-1 Processing pipeline for NASA UAVSAR synthetic aperture radar data. Levels
indicated in the figure are NASA CODMAC levels. ... 17
Figure 2-2 Flood Grid Servic Stack and Workflow. Each component (gray box) is a network accessible service with well-defined inputs and outputs expressed using the Web Service Description Lanaguage. ... 20
Figure 2-3 FloodGrid user interface layout and screenshot (courtesy of Neil Devadasan, IUPUI Polis Center). ... 21
Figure 2-4 Virtualization is used to elastically increase the FloodGrid simulation service to handle greater demand during flood events. ... 23
Figure 3-1 Ambiguity set reduction ... 34
Figure 3-2 Goolge Health User Interface for adding health records ... 36
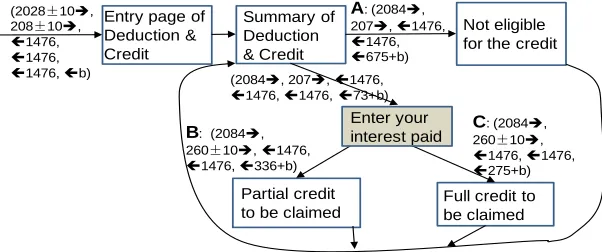
Figure 3-3 State transitions for child credit eligibilities ... 36
Figure 3-4 Asymmetric paths in student loan interest deduction ... 37
Figure 3-5 Some disclosed AGI ranges ... 37
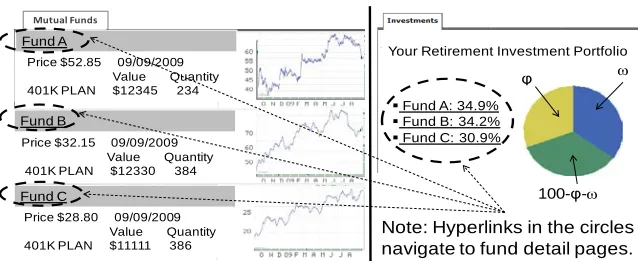
Figure 3-6 Mutual Fund List (left) and Allocation (right) ... 38
Figure 3-7 Soundminer architecture with collection and communication parts connected to overt channel to a second application which can access the Internet. ... 42
Figure 3-8 Soundminer audio collection module. ... 42
Figure 3-9 IVR data paths to sensitive information. ... 43
Figure 4-1 Convert to common location string for HMM learning. ... 48
Figure 4-2 Tradeoff learning accuracy versus runtime costs. ... 49
Figure 4-3 Example ROC curve for theft detection based on geographical data for user from Reality Mining Dataset. ... 51
Figure 5-1 High-level sensor data exchange using SCGMMS. ... 56
Figure 5-2 Sensor Grid application major hardware components. ... 57
Figure 5-3 HTC Legend Android phone and blob tracking display. ... 58
Figure 5-4 Representative laser range finder display. ... 60
List of Tables
Table 2-1 Example size increases for selected geosopatial applications. ... 16Table 2-2 Mapping FloodGrid infrastructure requirements to Cloud Computing. ... 22
Table 2-3 Testing dataset and filters ... 26
2 SCIENTIFIC CLOUD COMPUTING AND SENSOR GRIDS ... 11
2.1 INTRODUCTION:SCIENTIFIC CLOUD COMPUTING IN CONTEXT ... 11
2.2 CLOUD PROGRAMMING PARADIGMS FOR DATA-DRIVEN APPLICATIONS ... 12
2.2.1 Cloud Computing and Infrastructure ... 13
2.2.2 Research Areas for Scientific Computing with MapReduce and Clouds ... 15
2.3 CLOUD COMPUTING FOR SENSOR GRIDS ... 16
2.3.1 Cloud Computing and Sensor Data Sustainability... 16
2.3.2 Cloud Computing and Grid Computing ... 17
2.4 INFRASTRUCTURE AS A SERVICE ... 18
2.4.1 Infrastructure as a Service Case Study: FloodGrid ... 19
2.5 SOFTWARE AS A SERVICE ... 23
2.5.1 Software as a Service Case Study: SAR Image Post-Processing ... 26
3 VULNERABILITY AND MITIGATION TECHNIQUES FOR CLOUD COMPUTING WITH SENSOR GRID ... 29
3.1 INTRODUCTION:SECURITY,PRIVACY AND TRUSTWORTHINESS ISSUES ... 29
3.2 SIDE-CHANNEL LEAKS IN SOFTWARE AS A SERVICE:THREATS AND DEFENSE ... 31
3.2.1 A Simple Model for Analyzing Side-channel Leaks in Web and Cloud Applications ... 32
3.2.1.1 Model Abstraction ... 33
3.2.1.2 Threat Analysis over Web and Cloud Application Properties ... 34
3.2.1.3 Low Entropy Input for Interactiveness ... 34
3.2.1.4 Stateful Communications ... 34
3.2.1.5 Significant Traffic Distinctions ... 35
3.2.2 Information Leaks Discovered in Real-World Web Applications ... 35
3.2.2.1 Google Health ... 35
3.2.2.2 SmartTax*/TaxLower* ... 36
3.2.2.3 AccuInvest* ... 37
3.2.2.4 Google/Yahoo/Bing Search ... 38
3.2.3 Challenges in Mitigating the Side-channel Leaks ... 38
3.2.4 Automatic Detection and Quantification of Side-channel Leaks in Web and Cloud Application Development ... 39
3.3 SENSORY MALWARE ON MOBILE SENSORS:ATTACKS AND DEFENSES ... 39
3.3.1 Malware Design ... 41
3.3.2 Architecture Overview ... 41
3.3.3 Malware Attacks ... 43
3.3.3.1 Leveraging Third-Party Applications ... 43
3.3.3.2 Covert Channels with Paired Trojans ... 43
3.3.4 Defensive Architecture ... 44
4 DETECTION OF ANOMALOUS USE OF SENSORS ... 46
4.1 PLACES AND FACES:USING CONTEXTUAL DATA TO AUTHENTICATE AND DEAUTHENTICATE SMARTPHONES ... 46
4.2 THREAT MODEL ... 47
4.3 USING SENSOR DATA TO MEASURE CONTEXTUAL RISK ... 47
4.4 GEOLOCATION RISK ... 48
4.4.1 Hidden Markov Model ... 48
4.4.2 Determining Risk ... 50
4.4.3 Simulate Theft to Model Anomalous Use of Smartphone Sensors... 50
4.5 SOCIAL NETWORK RISK ... 51
4.5.1 Hardware and Software Implementation ... 52
4.5.2 Determining Risk ... 52
4.5.3 Performance ... 53
5 A TECHNOLOGY DEMONSTRATIONS OF SENSOR GRID WITH MOBILE SENSORS . 54 5.1 APPLICATION INTRODUCTION ... 54
5.2.1 Sensor Grid Middleware Configuration and Setup ... 56
5.2.2 Sensor Hardware Configuration and Setup ... 56
5.2.3 Software Preparation and Development ... 57
5.2.3.1 Axis Network Camera ... 57
5.2.3.2 HTC Legent Phone ... 58
5.2.3.3 Laser Range Finder and GumStix Processor ... 59
5.3 APPLICATION DEMONSTRATION ... 59
5.3.1 Demonstration Overview ... 59
5.3.2 Demo Performance and Limitations ... 60
5.4 APPLICATION SUMMARY ... 60
6 CONCLUSIONS ... 61
7 RECOMMENDATIONS ... 63
8 REFERENCES ... 65
1 Summary
Problem Statement
Cloud computing is an emerging approach to distributed computing. It is related to many other approaches in this general field, including Message Passing Interface-based parallel computing, Grid computing, and Service Oriented computing. Not surprisingly, the discussion of the various approaches often becomes a confused debate. It is crucial to provide understanding and bring some clarity on the types of computing, in particular, sensor-based problems for which Cloud computing is appropriate and also identify some limits. Cloud computing infrastructure is of particular interest to sensor-based applications in at least three areas: data-parallel processing, real-time stream processing, and on-demand emergency response. There is thus an opportunity for sensor grids to provide important use cases that help clarify the capabilities that a general-purpose, end-to-end cyberinfrastructure deployment should provide.
Sensor technology plays critical roles in supporting war fighters and military personnel as they engage in operations that could be high stress and life threatening. Scenarios and systems in which there are large groupings of sensors reporting huge quantities of potentially sensitive data, and the need to perform large amounts of processing or computation on this data with large cloud computing installations are considered. Further, there are adversaries who have a vested interest in either learning information from the system, modifying the results finally output from the system (be it through modification of the sensor input, filtering or processing of data), or denying access to the system. All aspects of these systems and the environment in which some parts of the system operate are susceptible to attack. It is critical to be able to provide reliable results computed from sensor data, in a manner that enables one to make educated decisions on the reliability of that data based on trustworthiness metrics, while simultaneously preventing the loss of data-secrecy or integrity. The problem of trustworthiness of sensor data in clouds has many pieces, interconnecting with one another. It is necessary to be able to evaluate the coupling of clouds and trustworthiness issues with sensor grids.
Results
preservation of observational and experimental data and their processing pipelines, but this program is in its earliest stages.
Side channel analysis has long been known to be a serious threat to information confidentiality. With a sensor grid system both the communication between the sensors and the grid and that between the grid and clients are subjected to this threat. Our preliminary research shows that the design of web or cloud application, which is built upon the interactions between its client component and server component, makes them vulnerable to traffic analysis. Techniques can be developed to infer the internal states of these applications and the data associated with them by looking at the attributes such as packet size, directions and numbers of the traffic between its two components. In our work we developed a model to analyze side-channel weakness in Web applications. For experimental purposes seven high profile, top-of-the-line Web applications were tested and founded side-channel vulnerabilities in all of them. We evaluated the effectiveness and the overhead of applying common mitigation techniques. Our research shows effective mitigations of side-channel leakage threats have to be application-specific. We proposed the first technique for automatic detection of side-channel leaks in Web applications, and offered novel solutions to the challenges associated with the extensive use of AJAX and GUI widgets. We developed a novel technique for quantifying the side-channel leaks in Web applications. The new technique can measure not only the information disclosed from a single tainted source but also that aggregated from multiple sources. We designed and implemented a preliminary detection and mitigation framework for analyzing Web applications and a platform for Web application developers to specify privacy policies, upon which Web browsers and servers collaborate to enforce such policies.
To understand the threat space of malware on mobile sensors, we explored various attack scenarios on mobile sensors container using an easily obtainable Android smartphone as a sample sensors container. While traditional malware defenses focus on protecting resources on computers we are specifically interested in the new class of attacks where sensory malware uses onboard sensors to steal information from the user’s physical environment. Overt channels between components on an Android phone or covert channels between related malware applications are viable vectors for leaking sensitive data to adversaries. In our research we developed novel techniques to demonstrate that smartphone-based sensor container malware could easily be made to be aware of the context of a voice conversation, which allows it to selectively collect high-value information. We studied various channels on the Android smartphone as a mobile sensors container platform that can be used to bypass existing security controls, and different types of covert channels. We designed and implemented a sensory malware called Soundminer to evaluate our techniques to show a stealthy attack of this type is possible. We identified security measures that could be used to mitigate this threat; and designed and implemented a defensive architecture that prevents any application from recording audio to certain phone numbers specified by privacy policies.
likely that it is reporting an honest or legitimate environmental picture, and not one that has been manipulated with the goal of producing faulty results that get incorporated into final computation. If the sensor is stolen or otherwise not in the possession of its intended owner the environmental picture that the sensor reports may be altered, and thus data collected untrustworthy. For experimental purposes an Android smartphone was used as a mobile device that contains a number of different environmental sensors. Our work uses machine-learning techniques and the sensors of a smartphone to estimate the likelihood that the legitimate user is in possession of mobile sensor container; in this case, the smartphone. Hidden Markov Models is used to learn daily location routines. As behavior becomes learned the model can begin to determine the likihood that the immediate history of the smartphone’s location indicates normal or abnormal behavior, producing a trustworthiness metric. We developed GPS sensor data collector, GPS sensor Hidden Markov Model, GPS risk predictor based on the Hidden Markov Model, and completed GPS risk metric theft model evaluation. We also completed a Bluetooth GPS sensor data collector and Bluetooth GPS entropy-based risk predictor as well as a linear risk aggregator. Data in the Reality Mining Dataset from MIT Reality Mining Labs was used to train the Hidden Markov Models. Our preliminary finding indicates that giving longer time to detect anomalous behavior results in better accuracy. However, the longer time we allow to detection, the greater risk of compromise of the mobile sensors container.
Conclusions
In this report, we have surveyed major concepts in Cloud Computing and have considered the requirements for scientific computing on Clouds. We have specifically considered the application of Clouds to sensors, sensor data, and sensor pipelines. We reviewed Cloud Computing's "Infrastructure as a Service" and "Software as a Service" models. We illustrated these requirements using two small projects developed in a pre-Cloud fashion: the Flood Grid and Polar Grid projects. Our key observation is that Clouds grant more control over the environment to developers through virtualization. This allows, for example, developers to install and control their own software without worrying about version conflicts with developers on unrelated projects. MapReduce, a common programming model for clouds, does provide a powerful way to do some sensor and geospatial computing tasks (particularly image processing), but its current implementations (such as Apache Hadoop) are poor fits for geospatial problems that are not file-based, particularly those closely tied to relational database applications. Extending MapReduce implementations and other “Software as a Service” tools to introduce data base concepts is an active area of research.
Large commercial vendors dominate Clouds, but there is a growing collection of open source software that can be used to build research clouds. A challenge for core Cyberinfrastructure research will be to investigate and document open architecture Cloud systems. Sensor grids can and should provide a wide range of important test cases.
It offers a very easy to implement application development interface for integrating legacy or new third-party applications with a sensor grid to add crucial grid situational awareness capability. It also provides a concise layered sensor service abstraction for easy integration and deployment of new sensors as a grid resource to enhance grid situational awareness.
We reported the significant findings of side-channel leak vulnerability of a broad-based Web and Cloud applications, and audio sensory malware vulnerability of a class of smartphones as mobile sensors container. We proposed mitigation architectures and strategies to address our reported vulnerability findings.
2 Scientific Cloud Computing and Sensor Grids
2.1 Introduction: Scientific Cloud Computing in Context
Cloud computing is an emerging approach to distributed scientific computing. It is related to many other approaches in this general field, including Message Passing Interface-based parallel computing, Grid computing, and Service Oriented computing. Not surprisingly, the discussion of the various approaches often becomes a confused debate. In this report, we will attempt to provide some clarity on the types of scientific computing (particularly sensor-based) problems for which Cloud computing is appropriate and also identify some limits. Specifically, this report summarizes our observations on applying Cloud computing approaches to a range of geospatial problems, with an emphasis on sensor processing pipelines, both in near real time and in batch processing mode. We take our observations from a number of relevant projects, including the QuakeSim project (1,2), the FloodGrid project (described here), and the PolarGrid project (www.polargrid.org). Our lab has developed software to support these distributed spatial applications, building on our general investigations of Cyberinfrastructure architectures (3). Applications include Geospatial Information System (GIS) Grid services based on Open Geospatial Consortium standards (4) and real-time streaming Global Positioning System processing infrastructure (5,6).
We take a broad view of the infrastructure requirements for scientific computing. High performance computing and data storage are just two aspects; we also need to manage real-time data streams, integrate third party capabilities (such as geographic map and data providers), and build interactive user interfaces that act as Science Gateways (7). As we discuss in this report, we believe the next generation of major computing infrastructure deployments (such as the NSF’s TeraGrid (8) and the DOD’s Major Shared Resource Centers) need to provide a broader scope of infrastructure capabilities to their user communities.
services and workflows that are suitable for a broad range of users (researchers, students, and the general public). Ideally, one may build higher-level applications out of a toolbox of third party services backed up by persistent Cyberinfrastructure; we formerly termed this the “Grid of Grids” approach (3).
The problem that we see is that there is no national scale infrastructure to provide the foundation for the comprehensive cyberinfrastructure vision of the well-known Atkins report (14); that is, as we will elaborate, there is no "infrastructure as a service" in today's cyberinfrastructure. The current flagship cyberinfrastructure deployments in the US are dominated by the requirements of closely coupled, high-end, high performance computing. This computing infrastructure is not well suited for many sensor-based applications, which are dominated by data-driven applications, and is also ill suited for emergency response, a major application area for sensor grids. Arguably, emerging programs such as the NSF DataNet may address the data-centric needs of cyberinfrastructure that are crucial to much of sensor grids, such as long-term storage and preservation of observational and experimental data and their processing pipelines, but this NSF program is in its earliest stages.
Cloud Computing-like infrastructure is of particular interest to sensor-based applications in at least three areas: data-parallel processing, real-time stream processing, and on-demand emergency response. There is thus an opportunity for sensor grids to provide important use cases that help clarify the capabilities that a general-purpose, end-to-end cyberinfrastructure deployment should provide. We illustrate these concepts through two examples, PolarGrid (image processing) and Flood Grid (emergency response). As we will show, the infrastructure requirements of these use cases can be met with Cloud computing approaches, including both “Infrastructure as a Service” and “Software as a Service.”
Before examining these examples, we first provide background on Cloud computing and review programming paradigms for scientific cloud computing and contrast with parallel and grid computing models. This will illustrate the proper problem domain for these types of computing problems.
2.2 Cloud Programming Paradigms for Data-Driven Applications
We can ask what the analogous programming paradigms and runtime are for data intensive applications, such as obtained from observational sensor networks and collections. We already know that many of the distributed system ideas will carry over as workflow has typically used dataflow concepts and integrated data and simulations. However as data processing becomes a larger part of the whole problem either in terms of data size or data-mining/processing/analytics, we can anticipate new paradigms becoming important. For example most data analytics involves (full matrix) linear algebra or graph algorithms (and packages like R) and not the particle dynamics and partial differential equation solvers characteristics of much supercomputer use. Furthermore, storage and access to the data naturally involves databases and distributed file systems as an integral part of the problem.
It has also been found that much data processing is less closely coupled than traditional simulations and is often suitable for dataflow runtime and specification by functional languages. However we lack an authoritative analysis of data intensive applications in terms of issues like ease of programming, performance (real-time latency, CPU use), fault tolerance, and ease of implementation on dynamic distributed resources. A lot of progress has been made with the MapReduce framework (discussed in more detail below) that was originally developed for Internet-scale information retrieval. Initial research shows this is a promising approach to much scientific data analysis. Here we see different choices to be explored with different distributed file systems (such as HDFS for Hadoop) supporting MapReduce variants and DryadLINQ offering an elegant database interface. We note current supercomputing environments do not support HDFS but rather wide area file systems like LUSTRE. MapReduce programming models offer better fault tolerance and dynamic flexibility than MPI and so should be used in loose coupling problems in preference to MPI.
2.2.1 Cloud Computing and Infrastructure
Large commercial markets drive Cloud computing development, where IDC estimates that clouds will represent 14% of IT expenditure in 2012, and there is rapidly growing interest from government, academia, and industry. There are several reasons why clouds should be important for large scale scientific computing.
1. Clouds are the largest scale computer centers constructed and so they have the
capacity to be important to large-scale science problems as well as those at small scale.
2. Clouds exploit the economies of this scale and so can be expected to be a cost
effective approach to computing. Their architecture explicitly addresses the important fault tolerance issue.
3. Clouds are commercially supported and so one can expect reasonably robust
software without the sustainability difficulties seen from the academic software systems critical to much current Cyberinfrastructure.
4. There are three major vendors of clouds (Amazon, Google, Microsoft) and many
should develop in a healthy innovative fashion. Further attention is already being given to cloud standards.
5. There are many Cloud research, conferences and other activities with research
cloud infrastructure efforts including Nimbus, OpenNebula, Sector/Sphere, and Eucalyptus.
6. There are a growing number of academic and science cloud systems supporting
users through NSF Programs for Google/IBM and Microsoft Azure systems. In the NSF community, FutureGrid (59) offers a Cloud testbed. Magellan (60) is a major DOE experimental cloud system. The EU Framework 7 project VENUS-C (61) illustrates the international scope of Cloud research.
7. Clouds offer "on-demand" and interactive computing that is more attractive than
batch systems to many users.
Despite the long-term advantages listed above, these are still early days for scientific cloud computing and work remains to be done. The problems with using clouds are well documented and include the following:
1. The centralized computing model for clouds runs counter to the concept of
"bringing the computing to the data" and bringing the "data to a commercial cloud facility" may be slow and expensive.
2. There are many security, legal and privacy issues similar to those on the Internet
that are especially problematic in areas such health informatics where proprietary information could be exposed.
3. The virtualized networking currently used in the virtual machines in today’s
commercial clouds and jitter from complex operating system functions increases synchronization/communication costs. This is especially serious in large scale parallel computing and leads to significant overheads in many MPI applications. Indeed the usual (and attractive) fault tolerance model for clouds runs counter to the tight synchronization needed in most MPI applications.
Some of these issues can be addressed with customized (private) clouds and enhanced bandwidth from TeraGrid to commercial cloud networks. For example, there could be growing interest in "HPC as a Service" as exemplified by Penguin Computing on Demand. However it seems likely that clouds will not supplant traditional approaches for very large-scale parallel (MPI) jobs in the near future. It is natural to consider a hybrid model with jobs running on either classic HPC systems or clouds or in fact both as a given workflow (as in example below) could well have individual jobs suitable for different parts of this hybrid system.
Microsoft Dryad system for Windows clusters. One can compare MPI, MapReduce (with or without virtual machines) and different native cloud implementations and find comparable (with a range of 30%) performance on applications suitable for these paradigms. MapReduce and its extensions offer the most user-friendly environment.
One can describe the difference between MPI and MapReduce as follows. In MapReduce multiple map processes are formed, typically by domain (data) decomposition familiar from MPI. These run asynchronously, typically writing results to a file system that is consumed by a set of reduce tasks that merge parallel results in some fashion. This programming model implies straightforward and efficient fault tolerance by re-running failed map or reduce tasks.
In contrast, MPI addresses a more complicated problem with iterative compute-communicate stages with synchronization at the communication phase. This synchronization means for example that all processes wait if one is delayed or failed. This inefficiency is not present in MapReduce, where resources are released when individual map or reduce tasks complete. MPI of course supports general (built in and user defined) reductions so MPI could be used for applications of the MapReduce style. However the latter offers greater fault tolerance and user-friendly, higher level environment largely stemming from the coarse grain functional programming model implemented as side-effect free tasks. Over-simplifying, MPI supports multiple Map-Reduce stages, but MapMap-Reduce supports just one. Correspondingly, clouds support applications that have the loose coupling supported by MapReduce, while classic HPC supports more tightly coupled applications. Research into extensions of MapReduce attempt to bridge these differences.
MapReduce covers many high-throughput computing applications including "parameter searches". Many data analysis applications including information retrieval fit the MapReduce paradigm. For example, in Large Hadron Collider or similar accelerator data, maps consists of Monte Carlo generation or analysis of events while reduction is construction of histograms by merging those from different maps. In the SAR data analysis of ice sheet observations, maps consist of independent Matlab invocations on different data samples. Life Sciences have many natural candidates for MapReduce including sequence assembly and the use of BLAST and similar programs. On the other hand partial differential equation solvers, particle dynamics and linear algebra require the full MPI model for high performance parallel implementation.
2.2.2 Research Areas for Scientific Computing with MapReduce and Clouds
There are many software challenges including MapReduce itself; its extensions (both in functionality and higher level abstractions); and improved workflow systems supporting MapReduce and the linking of clients, clouds and MPI engines. We have noted research challenges in security and there is also active work in the preparation, management and deployment of program images (appliances) to be loaded into virtual machines. The intrinsic conflict between virtualization and the issues around locality or affinity (between nodes in MPI or between computation and data) needs more research.
On the infrastructure side, we have already discussed the importance of high quality networking between MPI and cloud systems. Another critical area is file systems where clouds and MapReduce use new approaches that are not clearly compatible with traditional TeraGrid approaches. Support of novel databases such as Big Table across clouds and MPI clusters is probably important. Obviously NSF and the computational science community needs to decide on the balance between use of commercial clouds as well as "private" TeraGrid clouds mimicking Magellan and providing the large scale production facilities for codes prototyped on FutureGrid.
2.3 Cloud Computing for Sensor Grids
2.3.1 Cloud Computing and Sensor Data Sustainability
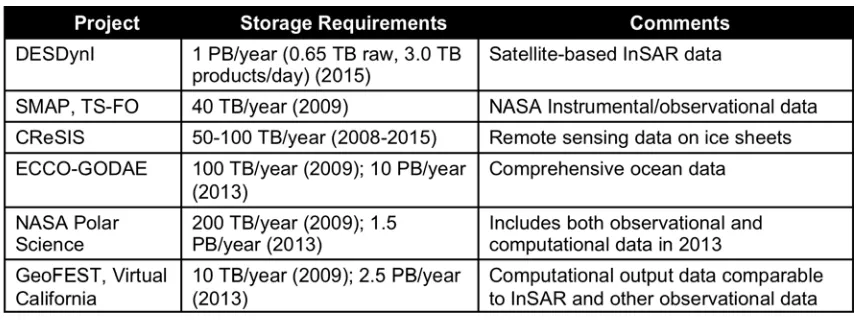
[image:16.612.93.523.453.613.2]Previous sections in this report have examined general Cloud computing concepts. We now specialize our discussion to consider sensor data and other geospatial applications in clouds. We start with two key observations on environmental and other sensor data sources: a) data sizes are rapidly increasing, and b) data and data processing pipelines are inseparable. We illustrate the first point in Table 2-1.
Table 2-1 Example size increases for selected geosopatial applications.
End user scientists are most likely to get data at the end of the pipeline (“Level 4” in the figure).
Figure 2-1 Processing pipeline for NASA UAVSAR synthetic aperture radar data. Levels indicated in the figure are NASA CODMAC levels.
The problem for long-term data preservation is that it is not worthwhile to store only the final data products, as the products cannot be understood or reproduced without storing the entire pipeline.
• We believe one of cloud computing’s potential (and currently unrealized)
applications is to enable the permanent preservation of processing pipelines. Through the use of virtual machines, it is possible to preserve exactly the operating systems and software stacks used in the pipeline steps. Data can be made available using Cloud-style interfaces (Amazon S3, for example). We believe these have the best chance for long-term sustainability, given the size of the current successful commercial investment. Finally, the actual processing pipeline itself may be implemented using MapReduce or similar cloud programming paradigms.
2.3.2 Cloud Computing and Grid Computing
distributed table data storage and the map-reduce programming model. These are not inconsistent with goals of Grid Computing, but in practice most Grid work has focused on areas like virtual organizations that arise when one links resources and people across administrative domains (that is universities and national labs), as exemplified by the TeraGrid and OSG. Large commercial clouds are geographically distributed, but they federate systems that have similar processes and management and so do not face many integration issues tackled by Grids. Some concepts, including service oriented architectures and workflow for scientific computing, were pioneered by grids and are equally important for clouds.
Academic surveys and initial investigations of clouds are available from (16,17, 18), and Clouds from a Grid perspective are discussed in (19). A key distinguishing feature of Grids is the “virtual organization” (20). Grids are designed to support virtual organizations that federate multiple real, independent organizations with heterogeneous resources. In contrast, commercial Clouds are controlled by single entities (corporations such as Amazon, Google, or Microsoft), and the virtual organization problem is not central. This may change as more resource-limited organizations (such as universities) stand up campus Clouds. Instead, Clouds expose a more user-centric view of their infrastructure: service agreements are between the user and the cloud provider, rather than between two resource providers attempting to federate themselves. We will focus on two specific aspects of the elastic capabilities of Cloud services: Infrastructure as a Service and runtime Software as a Service.
2.4 Infrastructure as a Service
At the lowest and simplest level, clouds are typically implemented using virtual machines and virtual storage deployed on large computing and data centers. Users control the lifecycle of their virtual infrastructure through Web service-exposed programming APIs and Web user interfaces. A virtual machine is a software implementation of a computer than runs on a real computer; it can have a different operating system, software stack, and network address from its host. Clouds providers use vast collections of virtual machines to provide "Infrastructure as a Service". Through Web services and virtualization, users create and control their own computing resources on remote cloud centers. A simple but powerful extension of this idea is for the virtual machines to come with software packages preconfigured. For example, one may imagine checking out a virtual machine or cluster that comes pre-configured with geospatial software (Web Map and Feature services, collections of data sets such as demographic and environmental data, and analysis software) needed for a particular investigation or to provide a particular service to a community.
individual users. The applicability of these services for hosting legacy (pre-cloud), distributed GIS data sets and services (see again for example Yang et al in this issue) is apparent. Additionally, the major Cloud vendors all have very scalable but flat data management capabilities as part of their infrastructure. Examples include Google’s BigTable, Microsoft Azure’s Table Service, and Amazon’s SimpleDB. These data management systems lack the full functionality of relational databases but work very well as extremely scalable Cloud spreadsheets. Google Maps and Google Earth are prominent GIS applications using BigTable, and Google Fusion Tables (http://tables.googlelabs.com/) includes an interesting set of GIS capabilities.
Although we have focused on commercial cloud infrastructure above, it is possible to set up a cloud using Open Source software on existing server farms and clusters. Example software includes Eucalyptus (23), Nimbus (21), and OpenNebula (www.opennebula.org). Academic cloud installations and testbeds base on these and related technologies are becoming available. The NanoHUB project at Purdue University, based on HUBzero middleware, is one of the most prominent (22). Other examples include the NSF-funded FutureGrid, the NASA-funded Nebula, and the DOE-funded Magellan testbeds.
Virtualization does come with a price: virtual machines currently introduce significant communication overhead and do not support the fastest network connections such as Infiniband. This will effect closely coupled parallel applications built with the Message Passing Interface (MPI), which commonly run on the NSF TeraGrid. We review these overheads in (27). We expect that the largest, most closely coupled scientific parallel problems will continue to run on very large clusters built with advanced rather than commodity architectures (see for example the NSF funded Blue Waters supercomputer, http://www.ncsa.illinois.edu/BlueWaters/), but many other problems in scientific computing are better suited for running on Cloud resources, as we discuss next. Furthermore, Clouds are not exclusively dependent on virtualization. Amazon's Cluster Computing Service provides access to real hardware. The FutureGrid project is also developing the infrastructure to provide real hardware as a service to support distributed computing research that is performance sensitive.
2.4.1 Infrastructure as a Service Case Study: FloodGrid
The FloodGrid pilot study focuses on inundations of the White River at Ravenswood area in Indianapolis, using the 2D hydraulic model, FaSTMECH (30), calibrated for the region. Real-time forecast data from the National Weather Service's Advanced Hydrologic
Predication Service (http://water.weather.gov/ahps2/hydrograph.php?wfo=ind&gage=nori3) provide initial
conditions of the simulation. The Computational Fluid Dynamics General Notation System (CGNS) (31) bridges the computation model and its environmental surface-water applications by providing a standard data format and the framework for exchanging data in that format. A complete Flood Grid study consists of Web Services for flood monitoring, simulation, damage estimation, and visualization. Figure 2-2 outlines the service stack in such a workflow.
[image:20.612.106.504.445.595.2]The river data monitoring service constantly monitors the NWS real-time forecast and starts recording both the flow gauge and the river stage data up to 6 days into the future once a pre-defined flood condition is met. During a flood study, the CGNS input process service infuses such information as initial conditions into the pre-calibrated regional model represented by a CGNS file. The updated CGNS file is in turn fed to the flood simulation service as the input to perform the FaSTMECH simulation, which stores computation results by once again updating the given CGNS file. The CGNS output process service parses the FaSTMECH simulation results and produces rectilinear flood depth grids using nearest neighbor clustering techniques. The loss calculation service overlays the generated flood grids with parcel property data and calculates percentage damages using the Hazards U.S. Multi-Hazard (HAZUS-MH) (www.fema.gov/prevent/hazus) analysis tools. Finally the map tile cache service visualizes the study results in Google Maps.
Figure 2-2 Flood Grid Servic Stack and Workflow. Each component (gray box) is a network accessible service with well-defined inputs and outputs expressed using the Web Service Description Lanaguage.
query, and output retrieval. The simulation service is deployed on the Gateway Hosting Service at Indiana University (33), a virtual machine-based hosting infrastructure. Flood damage estimation and visualization services are developed with Visual Basic .NET, and deployed under Internet Information Services (IIS) by the Polis Center.
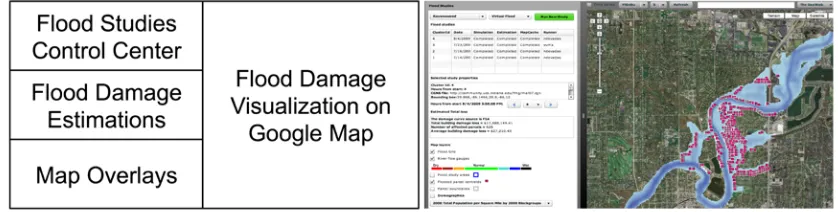
Figure 2-3 depicts the layout of the user interface on the left, with the corresponding screenshot on the right. Upon registration, a user can run new studies or review an earlier one in the flood studies control center. The execution status of each service in the study workflow is also displayed under this section. For a completed study, simulation results are visualized with Google Maps displaying flooded regions and damaged parcel properties that are obtained from regional Web Feature Services. The map overlay section enables mash-ups with other online geospatial services such as county parcel maps and demographic maps from Social Assets and Vulnerabilities Indicators (SAVI) Community Information System (www.savi.org).
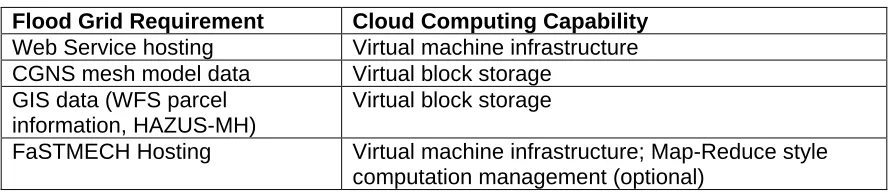
[image:21.612.93.512.484.590.2]FloodGrid, as described above, is an example of a "Grid of Grids" federation of several services, rather than a cloud. However, we use FloodGrid to illustrate the advantages of using both Infrastructure and Software as a Service. We map the Flood Grid infrastructure requirements to Cloud Computing infrastructure in Table 2-2. An important requirement for FloodGrid’s infrastructure is reliable service hosting to make sure that the services illustrated in Figure 2-2 are persistently available, with redundancy and load balancing. It is certainly possible to have these capabilities without using Cloud-based virtualization, but virtualization can be used to build redundancy into the fabric of the infrastructure rather than placing this burden on the developers. This is the key design feature of the Gateway Hosting Service, an in-house Infrastructure as a Service system. In two years of operation (from July 2008), FloodGrid's hosted service has experienced 6 outages totaling just under 16 hours.
Clouds would also be useful as providers of standard data libraries (CGNS files of hydrological models) through virtual block stores. For FloodGrid, the central piece is a validated CGNS input mesh that models a particular section of a river. Although only one such model was available to us for the study, one may envision a librariy of calibrated models for different geographical areas available for checkout from virtual block storage services. Similarly, standard GIS data sets (parcel and demographic information) can also be delivered in this fashion, coupled to the Web Feature Service that provides them. That is, one would not need to reply upon a third party Web service with its own reliability concerns. Instead, GIS data providers could provide virtual images of their data and software that can be instantiated by other developers on a Cloud as needed. Finally, we note that the system could use pre-configured virtual machines that include FasTMECH, Swarm, and all supporting software to distribute the system to other groups wanting to run their own versions of FloodGrid.
Table 2-2 Mapping FloodGrid infrastructure requirements to Cloud Computing.
Flood Grid Requirement Cloud Computing Capability
Web Service hosting Virtual machine infrastructure
CGNS mesh model data Virtual block storage
GIS data (WFS parcel information, HAZUS-MH)
Virtual block storage
FaSTMECH Hosting Virtual machine infrastructure; Map-Reduce style
computation management (optional)
FloodGrid and Elastic Clouds: As described above, FloodGrid is can support both
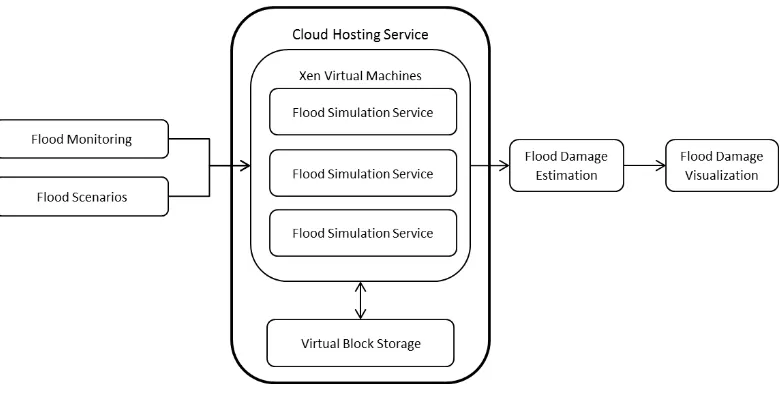
automated and on-demand usage scenarios. Both are motivating case studies for elastic resources, since the infrastructure usage levels are very low on average but spike during flood events. The core flood simulation is the FaSTMECH computation program; it is the most compute intensive part of FloodGrid project. When a flood is happening, FloodGrid will automatically start the flood simulation through its flood monitoring service for all regions of interest. Users responsible for disaster planning and emergency response will also place increased demands on the system to simulate different flood scenarios. Computing power demand thus peaks in a narrow period of the flood event. We illustrate how elastic resources may be used in this scenario; see Figure 2-4.
Figure 2-4 Virtualization is used to elastically increase the FloodGrid simulation service to handle greater demand during flood events.
To test this configuration, ten flood scenarios with the different flood forecast parameters (based on the historical flood data) are added to the flood simulation queue. Four virtual machines with FaSTMECH computing service are allocated automatically according to the computing time estimation. The estimated FaSTMECH running time ranges from 30 minutes to several hours. To provide rapid simulation result delivery with cloud computing resource cost in consideration, four virtual machines are allocated based on the estimation. Ten flood simulations are sent into the queue in random order. With 4 virtual machines, all the FaSTMECH jobs finished in 205 minutes. For comparison, 10 jobs can be finished in 739 minutes with only one virtual machine.
We note in conclusion that no significant modification of the Flood Grid workflow was made in this example. Instead, the elastic nature of clouds allowed us to increase the infrastructure available to our service during a peak event by cloning pre-configured virtual machines. We examine programming models for clouds in the next section.
2.5 Software as a Service
aws.amazon.com/elasticmapreduce/). MapReduce and its competitors (prominently, Microsoft’s Dryad (26)) are designed to solve very large, data-file parallel information retrieval problems that arise in Internet-scale searching and indexing. MapReduce is designed to manage computing tasks in distributed environments for certain classes of parallel problems: those associated with fragmentable data sets. Although it can be applied to a wide range of problems (24), it generally is designed to support data-file parallelism; that is, we need to apply an operation or a sequence of operations to huge input files that can be split into smaller fragments on distributed file systems. The individual operations need little or no communication with each other. In contrast, traditional parallel programming, based around the Message Passing Interface (MPI), is better suited for tightly coupled applications with significant inter-process communication. The notion of file parallelism can be generalized memory, network, and other standard input/output mechanisms. Processing and mining sensor streams in a large sensor Web are obvious applications for stream data parallelism. Although not supported by Hadoop, this is an intended feature of Dryad and has been explored by research groups (27, 28).
MapReduce is usually motivated by examples that count the number of occurrences of each word in a large collection of documents. Counting land-use changes is a simple geospatial example that provides an elementary motivation for cyber-GIS. In this example, we have a large amount of land-use classification images from two different time periods covering the same area. For each pixel, it has a label to indicate the type of land-use. We can use MapReduce to produce the cross-table of land-use from two times. In the map stage, the land-use change of two corresponding pixels is recorded as (“landuse1->landuse2”, count), e.g. (“agriculture -> residential”, 1). In reduce stage, the list of counts is summed up by the key (“landuse1->landuse2”).
There are certain obvious advantages in applying MapReduce to spatial data processing. First, MapReduce scales well, enabling data processing procedures to move smoothly from smaller test-beds (as small as a single node) during development and debugging to larger cluster and cloud environments. This scalable geospatial processing is crucial to spatial applications that deal with large volumes of spatial data. Second, the HDFS distributed file system makes it easy to handle large volume of spatial data. Third, existing binary can be deployed on the cloud through Hadoop streaming. Finally, tiled spatial data system, such as Google Map and Microsoft Bing Map are well suited for MapReduce. We will examine these issues in our PolarGrid case study below.
meaningful ranges for each separate map tasks. We provide an example in our PolarGrid case study below. Third, existing spatial data processing binaries may be not able to access the HDFS file system directly, so wrappers have to developed to load/unload data between HDFS file system and local file system. This can introduce significant overhead if done frequently.
MapReduce programming model can be used in several different ways to support data-intensive spatial processing; there are three basic execution units (38):
1. Map only application: only the mapper is presented, it is suitable for one-step
spatial data transformation operations, e.g. map projection and image filter.
2. MapReduce application: both mapper and reducer are used. It has been used to
build spatial index, performance querying and obtain statistical information (39,40,41).
3. Iterative MapReduce application: it runs MapReduce iteratively until certain
criteria meets. It is suitable to spatial clustering and data mining algorithms, such as K-means clustering (42).
MapReduce as a programming model for clouds has received significant attention from the academic community. However, it is not a panacea, and it will not meet all the computing requirements of sensor grids and related applications. MapReduce is a batch-processing approach for batch-processing files registered with a fault-tolerant overlay file system (the Google File System or the Hadoop Distributed File System). Problems such as large-scale image processing are the best fits for this programming style. However, legacy, relational database-centric geospatial problems are not well suited for MapReduce, and relational data processing on a cloud is an open problem. Instead of relational databases, cloud data management systems focus on highly scalable but not relational, "NoSQL" approaches that sacrifice strong consistency for scalability. In contrast, a great deal of geospatial processing is associated with geospatial databases that extend classic relational database systems such as PostgreSQL and Oracle.
MapReduce's reliance on files as an implicit data model and its close integration with the file system are important limitations. Quadtree-modeled data (often used for indexing collections of two-dimensional images such as map tiles) can be adapted straightforwardly, but the more geospatial object-centric R-tree encoded data (such as geospatial features) are not a good match. As perhaps an intermediate step, many commercial clouds are beginning to offer relational databases as services. Microsoft Azure's SQL Service (based on SQL Server) and Amazon RDS (based on MySQL) are two examples.
indexing system, Percolator (49), which has replaced MapReduce as its internal mechanism for calculating search rankings. Unlike MapReduce, Percolator maintains state, avoiding the need to completely recalculate ranking indices. Related systems from Yahoo and Microsoft are described in (50) and (51), respectively. These systems are potentially interesting models for real-time geospatial processing.
2.5.1 Software as a Service Case Study: SAR Image Post-Processing
In this case study, we examine the cloud computing requirements of a common problem: image processing. We are motivated by the need to determine the depth and shape of underlying rock beds beneath the Greenland and Antarctic glaciers (34). Detailed knowledge of the rock beds is needed to develop new models to replace the inadequate current models of glacial motion. These are examples also of data-parallel computing. We begin with a description of the general system before evaluating MapReduce for image processing.
[image:26.612.108.504.510.579.2]The sub-glacial terrain images acquired from Synthetic Aperture Radar (SAR) reveal ice sheet thickness and the details of internal ice layers over vast areas beneath the 3 KM-thick Greenland ice sheet (35). Approximately 25 TB of raw SAR data are available for processing Polar Grid resources from the 2008-2009 campaigns (45). A single research group can manage initial data processing as a one-time exercise since there are generally no optional processing steps that need to be explored. However, higher-level data products, such as improving the SAR image qualities in post-processing, require human interaction. One main image quality issue is speckle noise. The speckle noise usually appears as random granular patterns, which can reduce the image resolution and give the image a fuzzy appearance. Applying proper filters enhances the image quality and improves the interpretation of sub-glacial structures. SAR image processing is computationally intensive; it is desirable to use a scalable approach for parallel SAR image post-processing. In this pilot project, we have evaluated both the use of map-reduce methods to initial data processing and the service-based infrastructure requirements needed to support user-driven filtering. Filters are shown in Table 2-3.
Table 2-3 Testing dataset and filters
Data and Filters Parameters
Helheim dataset Size: 17023 (w) x 970 (h), ground track: 67 km
Medium filter Horizontal and vertical length (h, v)
Wiener filter Horizontal and vertical length (h, v)
Fir1 filter Cut off frequency (f)
Case Study Example: Hadoop and SAR Image Post-Processing: SAR image processing is a data-parallel problem and so well suited for map-reduce in principal. Matlab is a common development environment in many fields, including signal image processing, so it is important to determine if it can feasibly be combined with Hadoop. We perform our evaluation on the same testbed described above. We begin with a small example that nevertheless illustrates some problems porting Matlab to Hadoop.
Matlab and MCR have some special properties that influence the performance in Hadoop. First, we must overcome a mismatch between Matlab's standard input/output mechanisms and the Hadoop Distributed File System (HDFS). Matlab standard input (stdin) and standard output (stdout) are associated with a shell or command window. This means Matlab scripts can’t interact directly with HDFS. As a workaround, we developed a python wrapper to load the SAR input file from Hadoop into the local file system. After the file is processed, the output images are sent back to HDFS by the same python script. Second, MCR includes support for multi-cores; however, it will only take advantage of multi-cores in certain computations, such as the FIR filtering operation used in this application. Finally, MCR makes use of thread locking and only one thread is allowed to access the MCR at a time. Consequently the numbers of mappers and reducers on a computing node do not influence the performance of MCR on Hadoop, which processes threaded computing jobs in the sequential order.
In this example, the complied Matlab script works as the mapper, and there is no “reduce” phase. 100 random chosen pairs of filter and parameter are used for the performance test. It takes 1353 seconds for the master node to finish these 100 image-processing jobs. On a slave node, it takes 2553 seconds. In the Hadoop streaming environment, Hadoop distributes computing jobs equally among three computing nodes, and takes 901 seconds to finish, roughly 1.5 times speed up over the best node. Since each node has been assigned an equal number of image processing jobs, slower slave machines impact the performance more. It is possible to develop a customized input splitter that distributes more jobs to the faster master node. We conclude from this example that Hadoop streaming is an easy way to deploy a data-parallel application built from a Matlab binary. However, a custom wrapper is necessary to stage stdin/stdout data between HDFS and the Matlab application. To improve the performance, frequent file operation should be avoided in Matlab applications. A major drawback is that the total number of computing nodes, instead of computing cores, determines Hadoop streaming performance in this case.
We next examine using MapReduce to produce reduced data products from the processed data. For this test, we developed a sample Matlab application, which implements the specially tailored Douglas-Peucker algorithm (47) to simplify the flight line data, and compiled it as a standalone executable. Again, the MCR allows us to port our compiled program to a cluster running our Hadoop installation. Flight line simplification is a data-parallel problem and well suited for MapReduce in principal. Hadoop streaming is used to run MapReduce tasks.
System. This script also acted as a Hadoop reader to read the flight line’s native binary format; this eliminates the needs to convert the data into text format in advance. In the map stage, the Maltab executable is used to simplify the flight line by smaller chunk in 5000 points each. The simplified points are reorganized by flight line section and time stamp.
3 Vulnerability and Mitigation Techniques for Cloud
Computing with Sensor Grid
Sensor technology plays critical roles in supporting war fighters and military personnel as they engage in operations that could be high stress and life threatening. We consider scenarios and systems in which there are large groupings of sensors reporting huge quantities of potentially sensitive data, and the need to perform large amounts of processing or computation on this data with large grid and cloud computing installations. Further, we consider that there are adversaries that have a vested interest in either learning information from the system, modifying the results finally output from the system (be it through modification of the sensor input, filtering or processing of data), or denying access to the system. All aspects of these systems and the environment in which some parts of the system operate are assumed to be susceptible to attack. Our goal is to be able to provide reliable results computed from sensor data, in a manner that enables one (be it the user or the system) to make educated decisions on the reliability of that data based on trust metrics, while simultaneously preventing the loss of data-secrecy or integrity. Further, maintenance of system integrity and security is considered a core requirement. Issues such as anonymity and data-providence are important, but beyond the scope of this document.
3.1 Introduction: Security, Privacy and Trustworthiness Issues
The computing environments of a sensor grid are fraught with different kinds of threats, which endanger the security and privacy assurance the system can provide. Mitigation of these threats relies on establishing trust on individual system layers through proper security control. In this section, we survey the security and privacy risks on each layer of senor-grid computing and the technical challenges for controlling them.
A sensor grid interacts with its operating environment through a set of sensors. Those sensors work either autonomously or collaboratively to gather data and dispatch them to the grid. Within the grid, a brokering system filters and routes the data to their subscribers, the clients of the sensor grid. We now describe the security and privacy issues on each layer of such an operation. This includes the environment the sensors are working in; the sensors; the grid; the clients; and the communications between the sensor and grid and the grid and clients.
Sensors. Sensors can be tempered with by the adversary who can steal or modify the data they collect. Mitigation of this threat needs the techniques that detect improper operations on the sensors and protect its sensitive data.
Grid. Information flows within the grid can be intercepted and eavesdropped on by malicious code that are injected into the system through its vulnerabilities. Authentication and information-flow control needs to be built into the brokering system to defend against such a threat.
Client. The adversary can also manage to evade the security and privacy protection of the system through exploiting the weaknesses of the clients’ browsers. The current design of browsers is well known to be insufficient for fending off attacks such as cross-site scripting (XSS) and cross-site request forgery (XSRF). Such weaknesses can be used by the adversary to acquire an end user’s privileges to wreck havoc on the grid. Defense against the threat relies on design and enforcement of new security policy model that improves on the limitations of the same origin policy adopted in all of the mainstream browsers.
Communication Channels. The communications between the sensors and the grid, and the grid and the client, are subject to both passive (e.g., eavesdropping) and active (e.g., man-in-the-middle) attacks. Countering this threat depends on proper cryptographic protocols that achieve both data protection and mutual authentication. A more tricky issue here is the information leaks through side channels, for example, packet sizes and sequences. Our preliminary research shows that such information reveals the state of web applications, which can be further utilized to infer sensitive data within the application. Understanding and mitigating the problem needs further investigation.
In our research we focused on the following specific topics:
Side-channel detection and mitigation. Side-channel analysis has long been known to be a serious threat to information confidentiality. Within a sensor grid system both the communication between the sensors and the grid and that between the grid and clients are subject to this threat. Our preliminary result shows that the design of the Web applications, which is built upon the interactions between its client component and server component, makes it vulnerable to traffic analysis. Techniques can be developed to infer the internal states of the traffic (packet size, directions and number) between its two components.
3.2 Side-channel Leaks in Software as a Service: Threats and
Defense
With the industrial trend of software-as-a-service, more applications are delivered on the web. Unlike a desktop application, a web application is split into browser-side and server-side components. A subset of the application’s internal information flows are inevitably exposed on the network. Our research shows that despite encryption, side-channel information leak is a realistic and serious threat to user privacy [73]. Specifically, we found that surprisingly detailed sensitive user information is being leaked out from a number of high-profile, top-of-the-line web applications in healthcare, taxation, investment and web search: an eavesdropper can infer the illnesses/ medications/surgeries of the user, the user’s family income and investment secrets, despite HTTPS protection; a stranger on the street can glean enterprise employees' web search queries, despite WPA/WPA2 Wi-Fi encryption. More importantly, the root causes of the problem are some fundamental characteristics of web applications: stateful communication, low entropy input for better interaction, and significant traffic distinctions. Thus the scope of the problem seems industry-wide. We also performed concrete analyses to demonstrate the challenges of mitigating these vulnerabilities, which suggest the necessity of a disciplined engineering practice for side-channel mitigations in future web application developments.
To answer this urgent call, we developed a suite of new techniques for automatic detection and quantification of side-channel leaks in web applications. Our approach,
called Sidebuster [74], can automatically analyze an application’s source code to detect
its side channels and then perform a rerun test to assess the amount of information disclosed throughsuch channels (quantified as the entropy loss). Sidebuster has been designed to work on event-driven applications and can effectively handle the AJAX GUI widgets used in most web applications. In our research, we implemented a prototype of our technique for analyzing GWT applications and evaluated it using complicated web applications. Our study shows that Sidebuster can effectively identify the side-channel leaks in these applications and assess their severity, with a small overhead.
Summary of findings and results
1. Analysis of the side-channel weakness in web applications. We come up with
a model to analyze the side-channel weakness in web applications and attribute the problem to prominent design features of these applications. We discovered concrete vulnerabilities in high-profile and really popular web applications, which disclose different types of sensitive information due to various application features. These studies lead to the conclusion that the side-channel information leaks are likely to be fundamental to web applications.
2. In-depth study on the challenges in mitigating the threat. We evaluated the
protected. This suggests the necessity of a significant improvement of the web application development practice.
3. We propose the first technique for automatic detection of side-channel leaks
in web applications. Built upon existing technologies such as taint analysis, our
approach can effectively evaluate the source code of those applications to identify the program locations where sensitive user data affects encrypted communication through data flows and/or control flows. We offered novel solutions to the technical challenges associated with the special features of web applications, particularly their extensive use of AJAX GUI widgets.
4. We present a novel technique for quantifying the side-channel leaks in web
applications. The new technique can measure not only the information disclosed
from a single taint source but also that aggregated from multiple sources, according to the dependency relations among these sources.
5. Design and implementation of a preliminary mitigation framework. We
implemented our techniques into a prototype for analyzing the web applications built upon Google Web Toolkit (GWT), and evaluated it over real-world or synthesized applications. Our study shows that Sidebuster worked effectively on these applications and incurred acceptable overheads. We also designed a platform over which the application developers specify privacy policies, and the browser and the web server collaborate to enforce the policies. We implemented a prototype of the design and evaluated its functional correctness.
6. Research paper. Two peer-reviewed research papers are published at the IEEE
Symposium on Security and Privacy (Oakland 2010) and the ACM Conference on Computer and Communications Security (CCS 2010), two flagship security venues, respectively.
7. Video demonstration. Video demonstrations of our work are available at the
following links:
https://sites.google.com/site/ourdemos/
http://www.youtube.com/watch?v=WTqaLCUNYFM&feature=related http://www.youtube.com/watch?v=NsrSroM8ePo&feature=mfu_in_order&list=UL
3.2.1 A Simple Model for Analyzing Side-channel Leaks in Web and Cloud Applications