Abstract: Present days renewable resource is used to generate energy required for most of the applications, like solar energy is used as water heater. Lot of research work is going on to utilize the efficient energy from solar and another important area is power generation. In power generation solar energy is taking vital role. This work is done to get the maximum power from the solar energy by studying different MPPT algorithms and particularly in fractional open-circuit voltage (FOCV) and perturb and observe (P&O) algorithms are used. Both MPPT algorithms are used to get maximum power. FOCV MPPT algorithm is implemented to avoid power interruption at load and P&O is used to maintain the region of MPP. Advantages of both algorithms are achieved.
Keywords : FOCV, MPPT algorithm, P&O, Solar PV Power.
I. INTRODUCTION
The energy sources like fossil fuels are used to supply the energy demand in the world, which generates carbon contents and spoil the environment which leads to Global Warming [1]. Solar system is the best available energy resource for micro grid system; it can also be used as base load point [2].
Using present technology a solar energy can be made efficient renewable energy source. The solar PV array is used to convert light energy into electrical energy. PV array consists of several solar cells in it and these cells produces energy depends on the amount of solar radiation and intrinsic properties of it [3]. Depends on the application requirement the size of the PV array is decided.
There are several MPPT techniques which operate on maximum power point available like: Perturb and Observe algorithm, Incremental Conductance algorithm, Fraction open-circuit voltage (FOCV) algorithm, Constant Voltage algorithm, etc. [4]. In this paper, FOCV and P&O algorithms are studied and implemented hybrid algorithm to get efficient power at the DC-DC boost converter.
Most of the FOCV algorithm is implemented with PI controller based regulator. P&O algorithm is also simple method. This MPPT algorithm is used to compute the PV power output and perturbation changes the PV voltage and current such that power also changes according to the observation of the power [5].
Revised Manuscript Received on June 05, 2019
H. S. Gangadharaiah, Assistant Professor, Department of Electrical and Electronics Enigneering, REVA University, Bangalore, India.
Dr. Prashant. V. Joshi, Associate Professor,Department of Electronics and Communication Engineering, REVA University, Bangalore, India.
The second section of the paper talks about the implementation of Solar PV System. At the output of the PV array DC-DC boost converter is implemented with FOCV algorithm and discussed in the third section. Fourth section is all about implementation of P&O algorithm. In fifth section proposed hybrid algorithm and its results are discussed. In the sixth section conclusions are drawn.
II. SOLARPVSYSTEM
MATLAB-Simulink is used to implement Solar PV array.. The PV Array model uses series resistance Rs, current
source IL, diode nI & I0 parameters, shunt resistance Rsh as
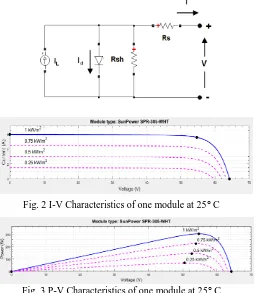
[image:1.595.305.561.353.646.2]shown Fig. 1 [6].
Fig. 1 Solar Cell internal circuit
Fig. 2 I-V Characteristics of one module at 25 C
Fig. 3 P-V Characteristics of one module at 25 C
Another two important parameters in Solar PV system are temperature and irradiance. The diode current depends on the irradiance factor and the temperature at each cell or array. The I-V characteristics showed in fig. 2 is a single solar cell characteristic, a SunPower SPR-305-WHT module. The cell operated with the constant temperature at 25 C and different irradiance with different values: 250 W/m2, 500 W/m2, 750 W/m2,
and 1000W/m2. The current varies with respect to
H. S. Gangadharaiah, Prashant. V. Joshi
irradiance values. After 50V current starts decreasing for all different irradiance. The maximum current appears at 1000 W/m2 and the current value is around 5.5A of current and 55V of voltage. At same irradiance and voltage maximum peak power is considered as shown fig. 3 around 302.5W which is a P-V characteristic. Fig. 4 shows the array of same solar cells which is a SunPower-305-WHT; 10 Series modules and 40 parallel strings. Each string gives around 550V of voltage and 5.5A of current. For 40 parallel strings total current drawn is around 220A of current and fig. 5 shows the P-V characteristics which is around 120kW of power at 550V of voltage and is a maximum peak power.
[image:2.595.294.560.48.283.2]Fig. 4 I-V Characteristics of array at 25 C
Fig. 5 P-V Characteristics of array at 25 C
The MATLAB-Simulink PV array module is used for this work, below fig. 6 shows the PV array with its input and output parameters. It consists of irradiance as an input parameter and „m‟ is a vector parameters consists of PV voltage (V_PV), PV current (I_PV), diode current (I_diode), and irradiance (W/m2) and another two terminals gives DC voltage.
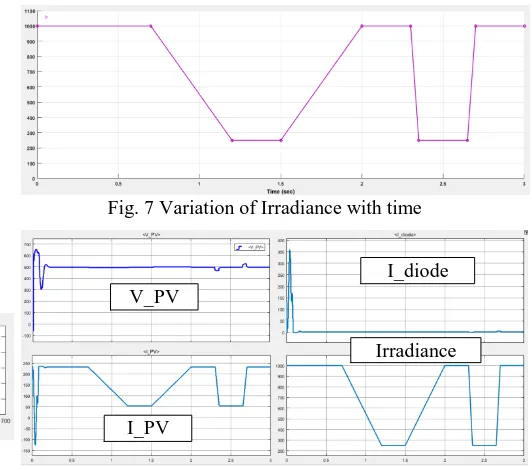
[image:2.595.45.299.306.391.2]Input parameter irradiance varies with time to analyse power variation with respect to the same, fig. 7 shows the plot of irradiance and fig. 8 shows the output parameters plot.
Fig. 6 PV Array with its parameters
Fig. 8 consists of 4 graphs, first graph is V_PV plot of 500V initially it goes more than 500V and after 0.20 second which is a switching time it remains constant. The second graph is I_diode after switching ON it becomes 0A. The third graph is I_PV is of 230A after switching time and varies with irradiance reference plot is shown in fourth graph.
Fig. 7 Variation of Irradiance with time
Fig. 8 Output parameters (V_PV, I_diode, I_PV, and Irradiance)
III. FOCVALGORITHM
Fractional open-circuit voltage algorithm is based on V_PV (the maximum voltage at the output of the PV array) which is said as maximum power point voltage and mentioned as Vmpp. This algorithm works on the base of relation
between Vmpp and VOC [7]. The maximum peak power is a
constant voltage of open-circuit voltage it is given by Eq. (1)
(1)
where kv is a constant which is between 0.7 and 0.8 depending
on the PV cell characteristic measured based on maximum power point voltage and open-circuit voltage.
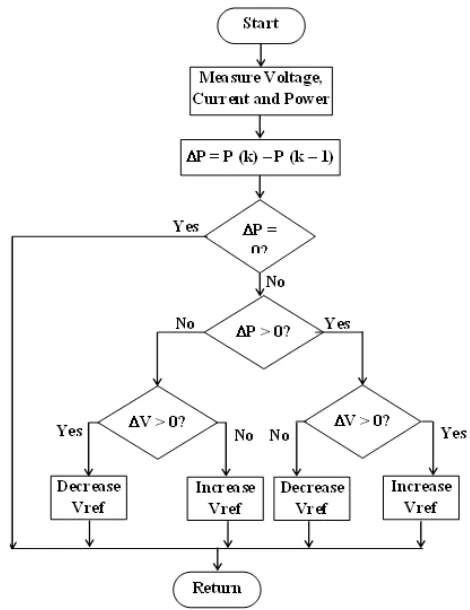
[image:2.595.319.552.489.632.2]Fig. 9 Flowchart of open-circuit voltage method [7]
The fig. 9 shows the flow chart of the algorithm [8]. The voltage generated by the diode in the cell is approximately 75% of the open-circuit voltage. Once the maximum power point is approximated, closed loop control in the PV array boost converter is used to get the desired output voltage at the PV array [9]. The open-circuit voltage taken from the PV array output, and is measured without connecting it to the load. The
maximum power point
voltage is approximated by V_PV
I_diode
I_PV
Irradiance
Isolate Photovoltaic panel
Record open-circuit voltage (V
OC)
Calculate V
MPPfrom V
OC[image:2.595.55.285.548.650.2]
taking the reference voltage in the algorithm. This algorithm is simple to implement and fig. 10 (a) shows the MATLAB-Simulink implementation.
Fig. 10 (a) Boost Converter Control (MPPT)
Fig. 10 (b) Internal FOCV Algorithm implementation
Fig. 10 (b) shows the algorithm implementation using MATLAB-Simulink. An open-circuit voltage is taken from the PV array and approximation is done considering the total number of cells in an array. The approximated voltage is then multiplied with constant kv term and the difference
output is given to PID controller to regulate the voltage.
IV. P&OALGORITHM
[image:3.595.48.295.90.295.2]P&O algorithm finds PV array voltage and current. It calculates power. Then the voltage is decreased or increased depending on the tracing of maximum power for PV array voltage. If the power and voltage are greater than zero then increases the reference voltage (Vref). If the power is greater and voltage is less than zero then voltage decreases. The algorithm follows the same technique till it gets maximum power by observing step by step and makes the changes by increasing or decreasing voltage.
Fig. 11 MATLAB Simulink model for P&O MPPT
Fig. 11 shows the MATLAB Simulink model inline with PV array as shown in fig. 6. Fig. 12 shows the flowchart for P&O algorithm [5].
V. COMPARISONOFDIFFERENTPIDCONTROLLER BASEDREGULATOR
The discrete PID controller is utilized to direct the voltage. The PID controller is a MATLAB-Simulink block, its increases are tunable either by manual process or automation.
[image:3.595.308.543.138.443.2]The PID Controller square yield is a weighted total of the i/p signal, the basic of the i/p signal, and the subsidiary of the i/p signal. The loads are the relative, essential, and subordinate addition parameters. All the diverse controller types are executed and watched the yield control in the wake of reversing the PV cluster's DC voltage.
[image:3.595.303.556.489.588.2]Fig. 11 Flow chart for Perturb and Observe Algorithm
Table 1. Comparison output power for different controller
Controller
AC
Voltage
(V)
Input Power
(kW)
Output
Power
(kW)
PID
340
120
118
PI
340
120
117.7
PD
338.5
120
62.45
VI. SIMULATIONRESULTS
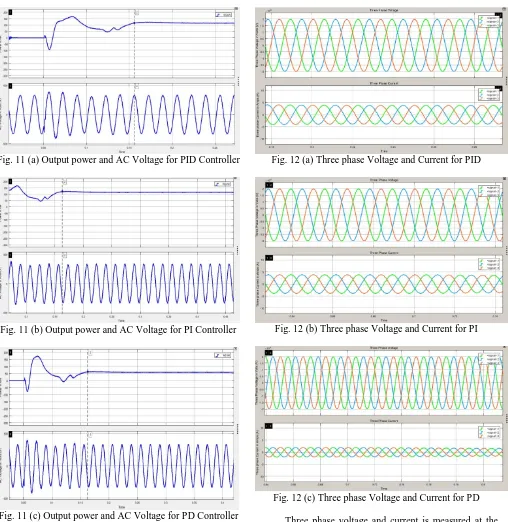
[image:3.595.98.282.544.636.2]Fig. 11 (a) Output power and AC Voltage for PID Controller
Fig. 11 (b) Output power and AC Voltage for PI Controller
Fig. 11 (c) Output power and AC Voltage for PD Controller
Fig. 11 shows the output power and AC voltage at the output of the inverter with different PID controller. Fig. 11 (a) shows the output power and AC voltage for PID controller, fig. 11 (b) for PI controller and fig. 11 (c) for PD controller. The settling time achieved (simulation) for this FOCV algorithm is around 160ms. During this settling time power fluctuations are observed. After settling time, the output power becomes constant and varies with respect to the current as current depends on the irradiance of the solar cells.
The three phase AC voltage and current appears as shown in fig. 12 for different PID controller. Fig. 12 (a) is showing the three phase AC voltage and Current for PID controller, fig. 12 (b) for PI controller, and fig. 12 (c) for PD controller. The entire FOCV algorithm is implemented with PI controller regulator.
Fig. 12 (a) Three phase Voltage and Current for PID
Fig. 12 (b) Three phase Voltage and Current for PI
Fig. 12 (c) Three phase Voltage and Current for PD
Three phase voltage and current is measured at the output of the three-phase transformer which is used to step up the voltage and given to the power-grid. The transformer parameter is as follows: three-phase 200kVA/230V/20kV. The out of the DC-DC boost converter is given to the inverter with gate controller and output of the inverter given to the three-phase transformer. The output power is measured at the output of the three-phase transformer and shown in fig. 12. The current in PD controller decreases due to the derivative term.
VII. CONCLUSIONS
The Solar PV array is implemented using FOCV algorithm to generate the power of 120kW. The complete power grid is implemented in MATLAB-Simulink to get the maximum power by using
[image:4.595.297.562.40.543.2] [image:4.595.50.558.43.565.2]type MPPT algorithm. The maximum power observed with different PID controller in FOCV algorithm. By comparing all the three different controllers, PID is the best controller which gives better output power compared with PI controller. Around 300W of power is improved by using PID controller which gives 98.33% of efficiency compared with PI controller which gives 98.08% efficiency whereas PD controller which gives 52% of efficiency and is not at all a feasible controller to be used in this algorithm.
REFERENCES
1. Kakarla .Deepti, Dr.P.Srihari, Dr.Manjunadh Achari, “Design Analysis and Implementation of MPPT based Controlling mechanism for improving the efficiency of Solar Photovoltaic based operated system”, 11th International Conference on Intelligent Systems and Control (ISCQ), 978-1-5090-2717 -0/17, IEEE 2017.
2. Umesh P. Pagrut, A. S. Sindekar, Sagar S. Lachure, Jaykumar S. Lachure, “Performance of 125 Watt PV Module using MATLAB-Simulink”, 3rd International Conference on Advances in Electrical, Electronics, Information, Communication and Bio-Informatics (AEEICB17), 978-1-5090-5434-3, IEEE 2017 3. Kartika Dubey, M.T.Shah, “Design and Simulation of Solar PV System,
2016 International Conference on Automatic Control and Dynamic Optimization Techniques (ICACDOT) International Institute of Information Technology (I²IT), Pune, 978-1-5090-2080-5/16, IEEE 2016.
4. Ameni Kchaou, Aziz Naamane, Yassine Koubaa, Nacer K M’Sirdi, “Comparative study of different MPPT techniques for a stand-alone PV System”, 17th international conference on Sciences and Techniques of Automatic control & computer engineering - STA'2016, Sousse, Tunisia, December 19-21, 2016, 978-1-5090-3407-9/16, IEEE 2016. 5. Mr. Rahul S. Sharma, Dr. P.K.Katti, “Perturb & Observation MPPT
algorithm for Solar Photovoltaic System”, International Conference on circuits Power and Computing Technologies, July 978-1- 5090-4967, IEEE 2017.
6. Radhia Garraoui, Mouna Ben Hamed, Lassaˆad Sbita, “A Robust Optimization Technique Based on First Order Sliding Mode Approach for Photovaltaic Power Systems”, International Journal of Automation and Computing, 11633-015-0902-1, Springer, 2015, 620-629. 7. Nur Atharah Kamarzaman and Chee Wei Tan, “A comprehensive
review of maximum power point tracking algorithms for photovoltaic systems”, Renewable and Sustainable Energy Reviews, 37:585 – 598, 2014.
8. Ali Reza Reisi, Mohammad Hassan Moradi, Shahriar Jamasb, “Classification and comparison of maximum power point tracking techniques for photovoltaic system: A review”, Renewable and Sustainable Energy Reviews 19 (2013), 433-443, Elsevier 2013. 9. Trishan Esram, “Comparison of Photovoltaic Array Maximum Power
Point Tracking Techniques”, IEEE Transactions on Energy Conversion, VOL. 22, NO. 2, JUNE 2007.
10. Khadidja Saidi, Mountassar Maamoun, M'hamed Bounekhla,
“Simulation and analysis of variable step size P&O MPPT algorithm for photovoltaic power control”, 978-1-5090-6287-4, IEEE April 2017.
AUTHORS PROFILE
Prof. H. S. Gangadharaiah, Assistant Professor, School of Electrical and Electronics Engineering, REVA University. M.Tech. degree from VTU, Belagavi and B.E. degree in Electronics and Communication Engineering from M.S. Ramaiah Institute of Technology, Bangalore. He is pursuing PhD in Hybrid Energy System. He has 19 years of teaching experience. His teaching experience includes, teaching subjects like Basic Electrical and Electronics, Analog Electronic Circuits, Logic Design, Linear Integrated Circuits, DSP, S&S, Field Theory, VLSI, Control System, Embedded System under UG and Advanced Power Electronics under PG. His area of Research is Hybrid Energy System.